Query Engine Log UX
The Query Engine Log UX feature lets you visualize a query and its follow-up queries as a conversation feed alongside a detail panel with metadata for each response. These details include agent execution time, query status, feedback counts, the raw and rewritten query inputs, the contents of the engine log, and the model output.
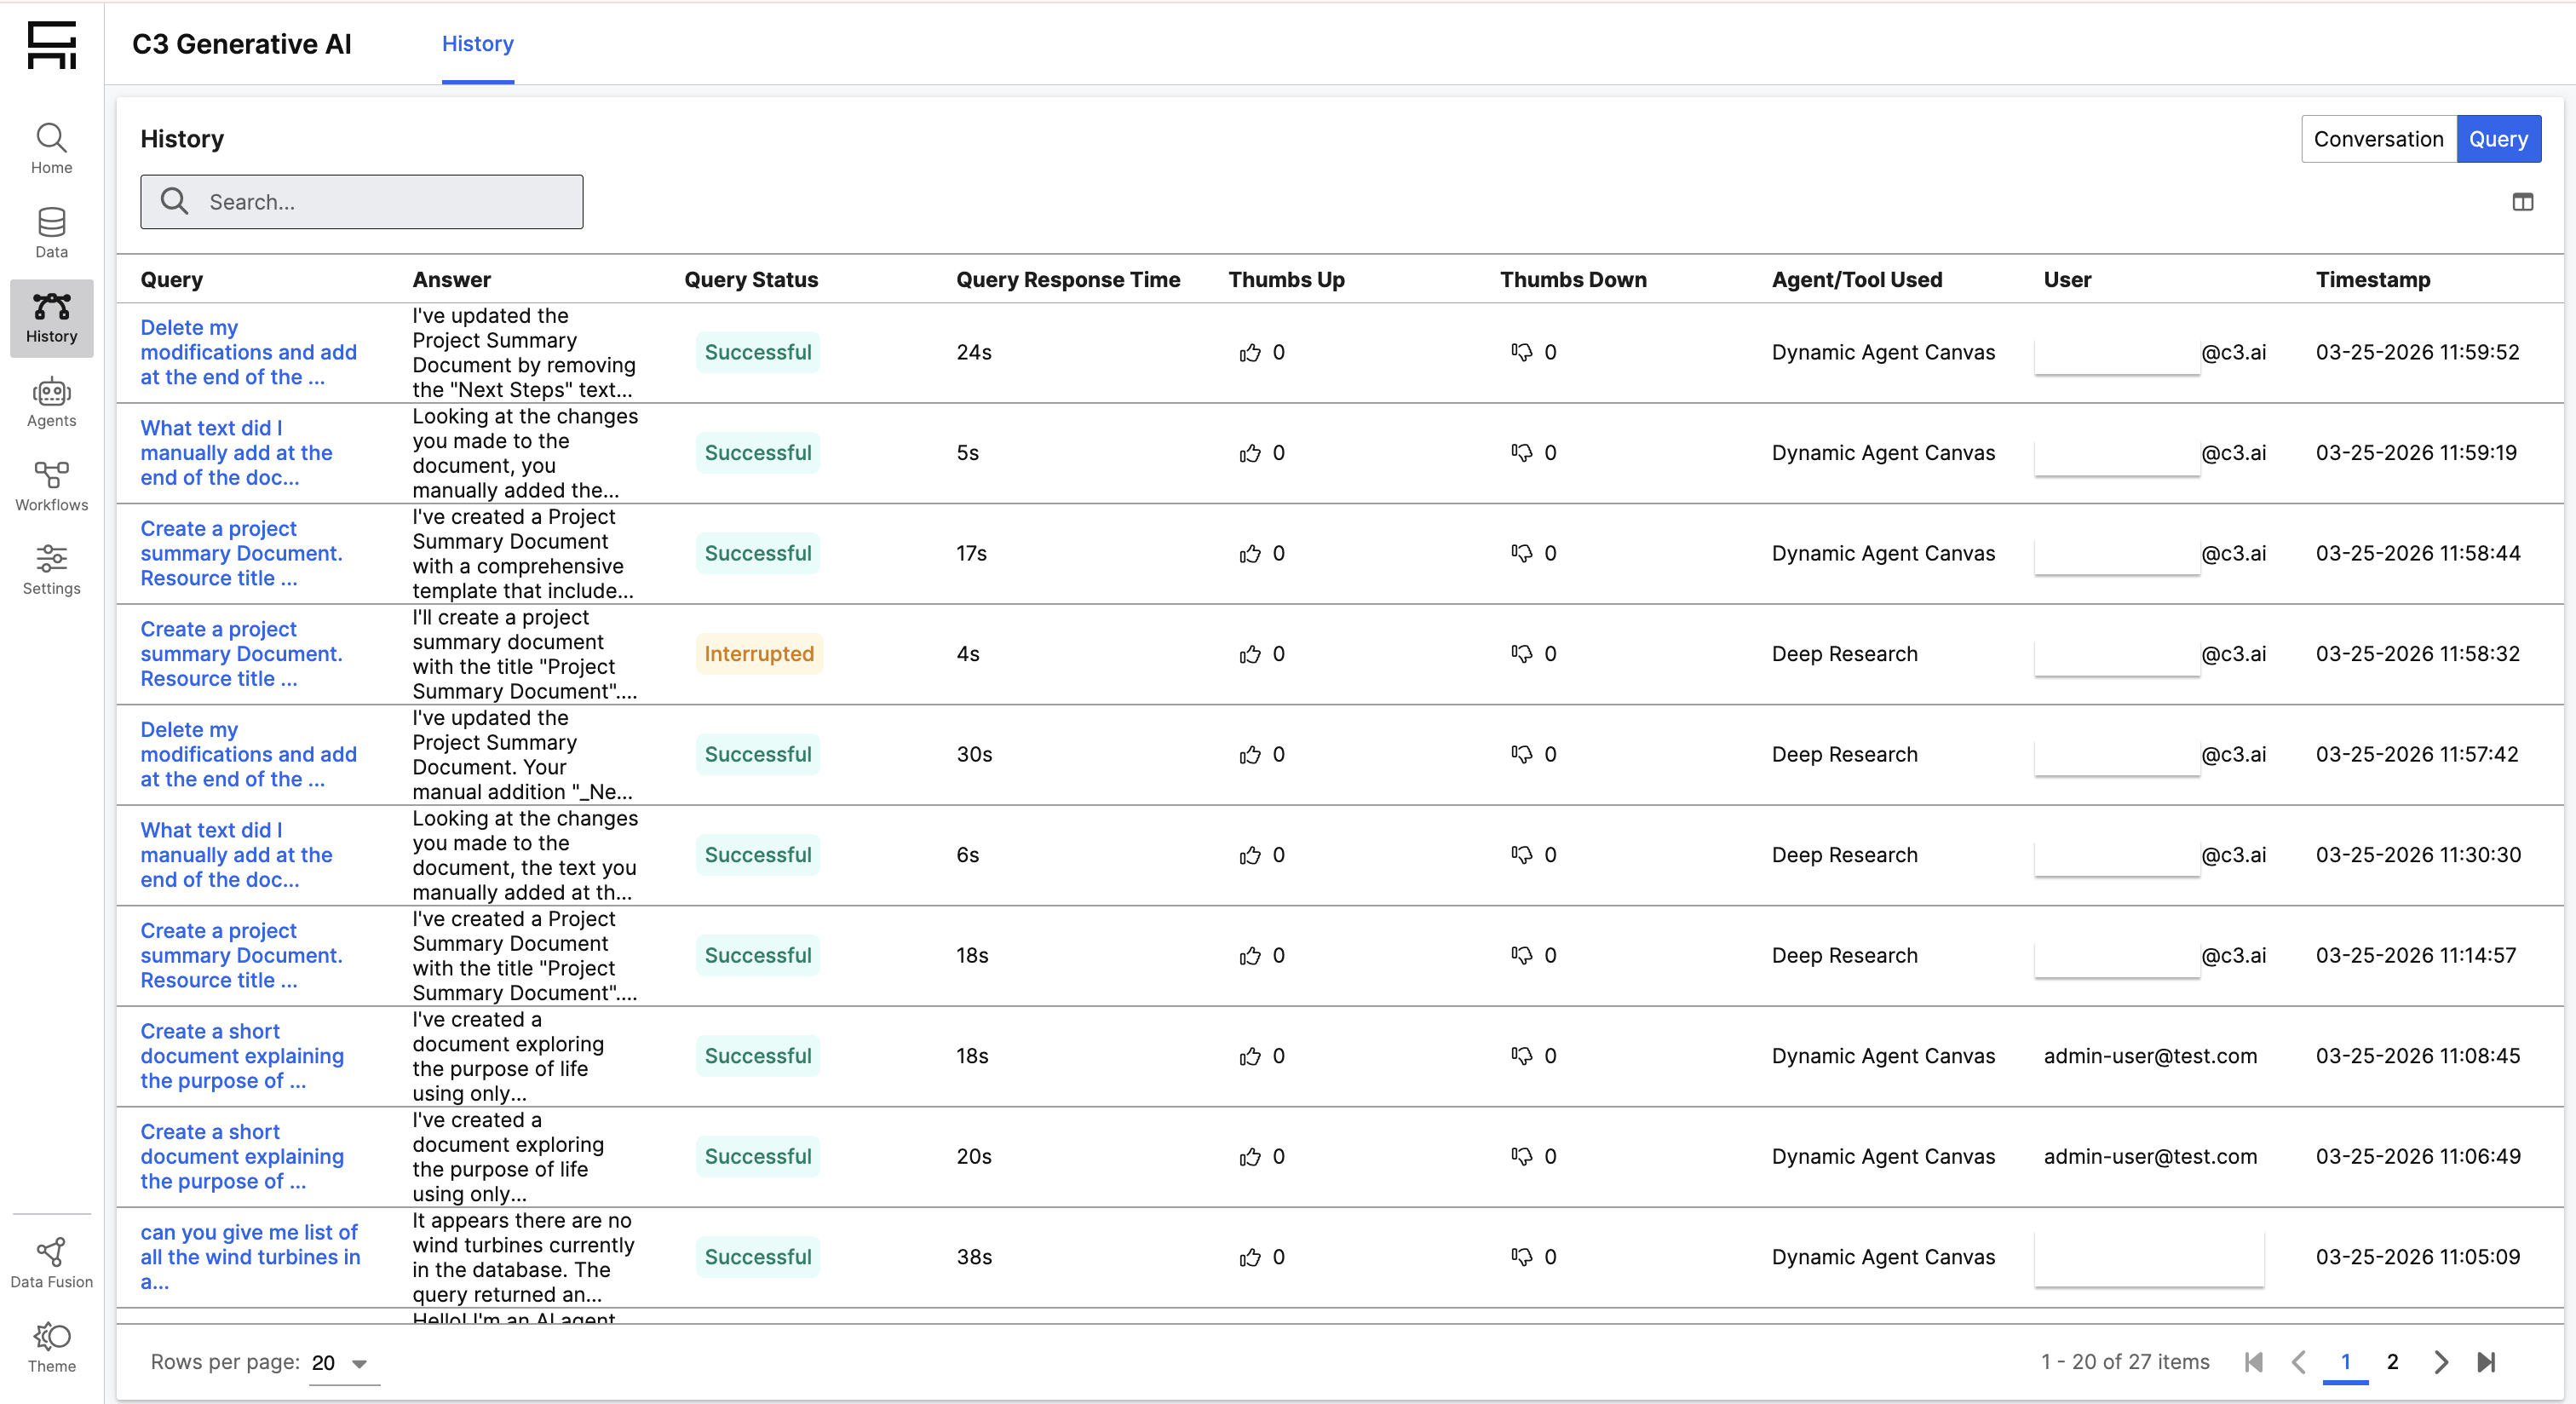
View a conversation
This feature is enabled by default. To view a conversation, navigate to the History page from the navigation menu. The History page displays a paginated grid of all queries with the following columns:
- Query: the raw query text; select to open the Conversation Detail page
- Answer: the model's response
- Query Status: the current status of the query
- Query Response Time: query latency
- Thumbs up / Thumbs down: positive and negative feedback counts
- Agent/Tool Used: the agent or tool that generated the response
- User: the user who submitted the query
- Timestamp: when the query was submitted
Select a query to open the Conversation Detail page for that conversation thread.
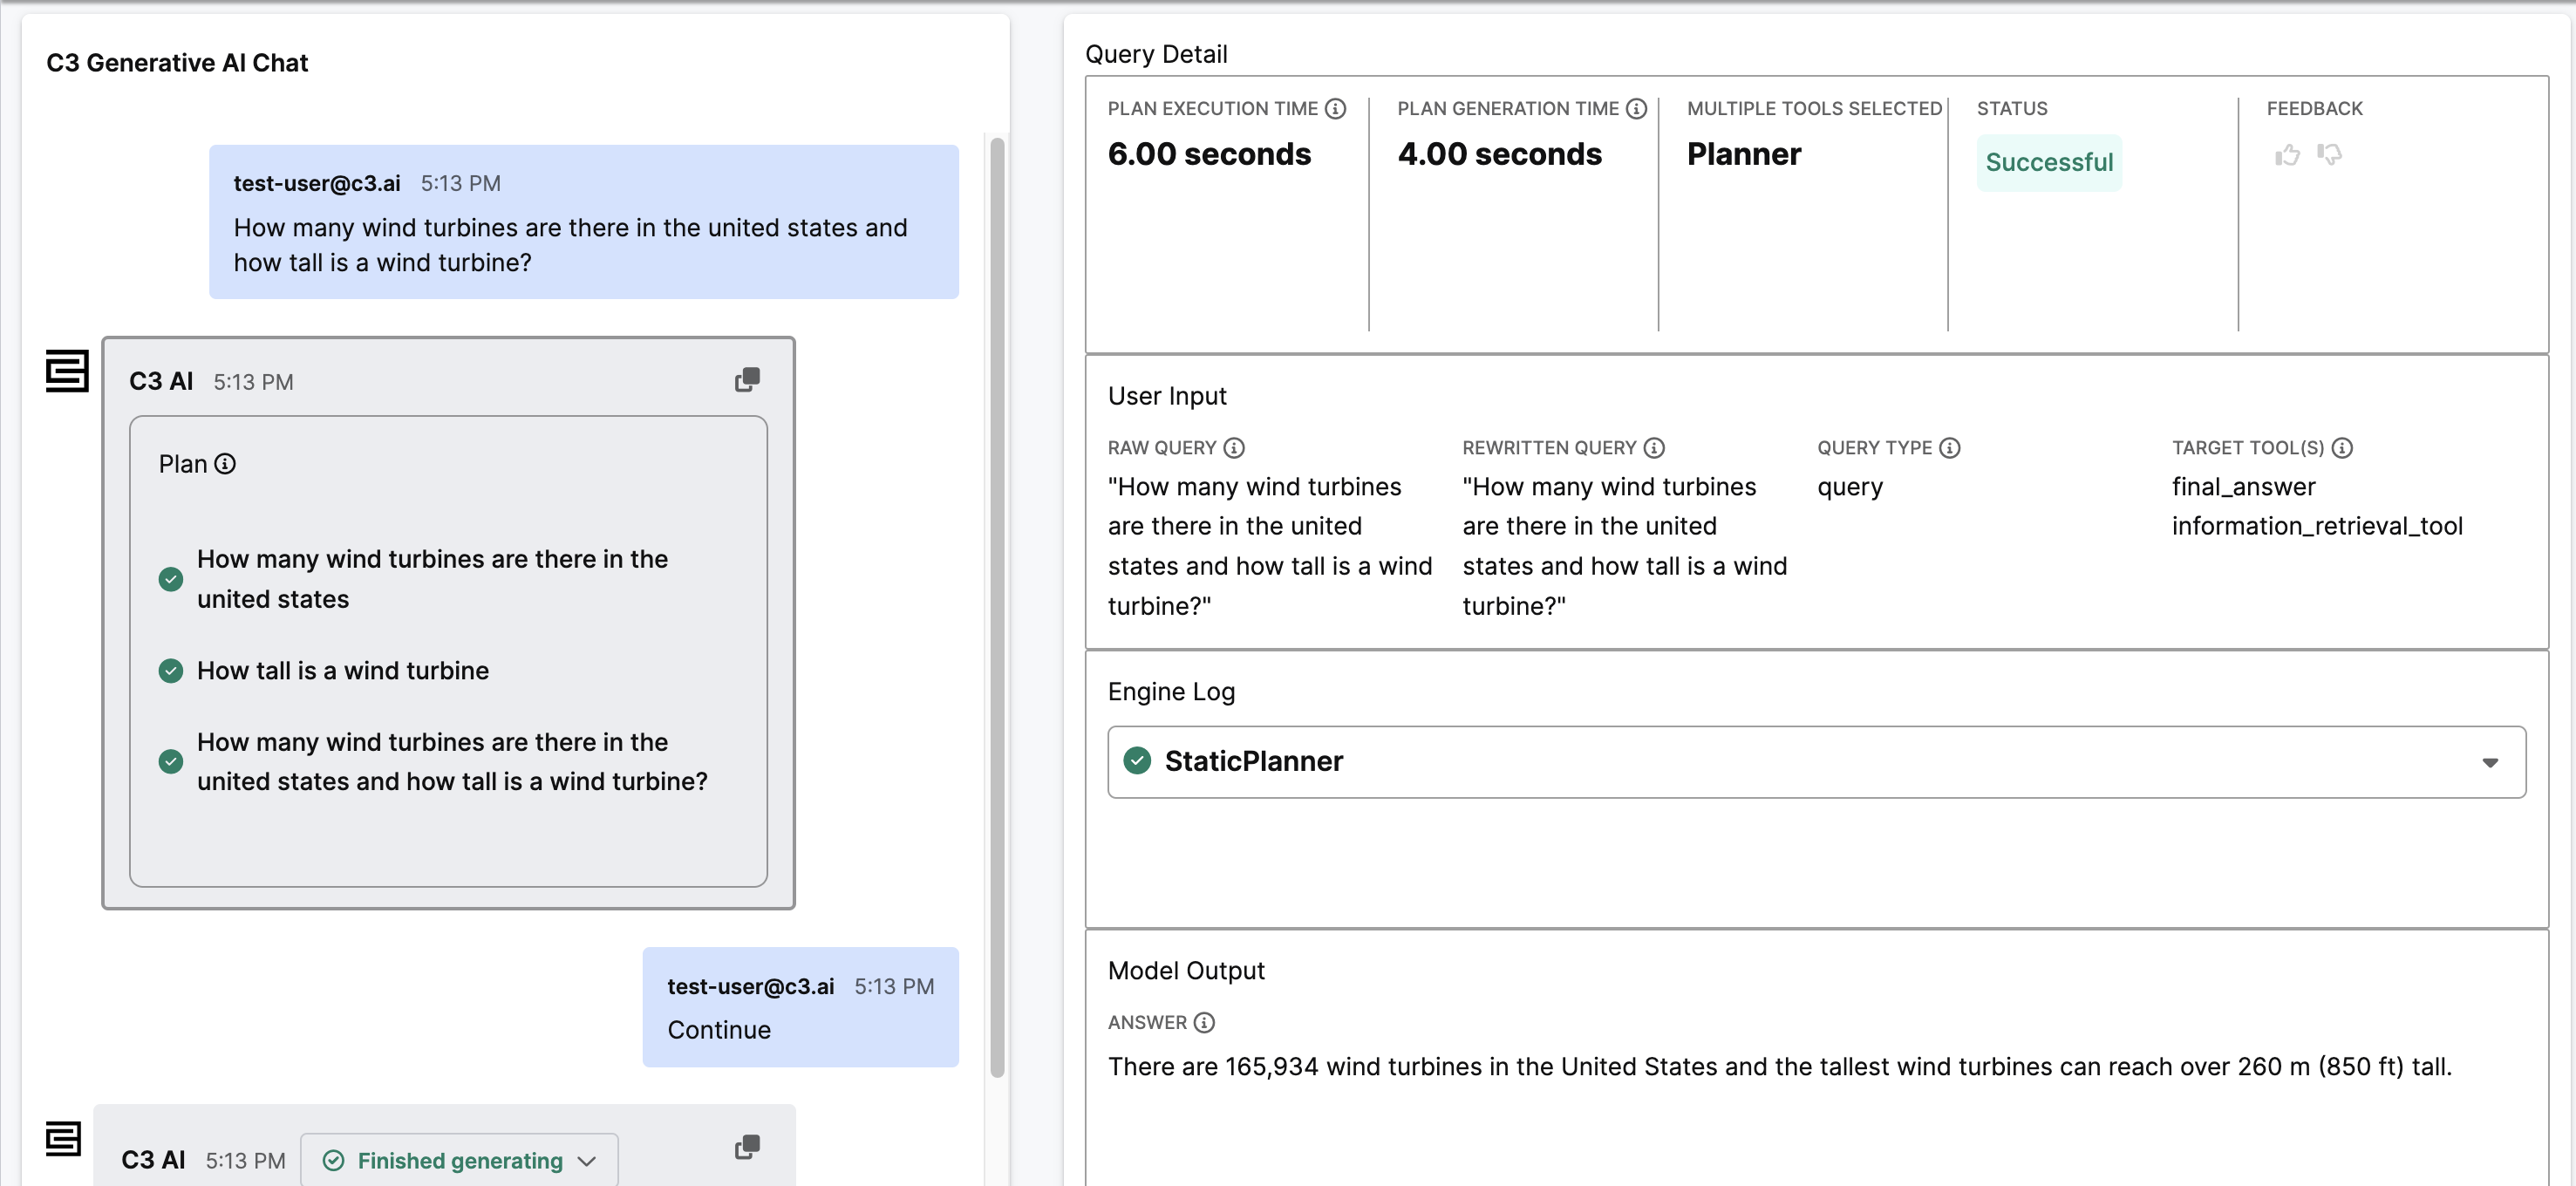
Conversation Detail page
The Conversation Detail page is split into two panels:
- Left panel: a read-only conversation feed showing the full thread of user messages and AI responses in chronological order.
- Right panel: the Query Detail view for the selected query, with the following sections:
- Overall Metrics: agent execution time, query status, and feedback counts
- User Input: the raw query, rewritten (standalone) query, and query type
- Engine Log: collapsible sections for each key in the engine log, with a JSON viewer and error/success status indicators. A download button lets you export the full engine log as a JSON file.
- Model Output: the final answer returned by the model
Plan and Execute
Queries run by the Dynamic Agent include additional rendering details. When you view details for a Plan and Execute query, the plan appears as a list of steps in the conversation feed. If the plan was continued, an additional "Continue" message precedes a response message for each step. The details panel also shows the plan generation time and plan execution time.