Engine Health Metrics UI for Agents
An Agent Deployment is a stable, persisted, instance of an Agent that can be used in production Applications. To persist the Agent, Agents are managed with Engine. In the Deployment Page for an Agent, the Engine Health tab provides time-series metrics and engine events for a single deployment. Use it to monitor node status, thread utilization, queue pressure, and action execution time, then drill into event details for troubleshooting.
For more information about Agent Deployments please see Agent Deployments UI
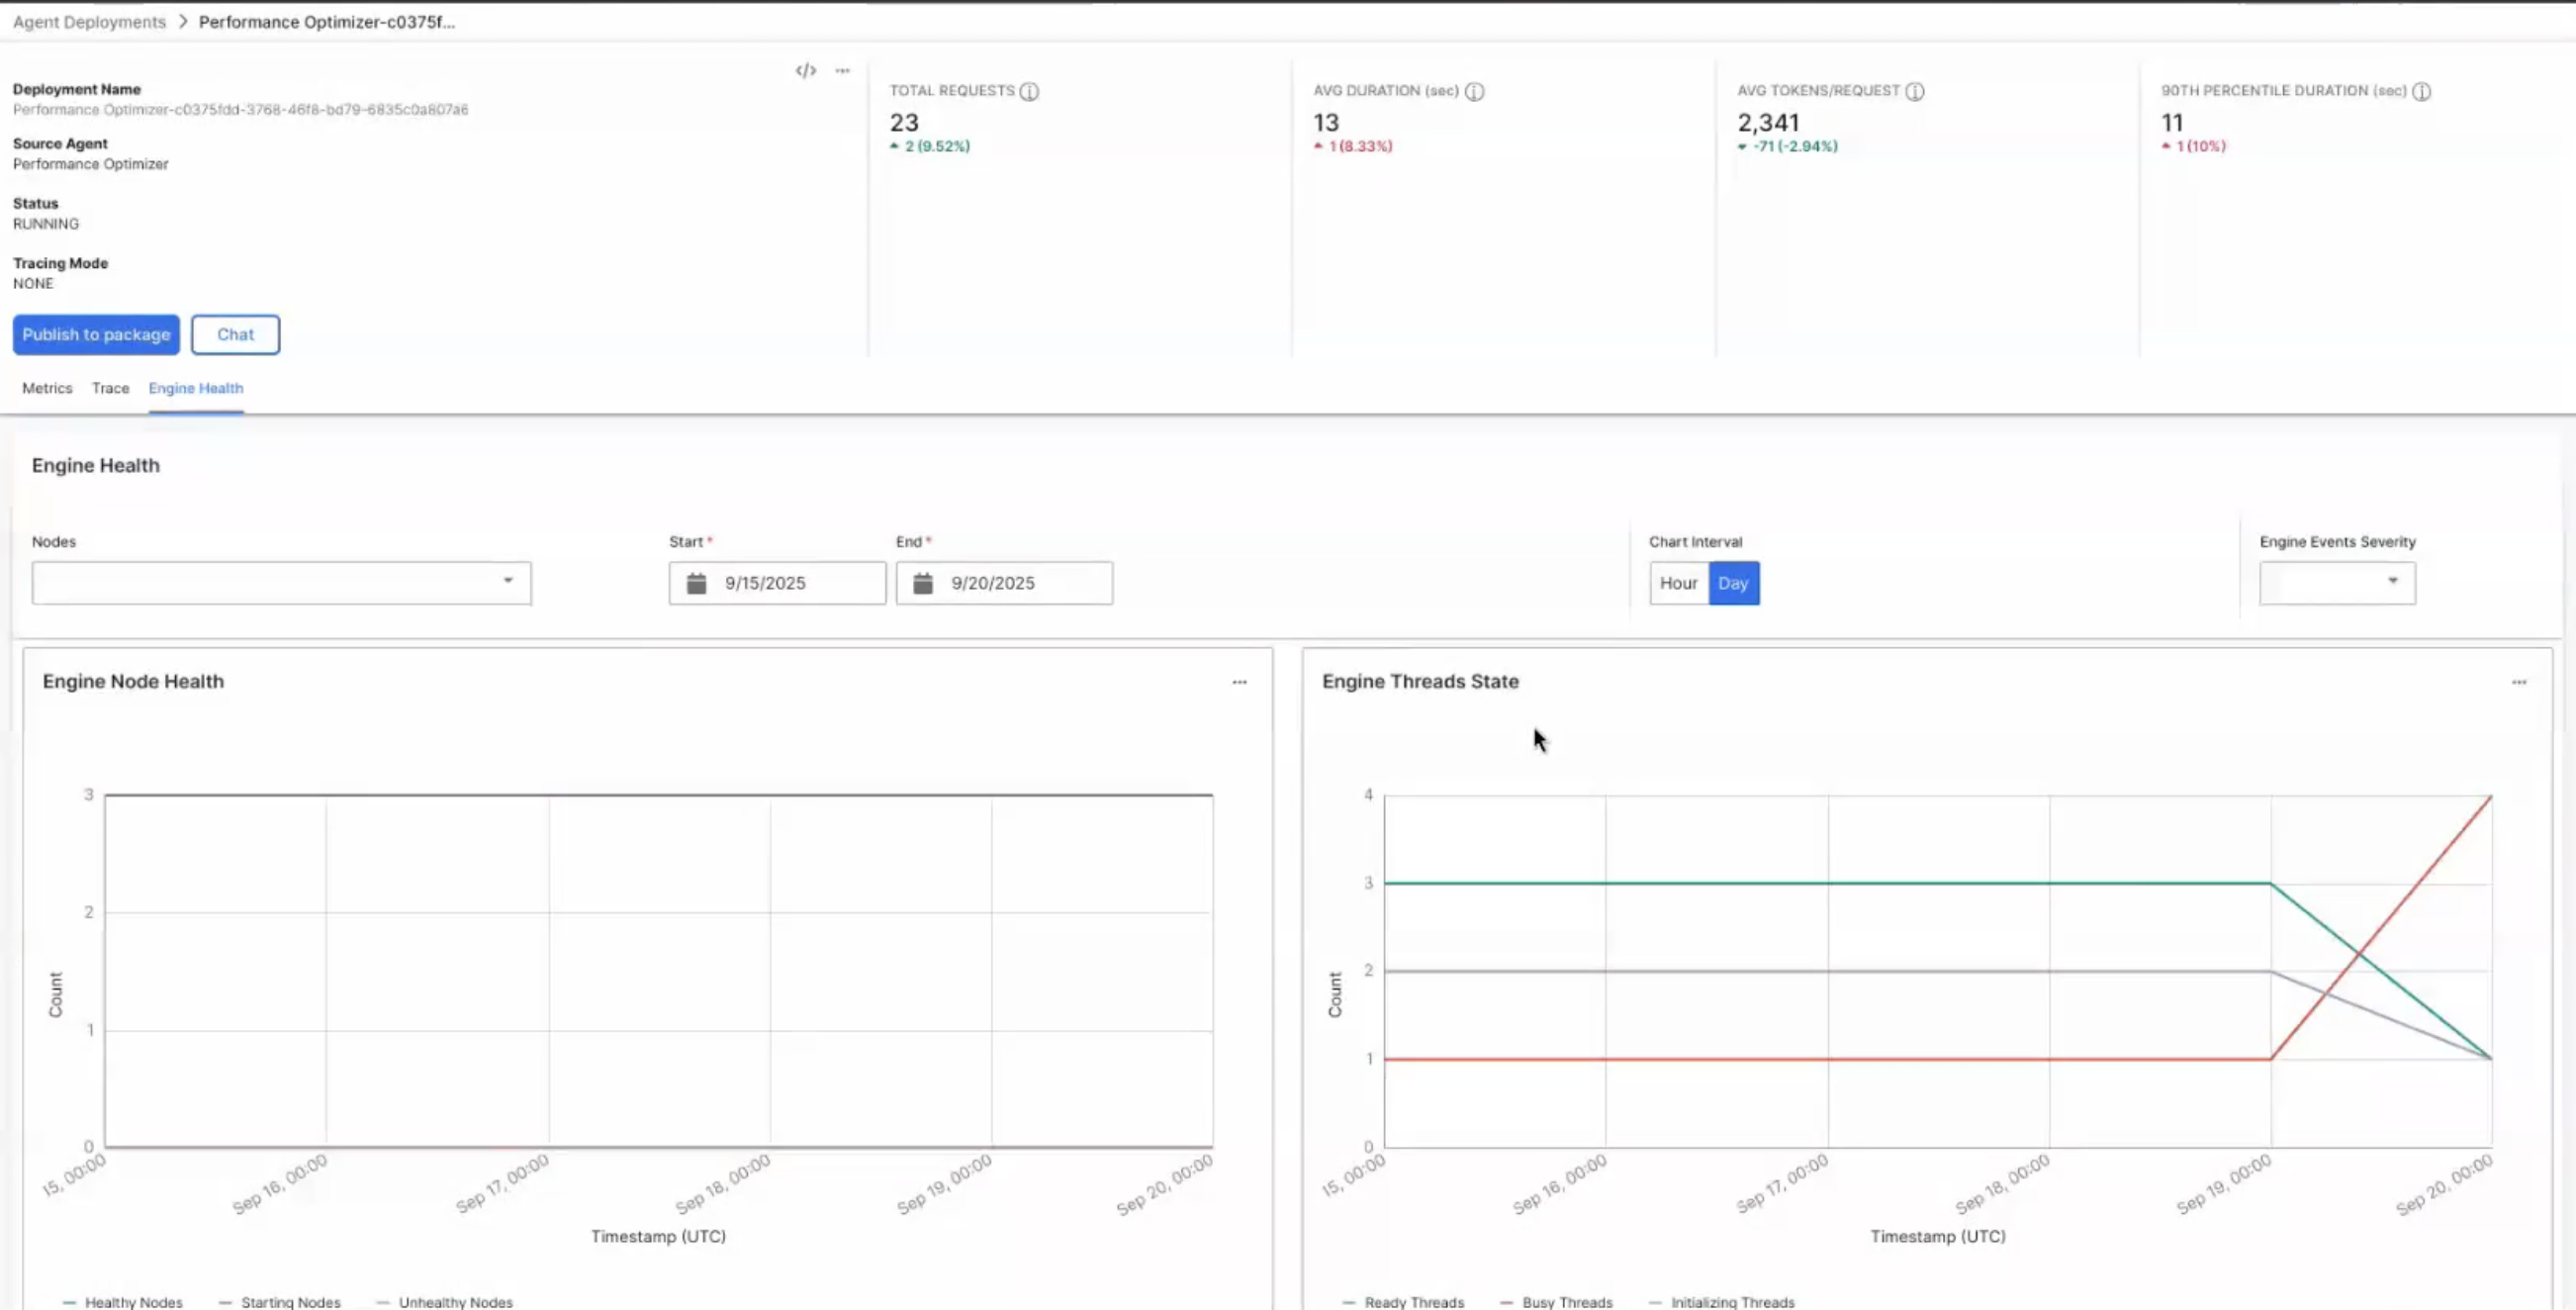
Open Engine Health Metrics
From a deployment detail page, select the Engine Health Metrics tab to view engine-level metrics and events for that Agent Deployment.
Filter Scope and Time Range
Use the following filters to control the time window and selection of data shown on the page:
- Nodes: Multi-select search field for Engine nodes. Leave this empty to view all nodes.
- Start and End: Set the time window for charts and events.
- Chart Interval: Choose the aggregation interval (Hour or Day) for the charts.
- Engine Events Severity: Filter the events grid by log level (Info, Warning, Error).
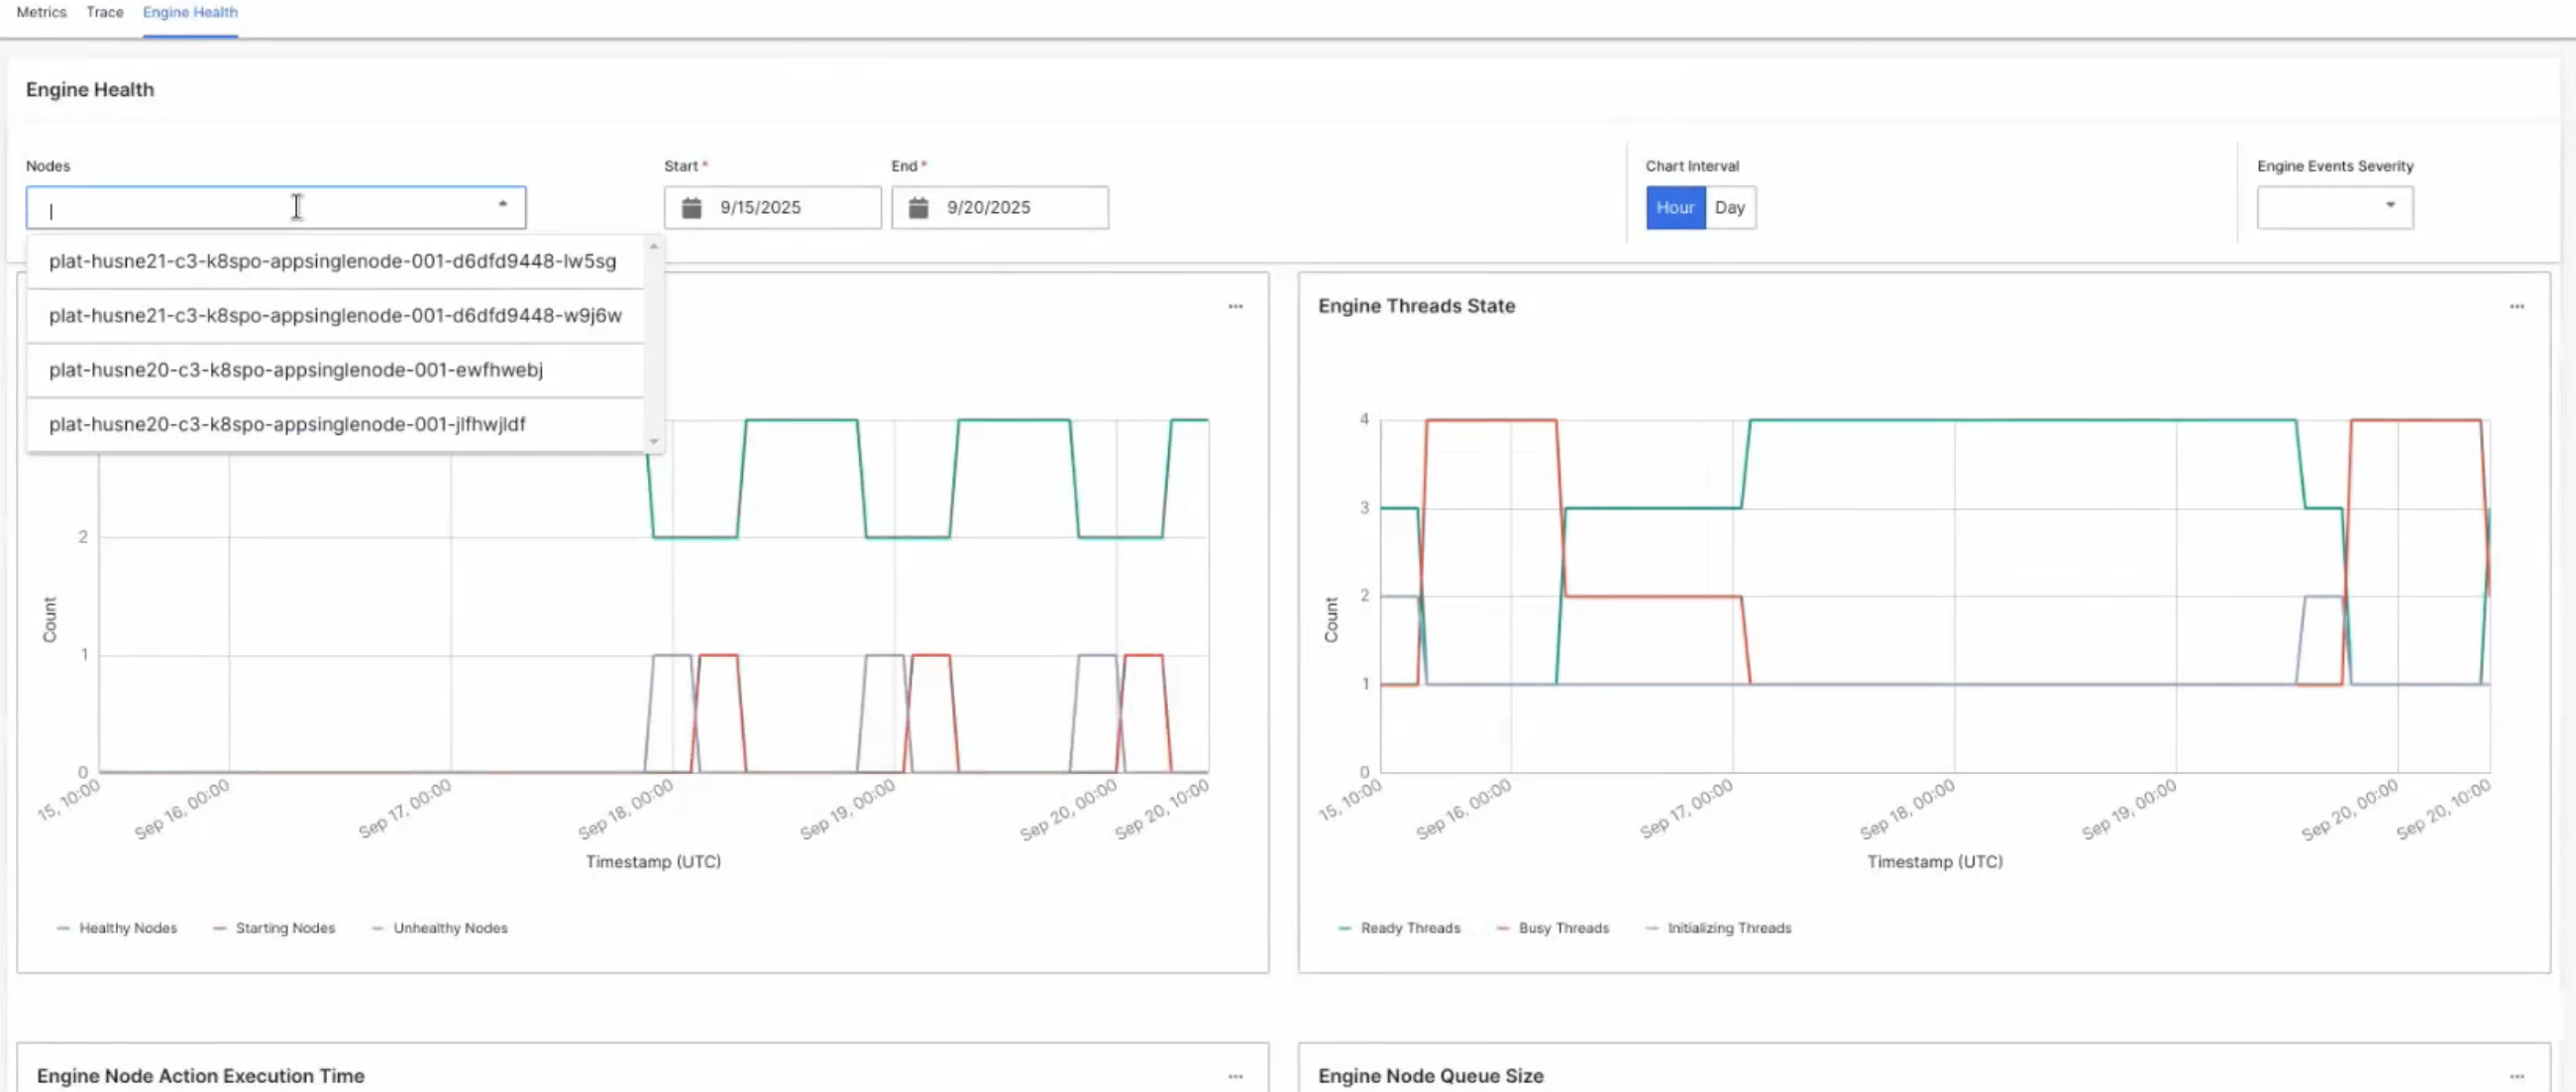
All timestamps are shown in UTC.
Engine Health Charts
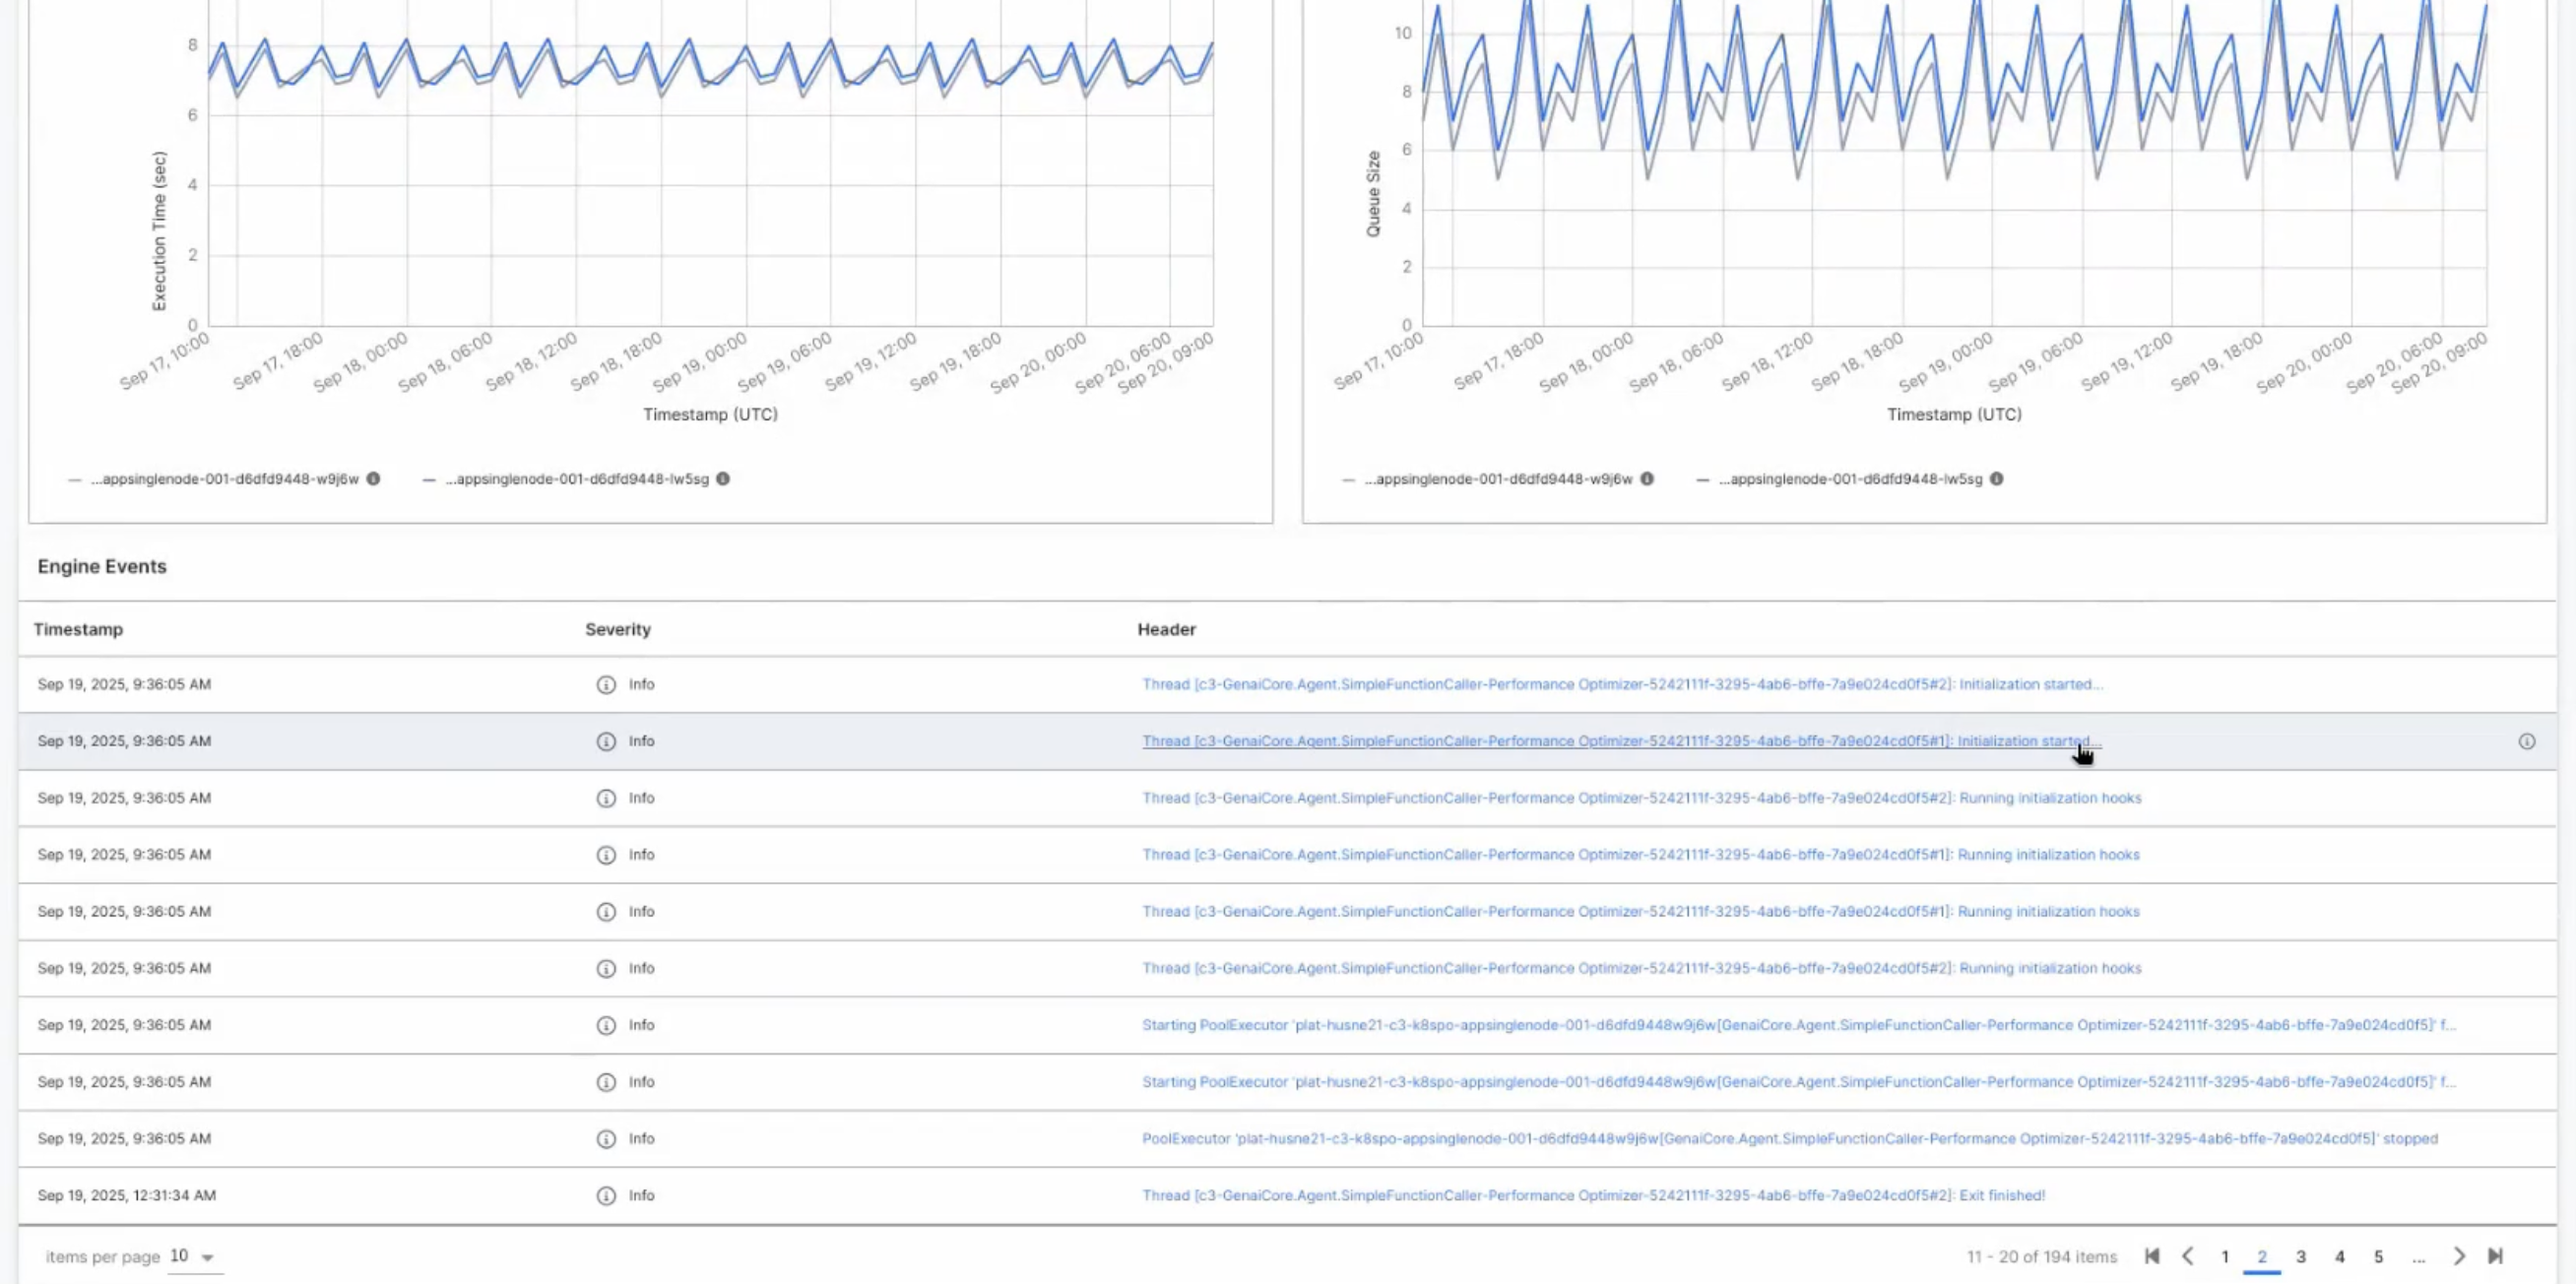
The charts are split into two rows. The top row shows overall node health and thread utilization. The bottom row shows per-node execution time and queue depth.
Engine Node Health
Tracks counts of healthy, starting, and unhealthy nodes over time. Use this chart to confirm overall node availability and identify instability windows.
Engine Threads State
Shows counts of ready, busy, and initializing threads over time. Use this chart to understand thread pool pressure and whether threads are keeping up with demand.
Engine Node Action Execution Time
Displays action execution time (seconds) by node. Use the Nodes selector to focus on specific nodes and compare their execution behavior.
Engine Node Queue Size
Displays queue size by node. Spikes here can indicate backpressure or slow processing on specific nodes.
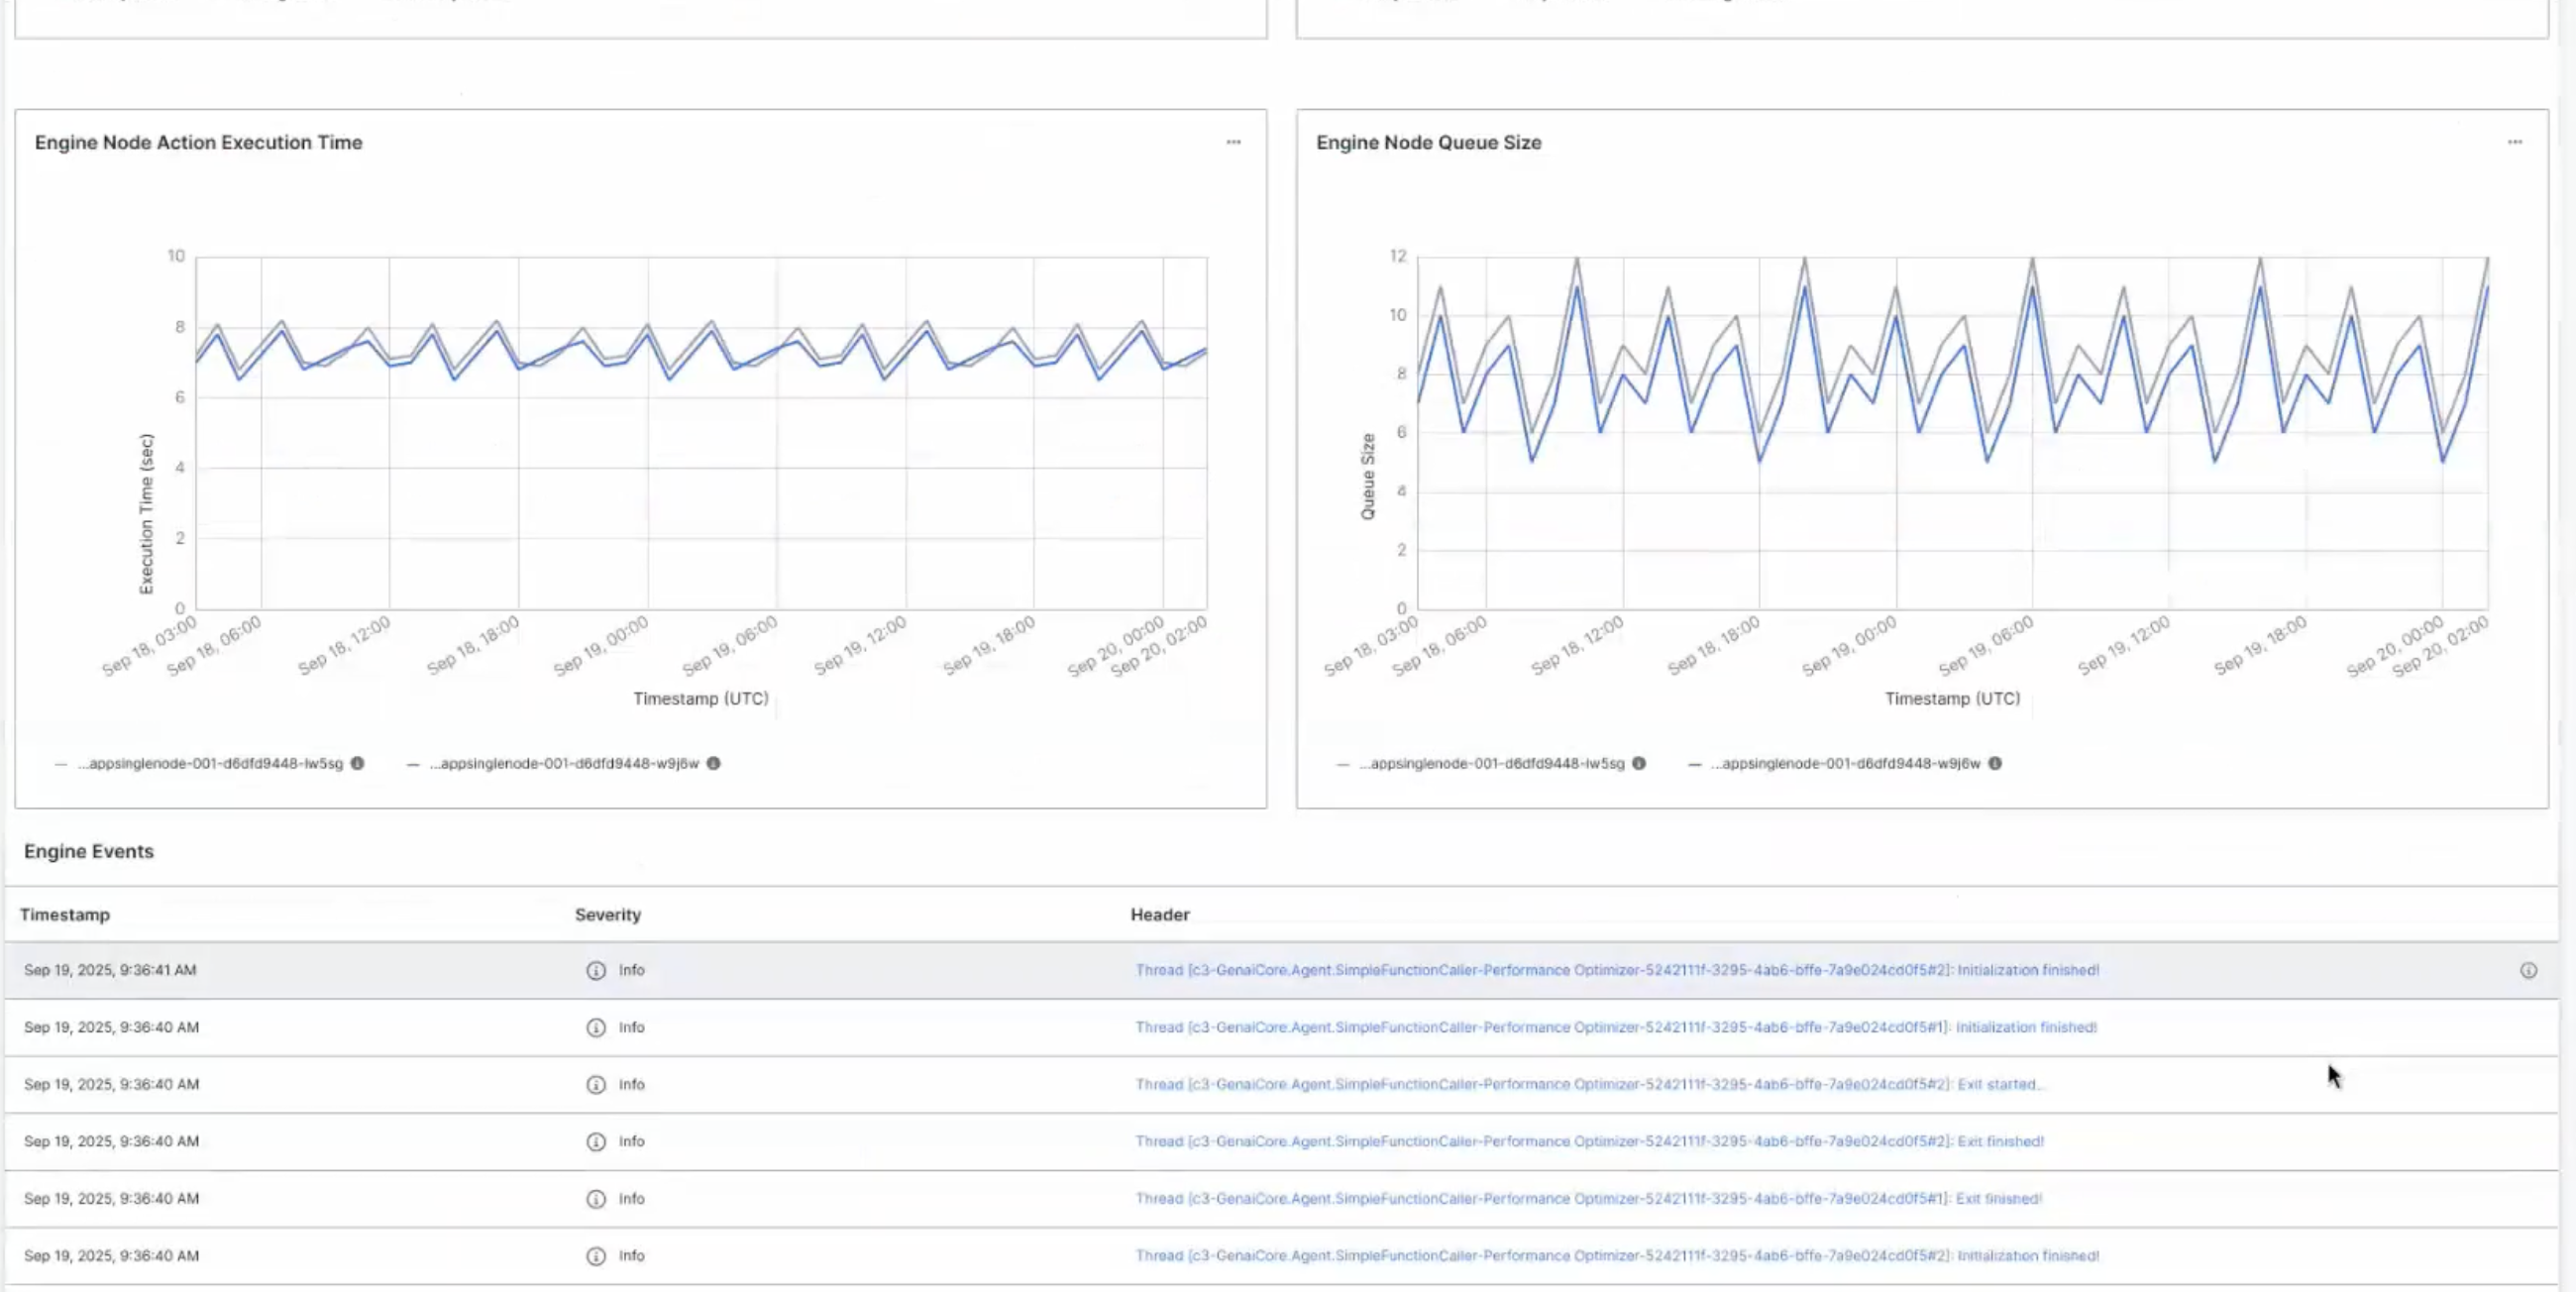
Engine Events
The Engine Events grid lists engine log entries for the selected deployment and time window. Columns include:
- Timestamp (UTC)
- Severity
- Node
- Message
Use the severity filter to narrow the log levels. Use the message column search to find specific keywords. Select the Info action to open event details.
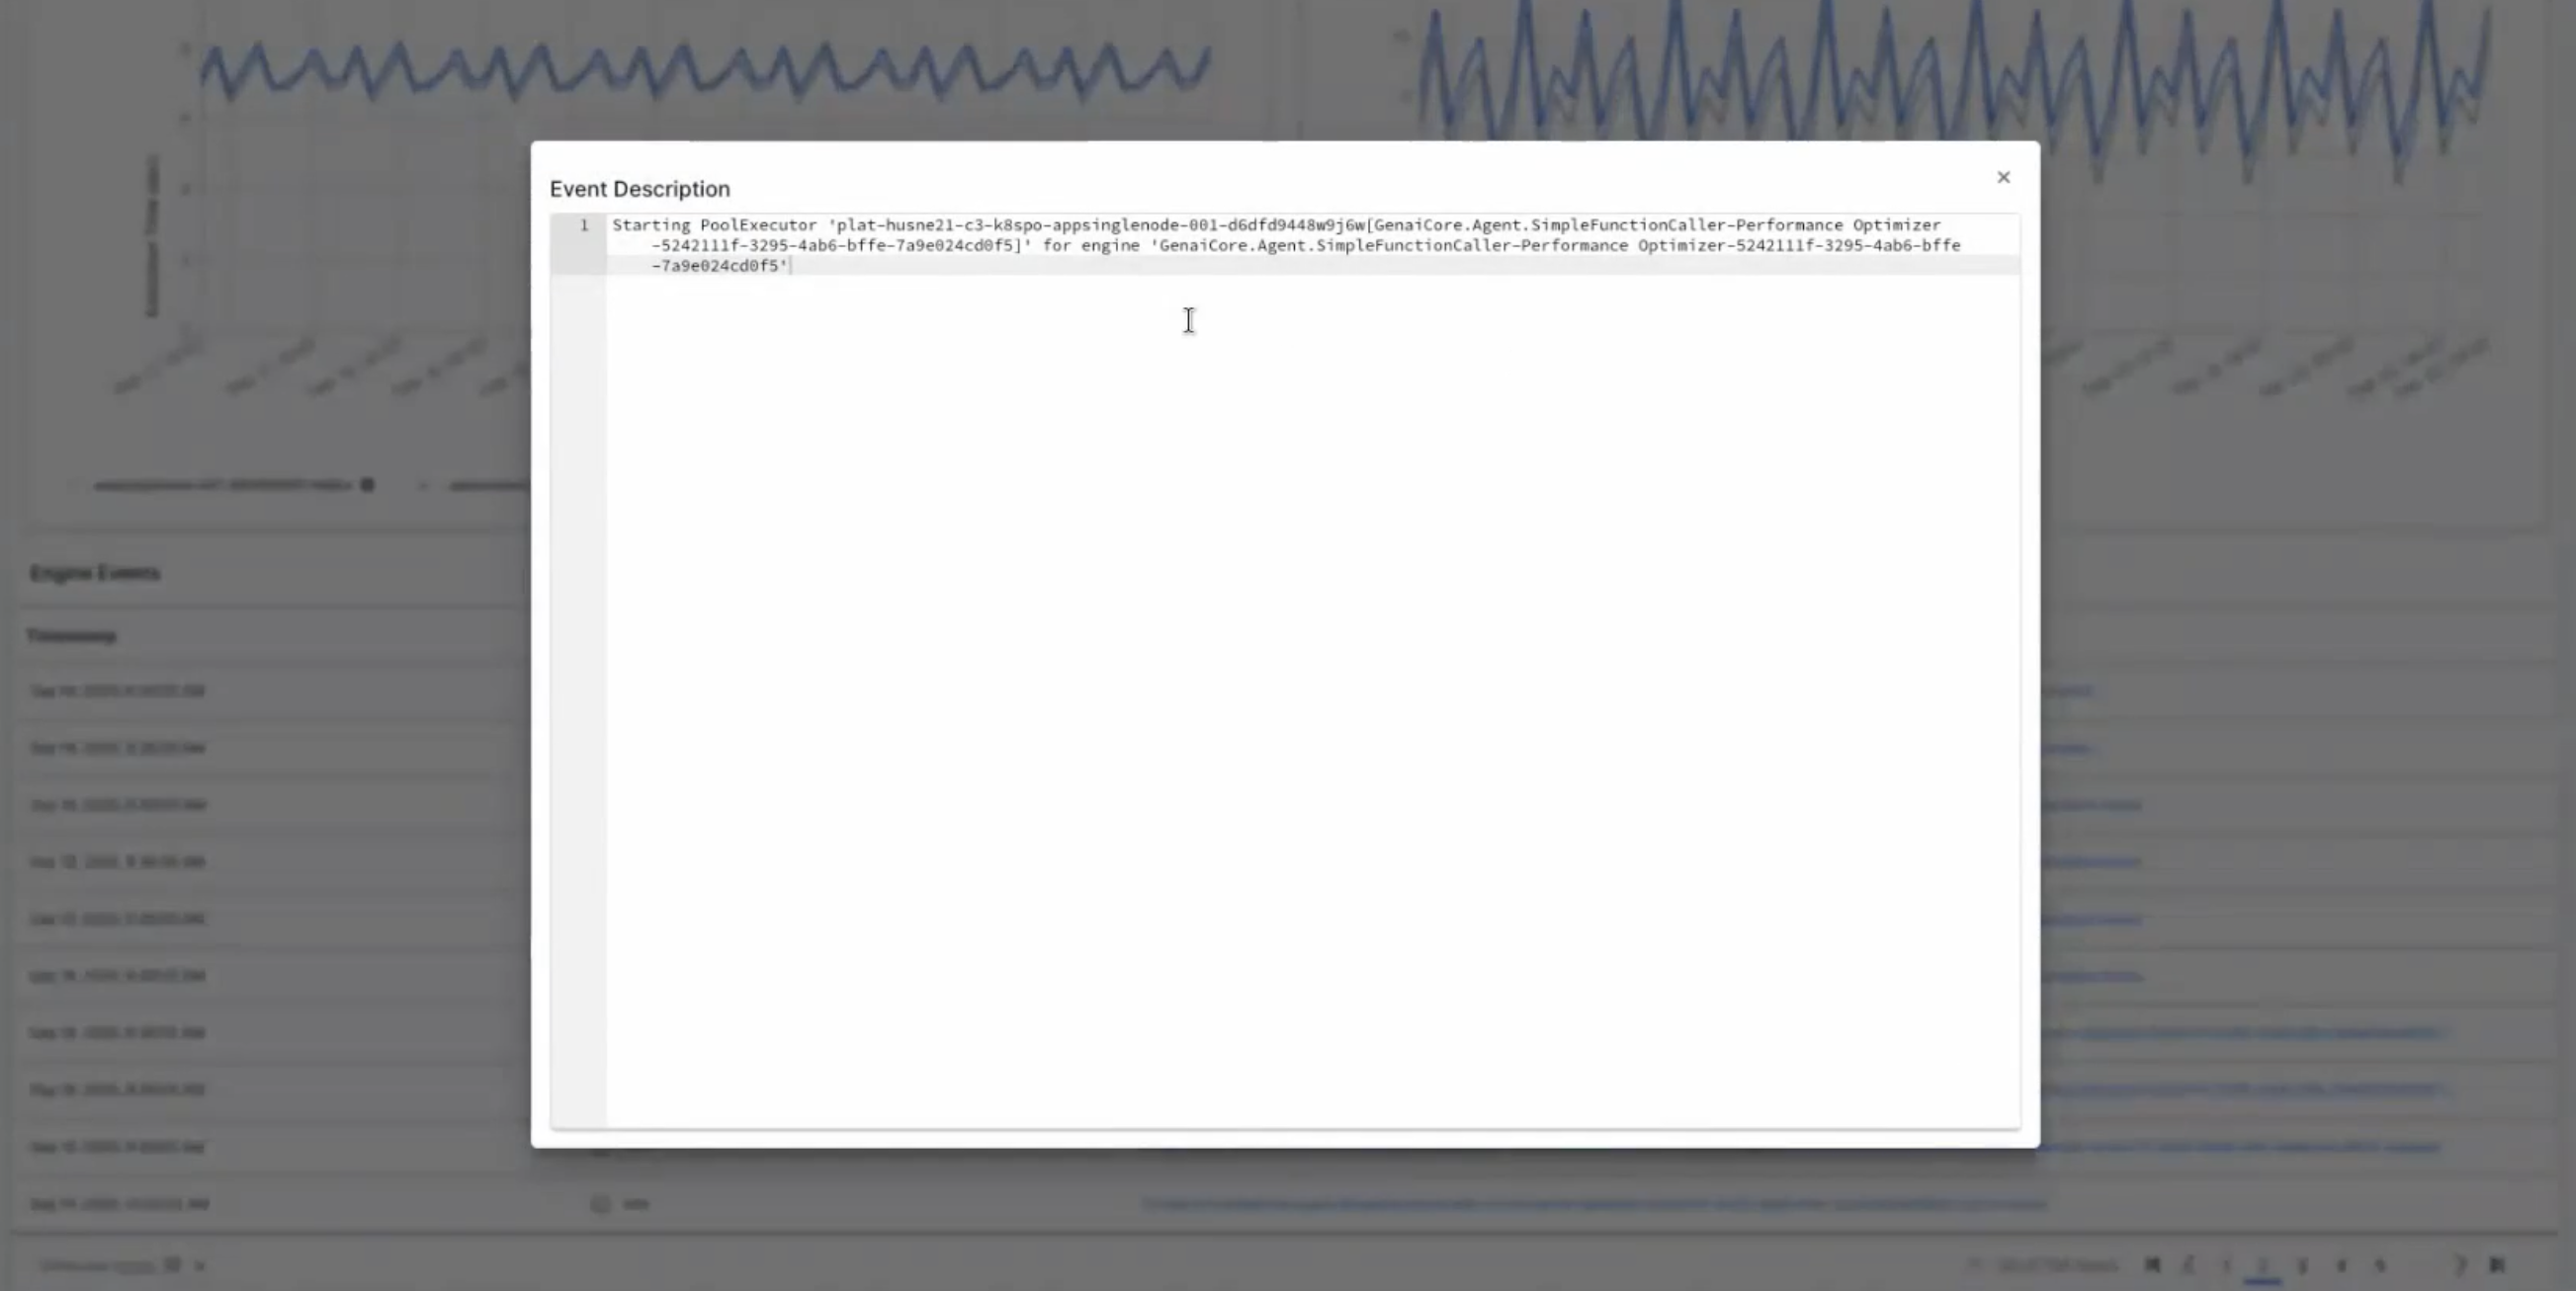
Event Details
Selecting Info opens a modal with the full event description for the chosen log entry.