C3 Spark Monitoring
C3 Spark monitoring in C3 AI Studio provides visibility into Spark workloads by capturing detailed execution logs. This allows you to easily track query progress, review execution details, and troubleshoot performance issues directly within the platform.
Prerequisites
- Access to a C3 SparkCluster and C3 DataLake-enabled application.
- Familiarity with Spark SQL/PySpark and the Apache Iceberg table format.
- For Spark Connect usage, a Spark cluster that supports Spark 3.4+ (Spark Connect GA in 3.4).
Enable Logging on a Data.SparkSession
When initializing a Data.SparkSession, set enableLogging=True to capture execution logs. All operations triggered from that session would be logged into the SparkExecution type. A corresponding GUI is available in C3 AI Studio for monitoring and analysis. See the Spark Log UI image.
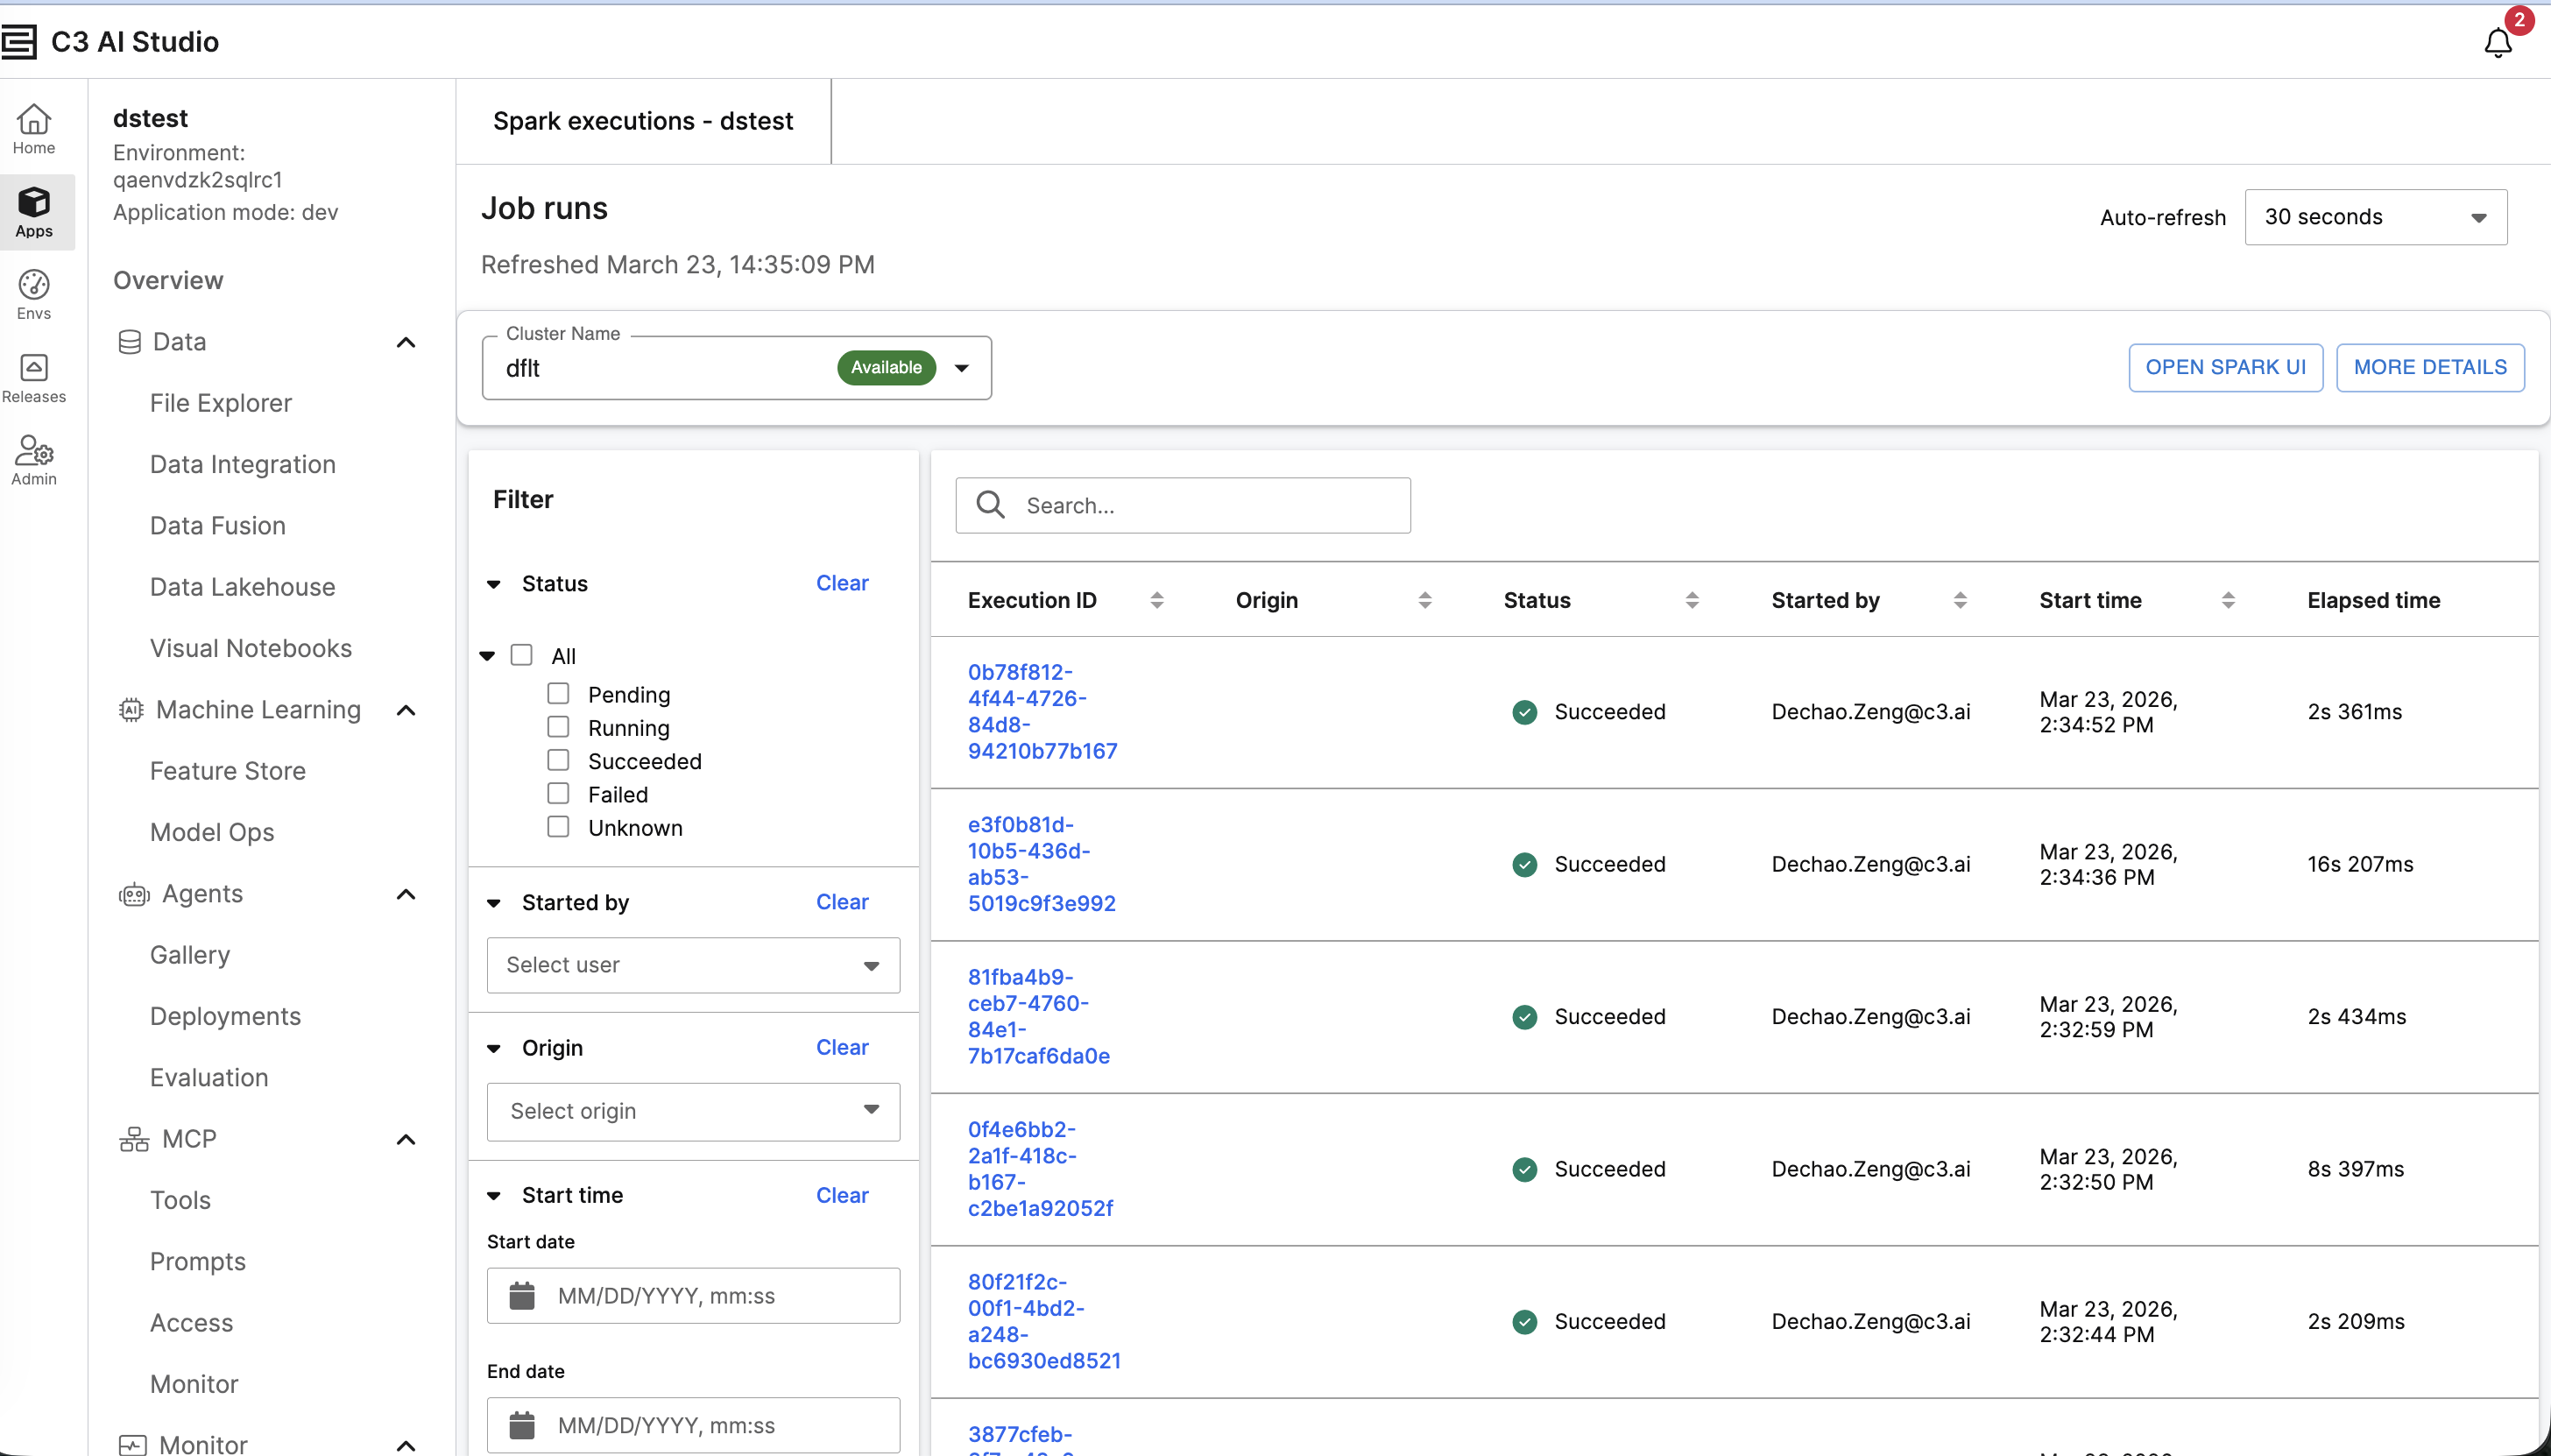 |
| Spark Log UI |
Queries executed directly from the SQL Editor are also fully logged. For example, when you run an SQL query instead of using Jupyter or the Console, these actions will also be logged. This ensures consistent traceability across all query execution paths.
Example: Capture Execution Logs
Input:
cluster = c3.SparkCluster.inst()

ss = cluster.dataSparkSession(enableLogging=True)

spark = cluster.sparkConnectSession() ss.read_csv("gcs://c3--datasets/iris.csv").shape Output: (150, 5)
Input:
c3.SparkExecution.fetch() Output:
 |
| Output for Spark Execution |