Monitor Environment and Application Storage Utilization
Monitor environment and application storage utilization using the C3 AI Studio environment and application monitoring dashboards. Analyze these dashboards to gain insight on the performance and efficiency of your environment or application.
With the C3 Agentic AI Platform, you can monitor storage utilization in C3 AI Studio for the following:
- A single node environment (SNE)
- A shared environment
- An application in a shared environment
About ephemeral and persistent data
Environments and applications can have both ephemeral and persistent data:
- Ephemeral data — The platform stores ephemeral data temporarily and automatically deletes it after a certain amount of time. The platform uses ephemeral data for caching, buffering, or optimizing performance by reducing the load on databases and improving response times. Restart and termination might cause ephemeral data loss.
- Persistent data — Persistent data remains available after restart. The platform uses persistent data for long-term storage.
The C3 AI Studio storage utilization dashboards display panels for both ephemeral and persistent data:
- Overall usage and limit panels: Show the overall storage usage and limits for as node.
- Per-directory storage panels: Shows the per-directory storage usage on a per-node basis.
Requirements
Complete the following requirements to view storage utilization dashboards in C3 AI Studio:
- At minimum, have the
AppAdminrole to monitor your own applications and environments. - A user with the
StudioAdminrole must enable monitoring for the application.
Monitor a single node environment or shared environment
SNEs always have ephemeral storage. SNEs configured with sharedStorage=true also have PVC-backed persistent storage. Shared environments typically use ephemeral local storage while persisting application data through shared platform services.
- In C3 AI Studio, navigate to the Envs page.
- Select the environment you want to monitor.
- Select Monitoring.
- Select Dashboards.
- From the Selected Dashboard dropdown, select Storage Utilization.
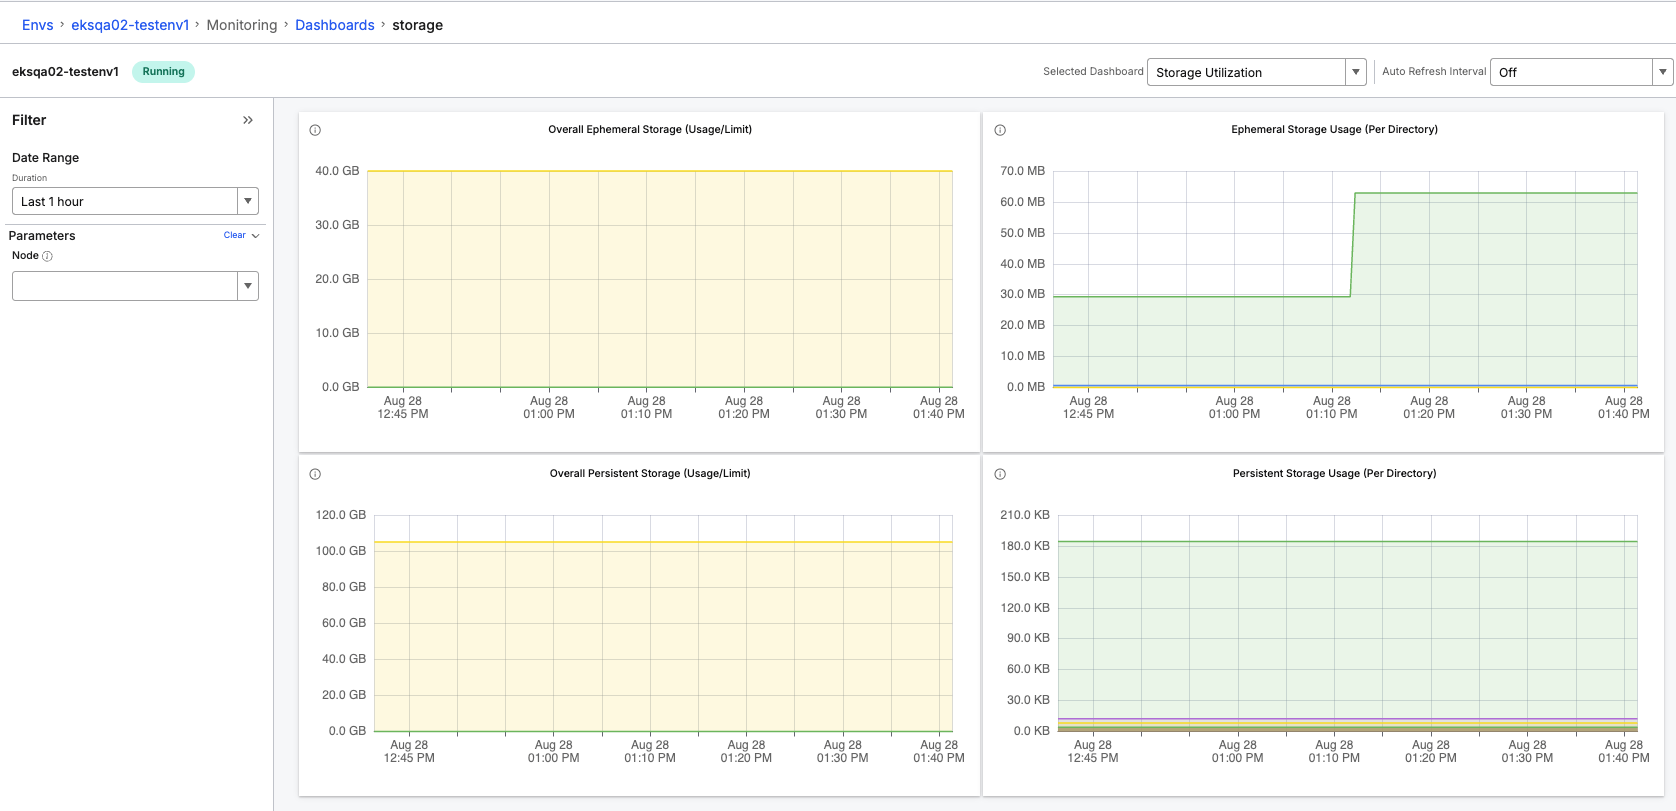 |
| Single Node Environment Dashboard - Storage Utilization |
If you select a single node environment configured with sharedStorage=true, the following data displays for both persistent and ephemeral storage:
| Panel | Information |
|---|---|
| Overall Ephemeral Storage | Ephemeral storage utilization against the total limit on your environment nodes. |
| Ephemeral Storage Usage | Directory level Ephemeral storage utilization per node. |
| Overall Persistent Storage | Persistent storage utilization against the total limit on your environment nodes. |
| Persistent Storage Usage | Directory level Persistent storage utilization per node. |
For SNEs configured with sharedStorage=false, the persistent storage panels still render, but Overall Persistent Storage reports -1B and Persistent Storage Usage shows no PVC directory data, since no PVC is attached. Setting sharedDb=true preserves database data in PostgreSQL, but it does not provide the PVC-backed storage measured by this dashboard.
For a shared environment, all four panels render. Because shared environments do not have an application PVC by default, the ephemeral panels contain valid data, while Overall Persistent Storage reports -1B and Persistent Storage Usage contains no PVC directory data.
| Panel | Information |
|---|---|
| Overall Ephemeral Storage | Ephemeral storage utilization against the total limit on your environment nodes. |
| Ephemeral Storage Usage | Ephemeral storage usage per node. |
| Overall Persistent Storage | Persistent storage utilization against the total limit on your environment nodes. |
| Persistent Storage Usage | Directory level Persistent storage utilization per node. |
Monitor an application in a shared environment
Applications in shared environments typically persist application data through shared platform services, but they do not have an application PVC by default.
- In C3 AI Studio, navigate to the Apps page.
- Select the application you want to monitor.
- Select Monitoring.
- Select Dashboards.
- From the
Selected Dashboarddropdown, selectStorage Utilization.
The Storage Utilization dashboard renders all four panels. The ephemeral panels contain valid data, while Overall Persistent Storage reports -1B and Persistent Storage Usage contains no PVC directory data:
| Panel | Information |
|---|---|
| Overall Ephemeral Storage | Ephemeral storage utilization against the total limit on your environment nodes. |
| Ephemeral Storage Usage | Ephemeral storage usage per node. |
| Overall Persistent Storage | Persistent storage utilization against the total limit on your environment nodes. |
| Persistent Storage Usage | Directory level Persistent storage utilization per node. |
Interpret environment and application storage utilization
When ephemeral storage usage reaches the limit indicated in the storage utilization dashboard, the environment or application might quit and restart. Use the environment or application Storage Usage (Per Directory) panel to identify directories that consume high amounts of storage.
If an environment or application has multiple nodes, the dashboards show storage utilization for all nodes on separate graph lines. Hover over the lines for a more granular view of storage usage for each directory in each node. You can also use the Filter panel to filter the data by node.