The Data Monitoring Interface in C3 AI Studio
The Data Monitoring page in C3 AI Studio lets you monitor the status, throughput, and health of your data source collections. Use it to track how data is being pulled from external sources (such as files or cloud message brokers) into your application. You can identify processing errors, failures, or rejections as they happen. For more information on integrating data into your application, see Data Integration Overview.
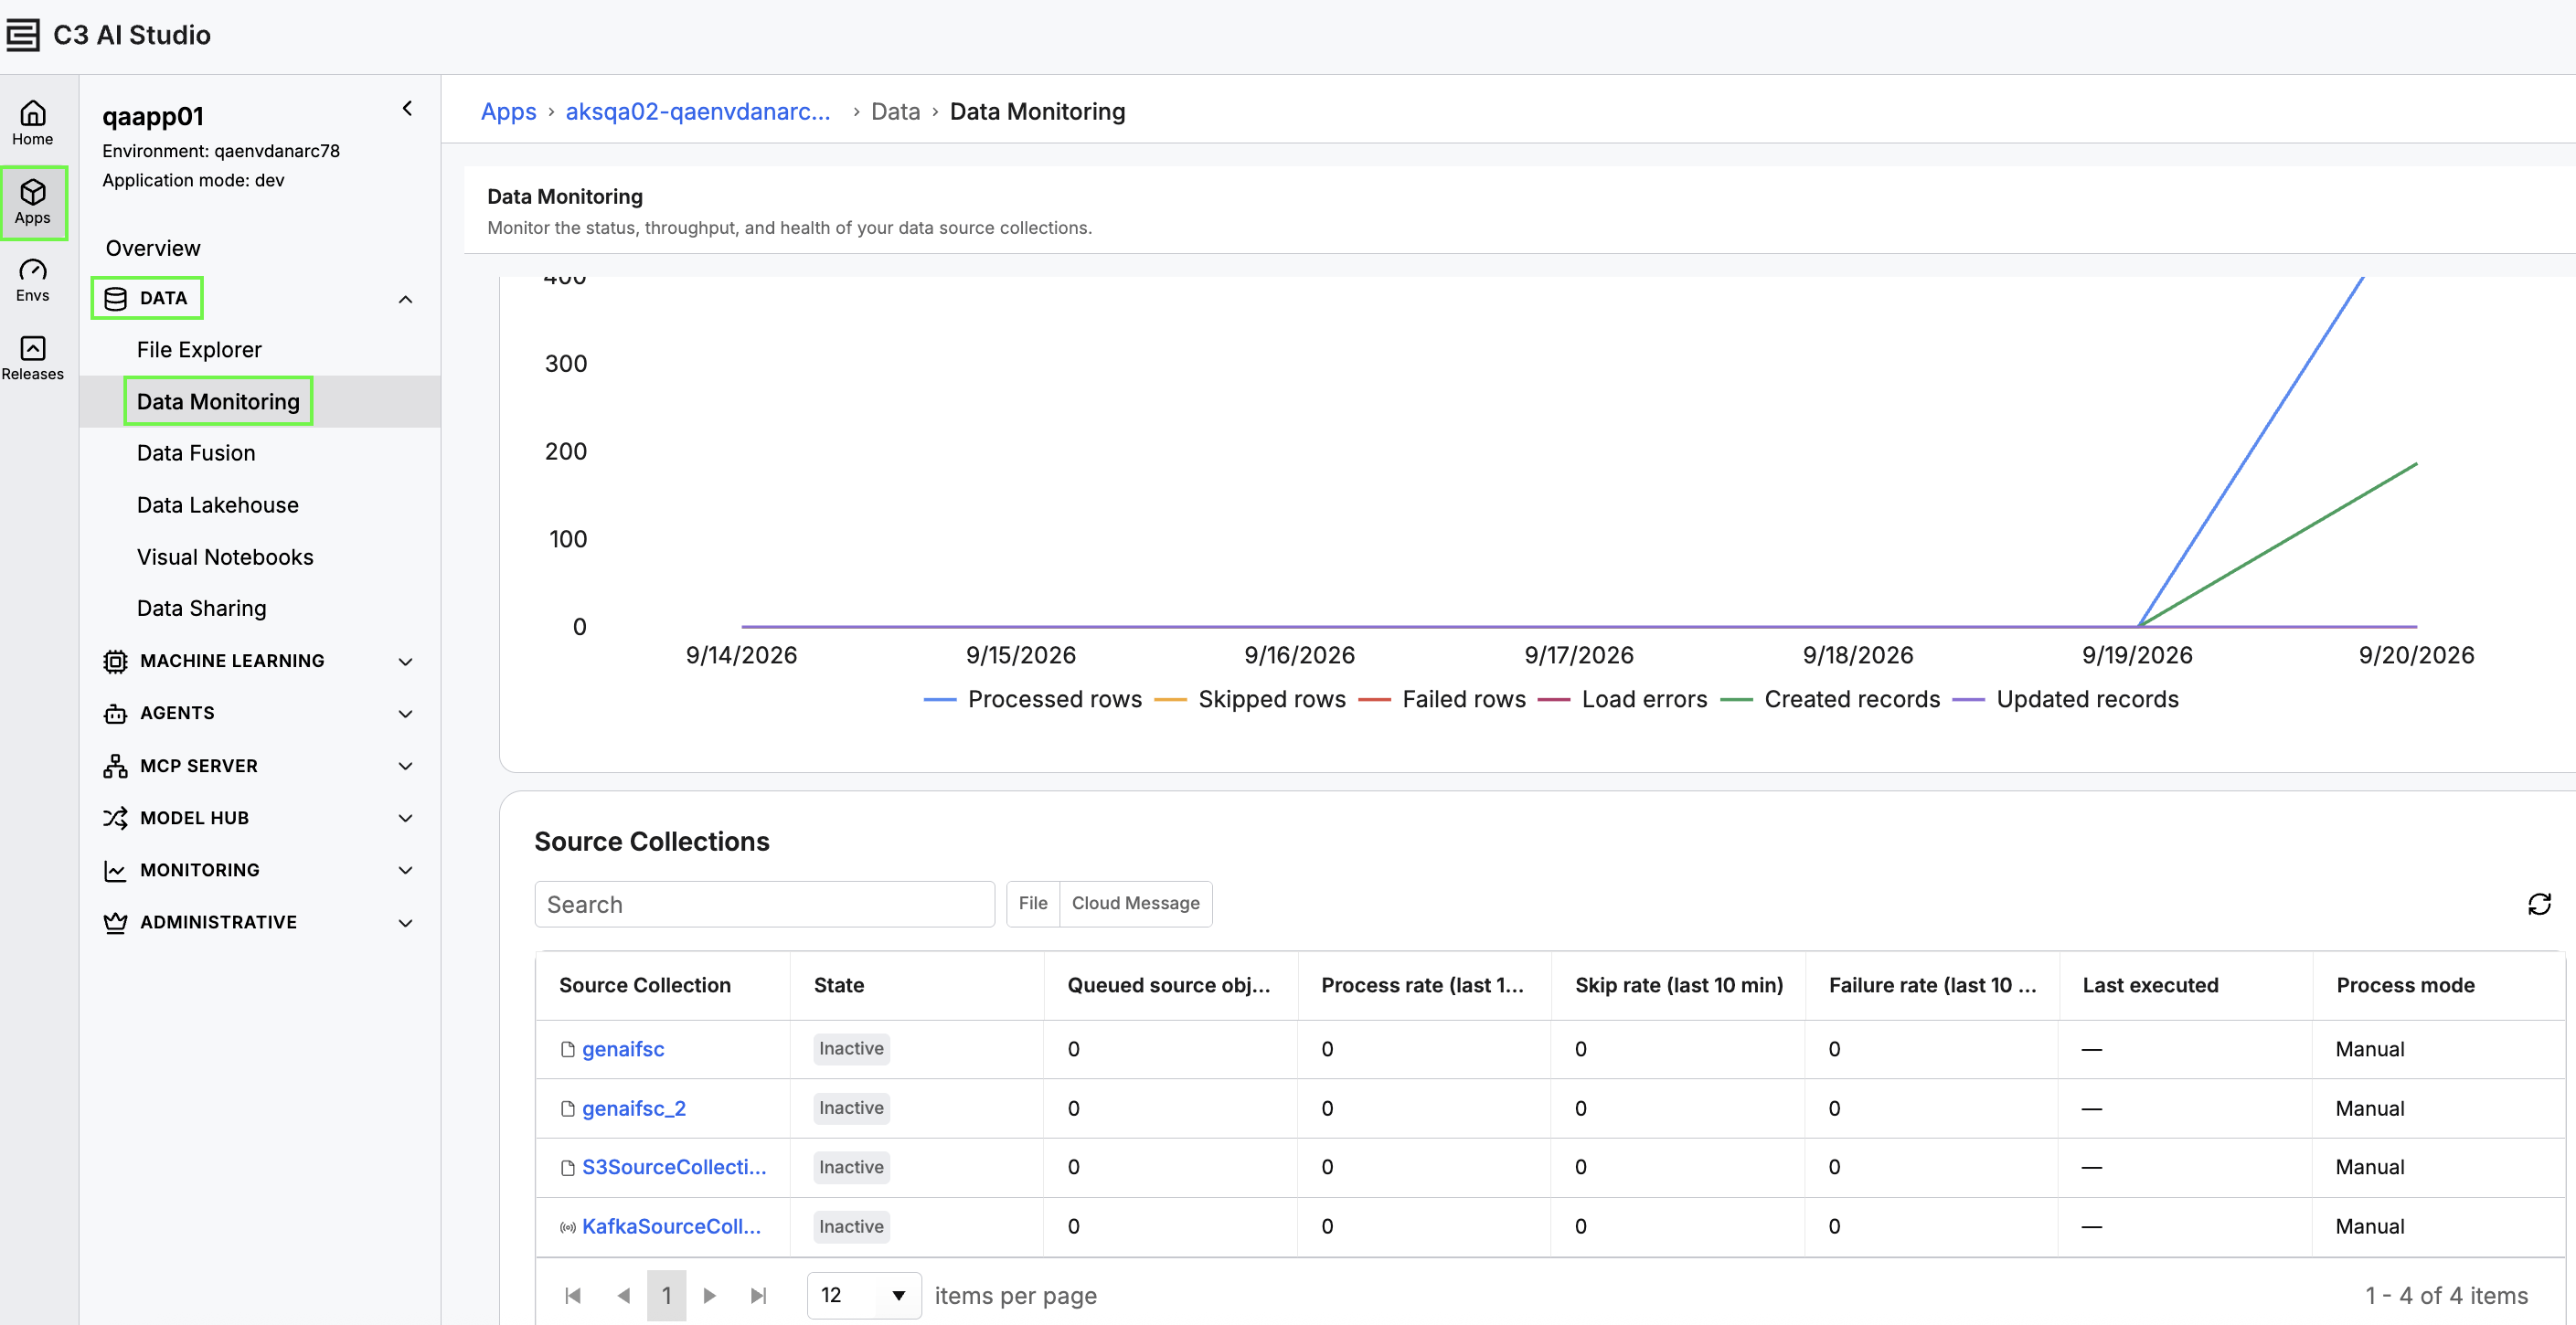
Navigate to Data Monitoring
- In C3 AI Studio, navigate to the Apps page.
- Select an application.
- Select Data in the application sidebar.
- Select Data Monitoring.
 |
| Navigate to Data Monitoring |
The Data Monitoring page has the following sections:
- A data volume chart.
- A source collections list that you can select for more detail.
Data volume
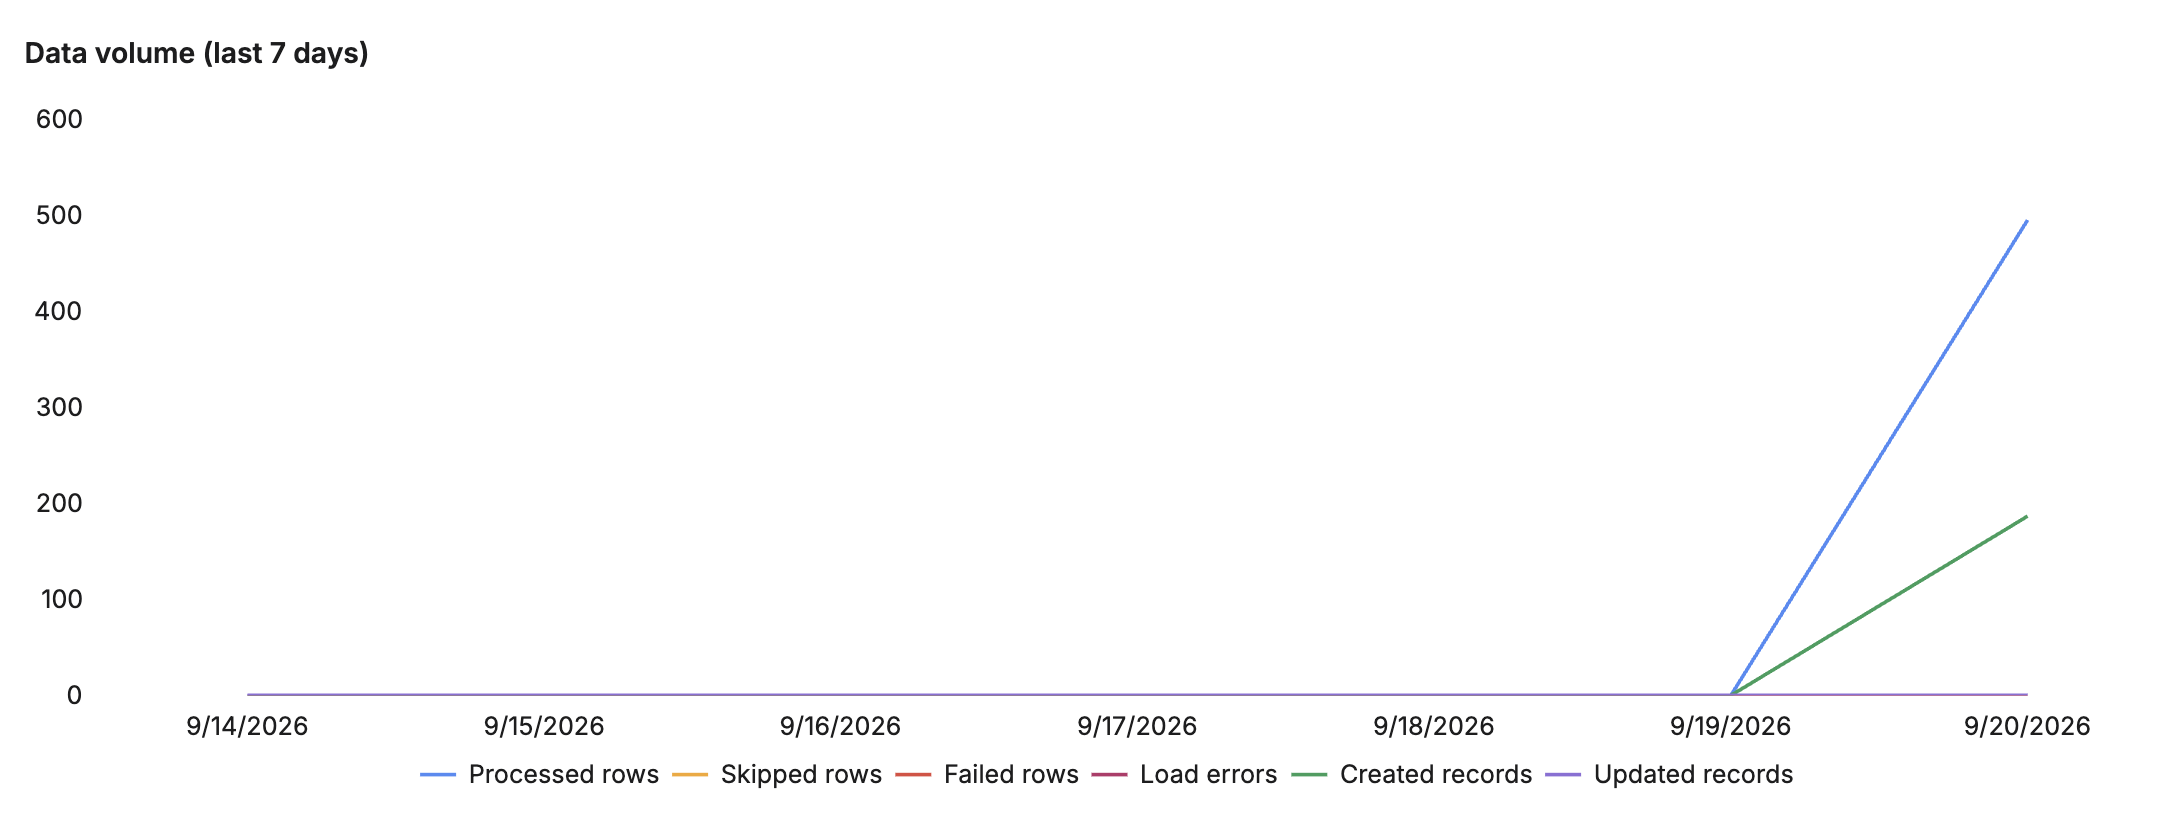
The Data volume chart shows data processing statistics across all source collections in the application.
 |
| Data Volume |
The Data volume chart shows one line per metric:
- Processed rows: Number of successfully transformed and persisted data records.
- Skipped rows: Rows that failed at least one defined transformation condition during data processing.
- Failed rows: Data rows that failed data processing.
- Load errors: Data upload or transform errors.
- Created records: Number of new entity Type records created from source collections.
- Updated records: How many entity Type records were updated after processing new data.
For more information on syncing and processing uploaded files, see Select a Pipeline Execution Type.
Source collections list
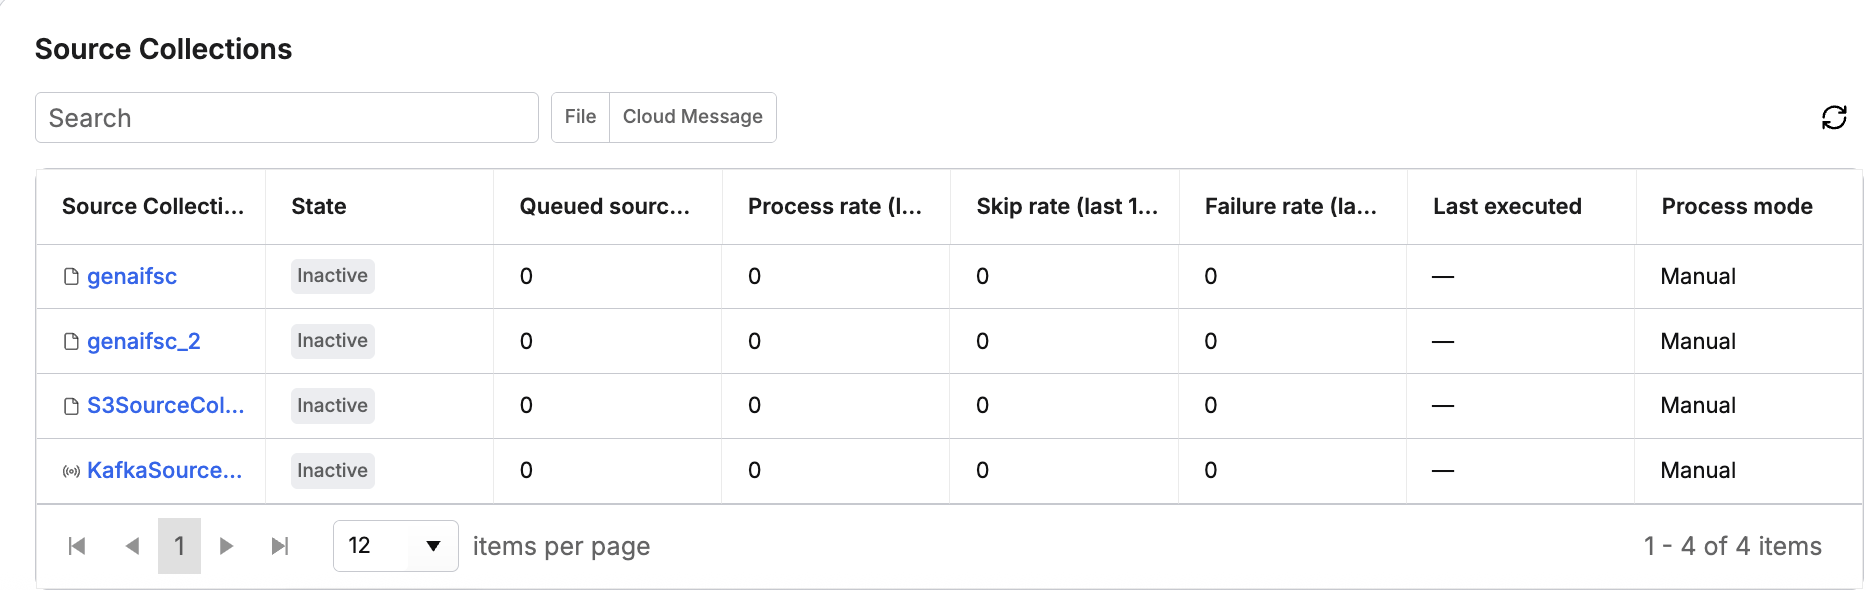
This lists the FileSourceCollections and CloudMessageSourceCollections in your application. Select a source collection to open its detail view.
FileSourceCollection: represents a collection of files from an external source system, such as an Amazon S3 bucket.CloudMessageSourceCollection: represents messages received from a cloud message broker, such as Apache Kafka or Amazon Kinesis.
 |
| Source Collection List |
The list contains the following columns:
- Source Collection: Name of the source collection.
- State: Indicates whether the collection is processing data. Possible values are:
Inactive: Source collection is not processing data.Processing: Source collection is processing data.Paused: The source collection's queue is paused.Ready for processing: The source collection is a registeredCloudMessageSourceCollection, or a scheduled collection with aCronJob.
- Queued source objects: Files queued for upload.
- Process rate (last 10 minutes): How many data points were processed.
- Skip rate (last 10 minutes): How many data points did not meet a transformation condition.
- Failure rate (last 10 minutes): How many data points failed one or more transformations.
- Last executed: The last time you processed data.
- Process mode: Indicates whether an integration process was triggered manually or automatically.
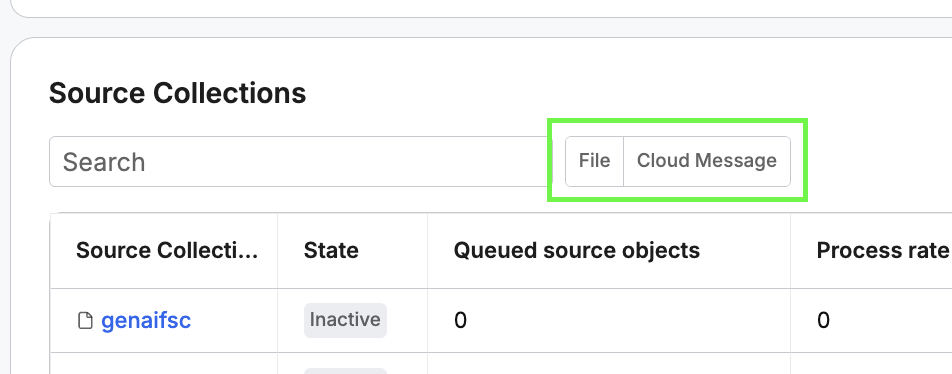
By default, the list shows all File and Cloud Message source collections in your application. Use the search field to narrow the results by collection name, state, or process mode.
Use the File or Cloud Message buttons to filter for file-based or cloud-message-based source collections.
 |
| File and Cloud Message Filter Buttons |
SQL, DataLake, and Custom Connector source collections do not appear on this page, even if they exist in your application's Data Fusion configuration.
Source collection detail
Select a source collection from the list to open its detail view. This shows the collection's name, type (File or Cloud Message), and current status (for example, OK) at the top of the page. Select a file or run in the list to open its detail view.
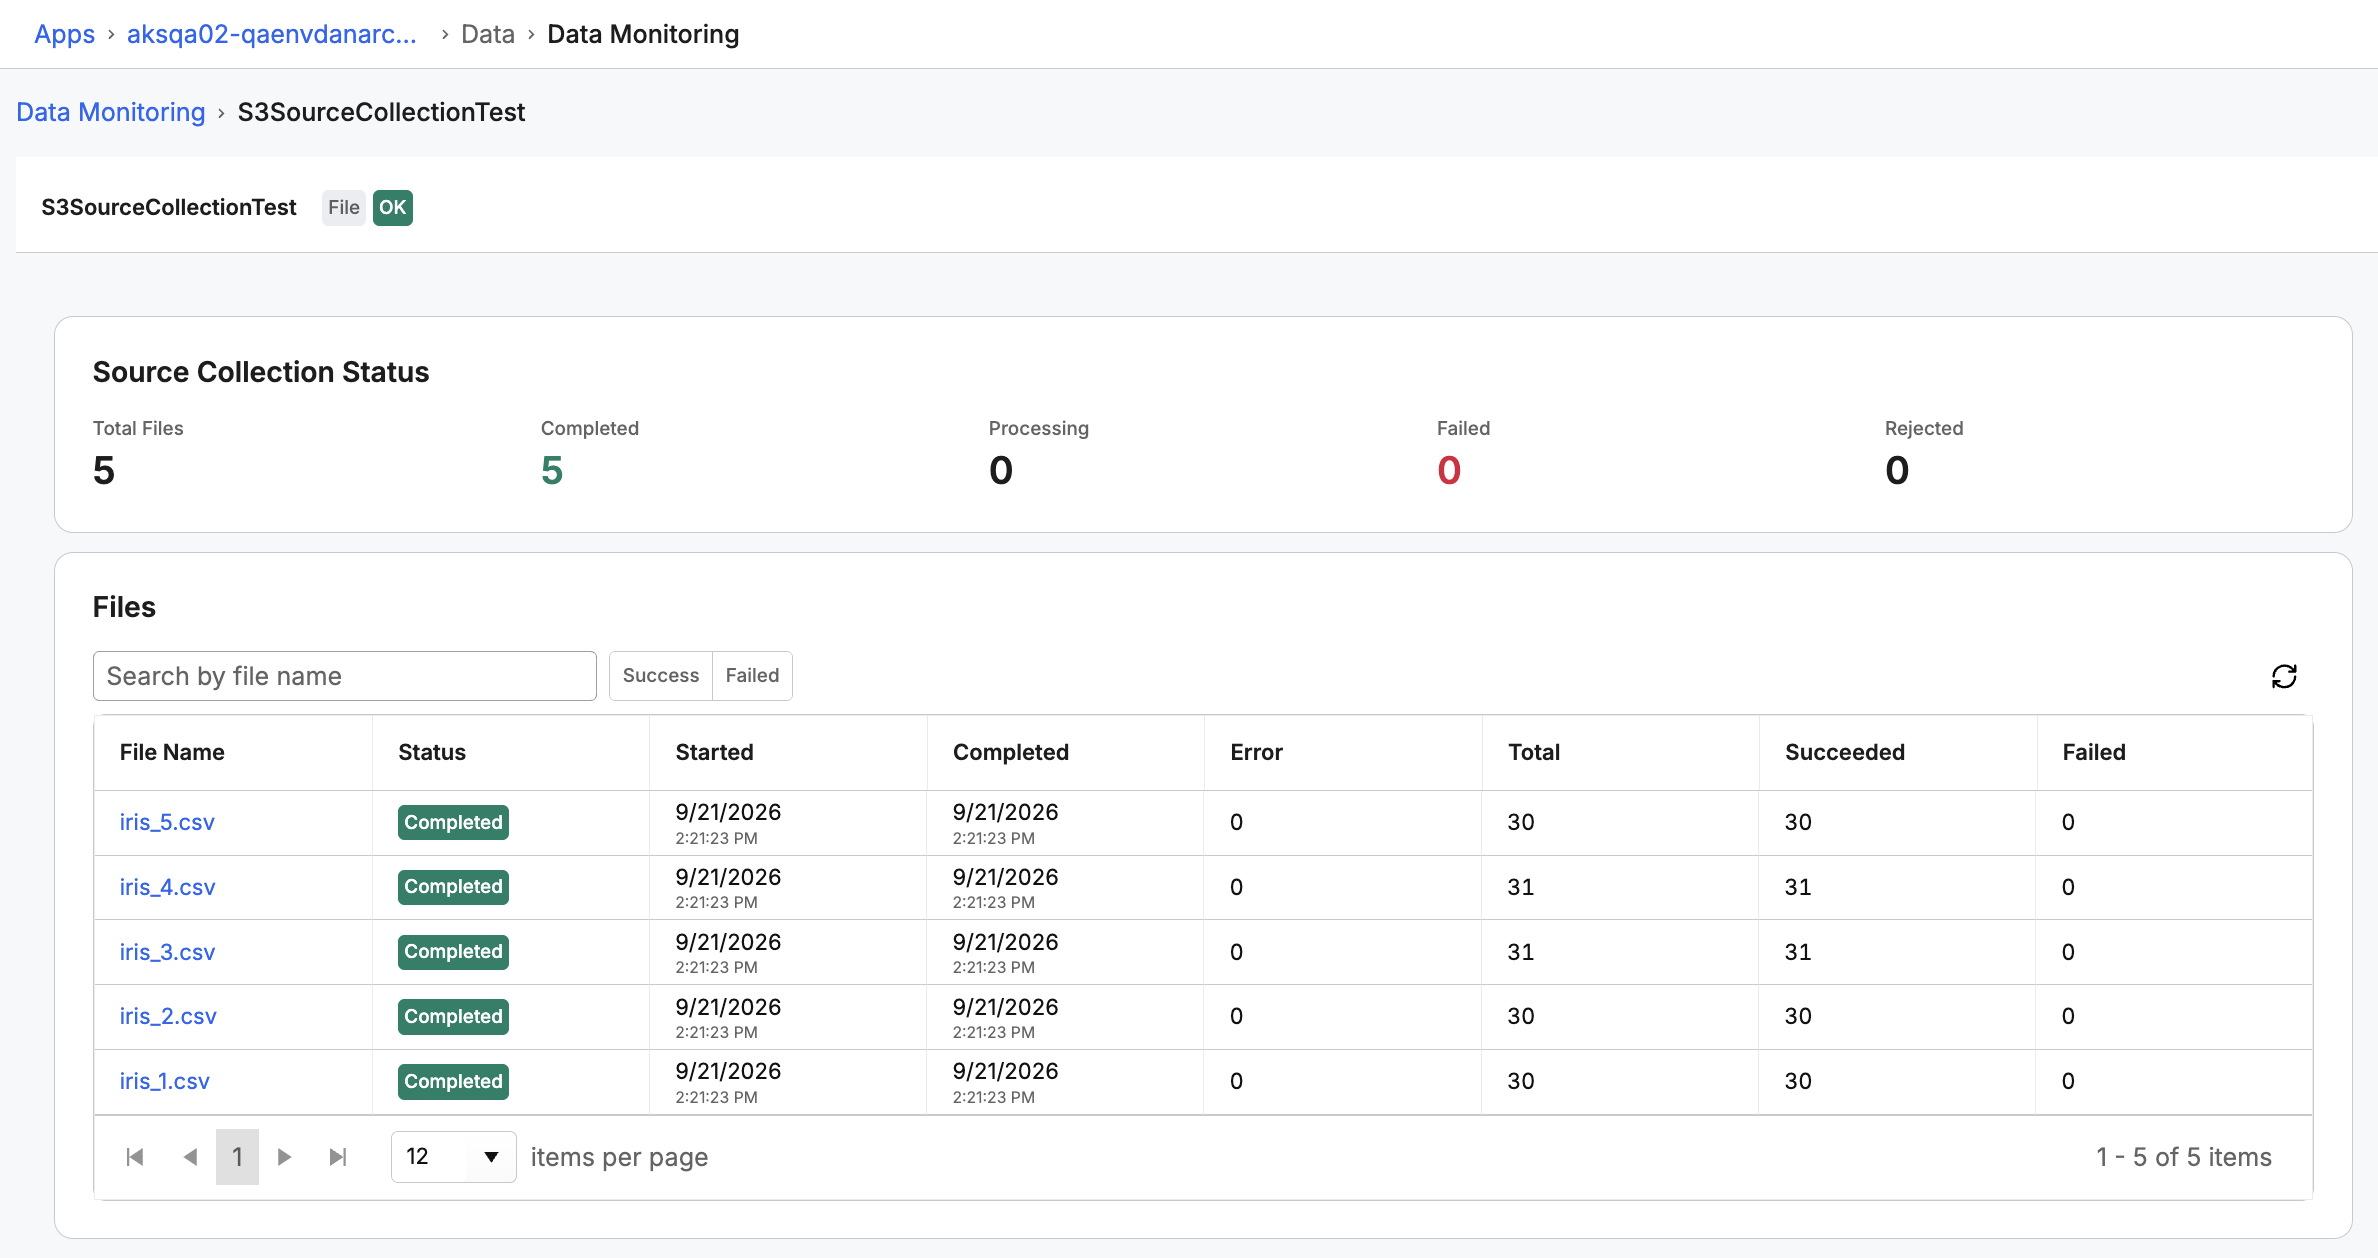 |
| Source Collection Detail for a File |
The detail view has two sections:
Source Collection Status
This is a summary panel that shows counts of the files or runs in a source collection.
 |
| Source Collection Status for a File |
 |
| Source Collection Status for a Cloud Message |
The following counts appear in the source collection status:
- Total Files (Total Runs for Cloud Message source collections)
- Completed
- Processing
- Failed
- Rejected
Files or Processing Runs
This section lists the files or runs processed by the collection.
File Source Collection
For File source collections, this lists the files processed by the collection. Use the search field to find a file by name, or the Success and Failed buttons to filter the list by outcome.
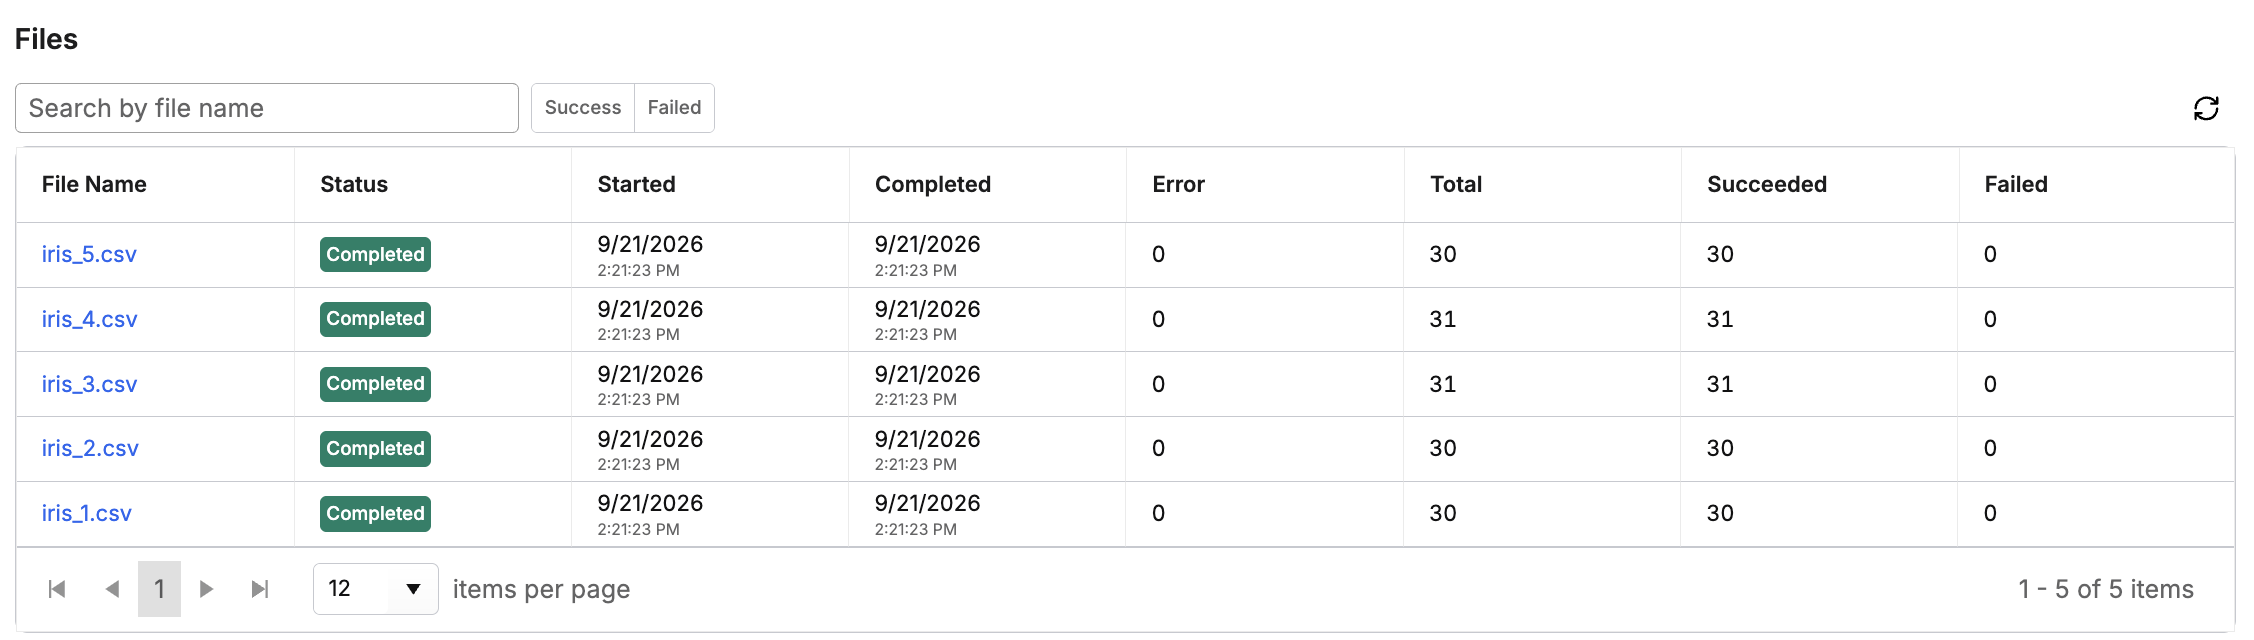 |
| Source Collection - File |
Cloud Source Collection
For Cloud Message source collections, this section instead lists Processing Runs. This shows one row per batch of messages the collection received from its broker. Use the Success and Failed buttons to filter the list by outcome.
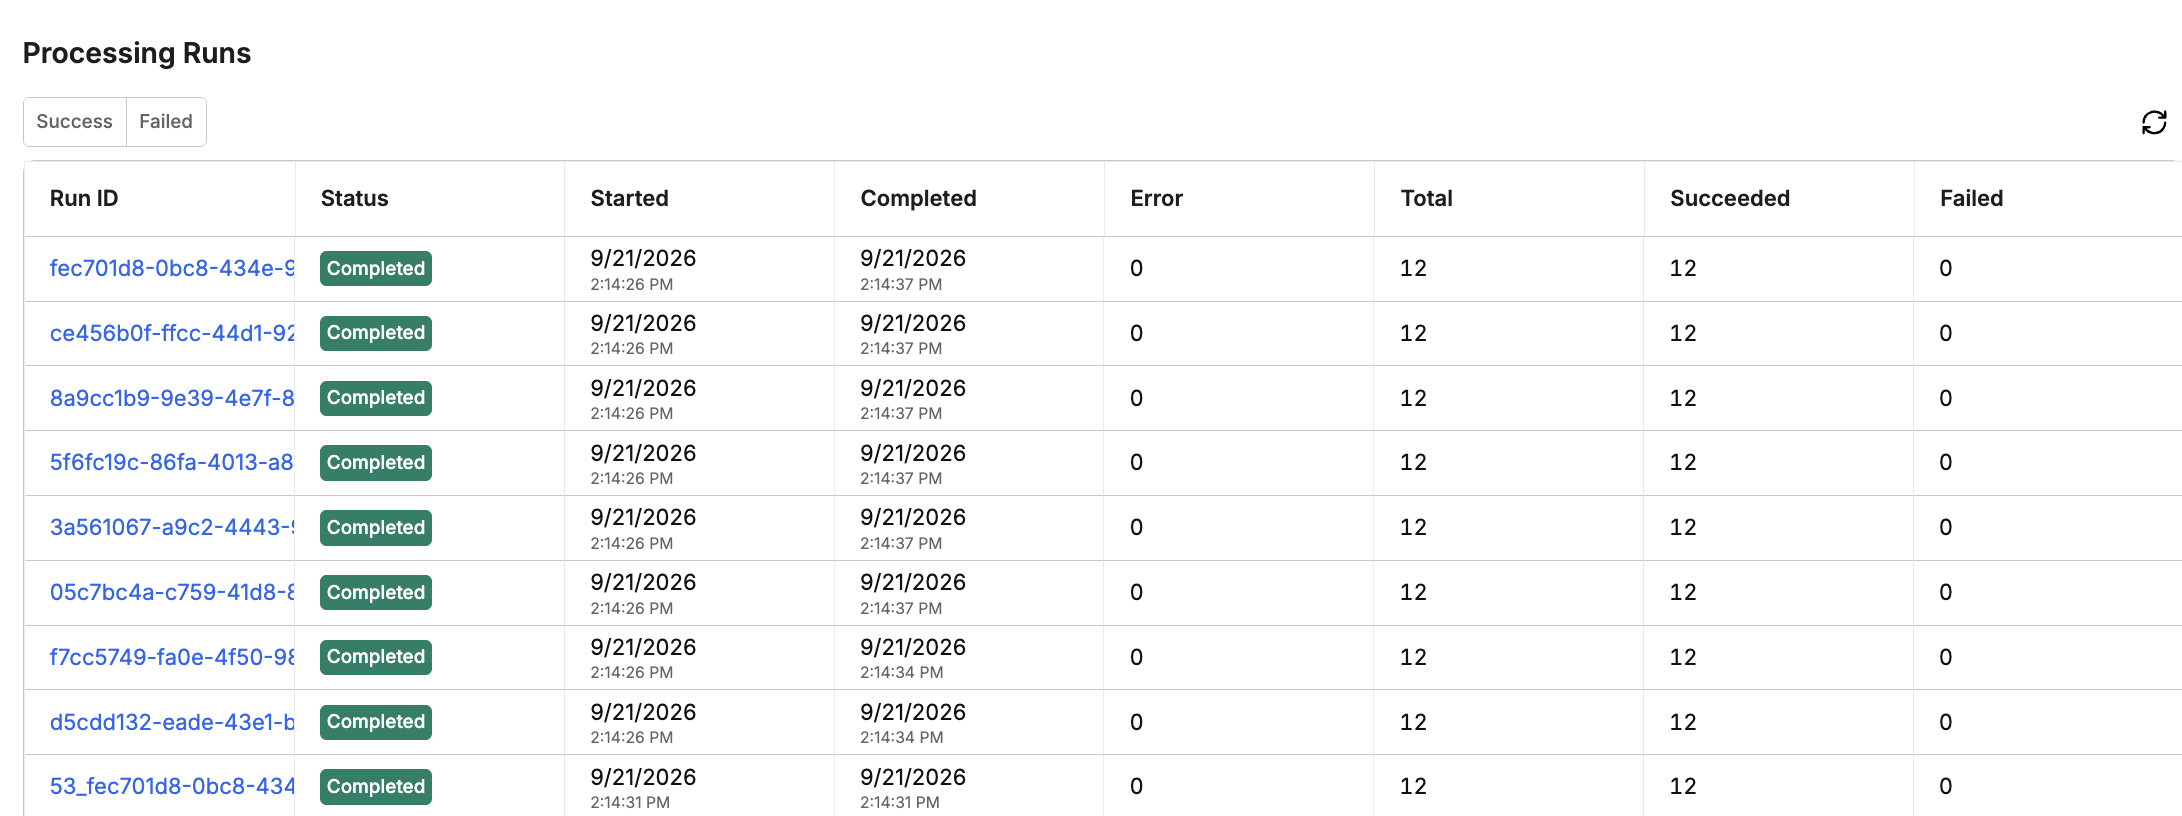 |
| Source Collection - Cloud Message |
File detail
Select a file to open its detail view. You can also select the View Details button to expand the window.
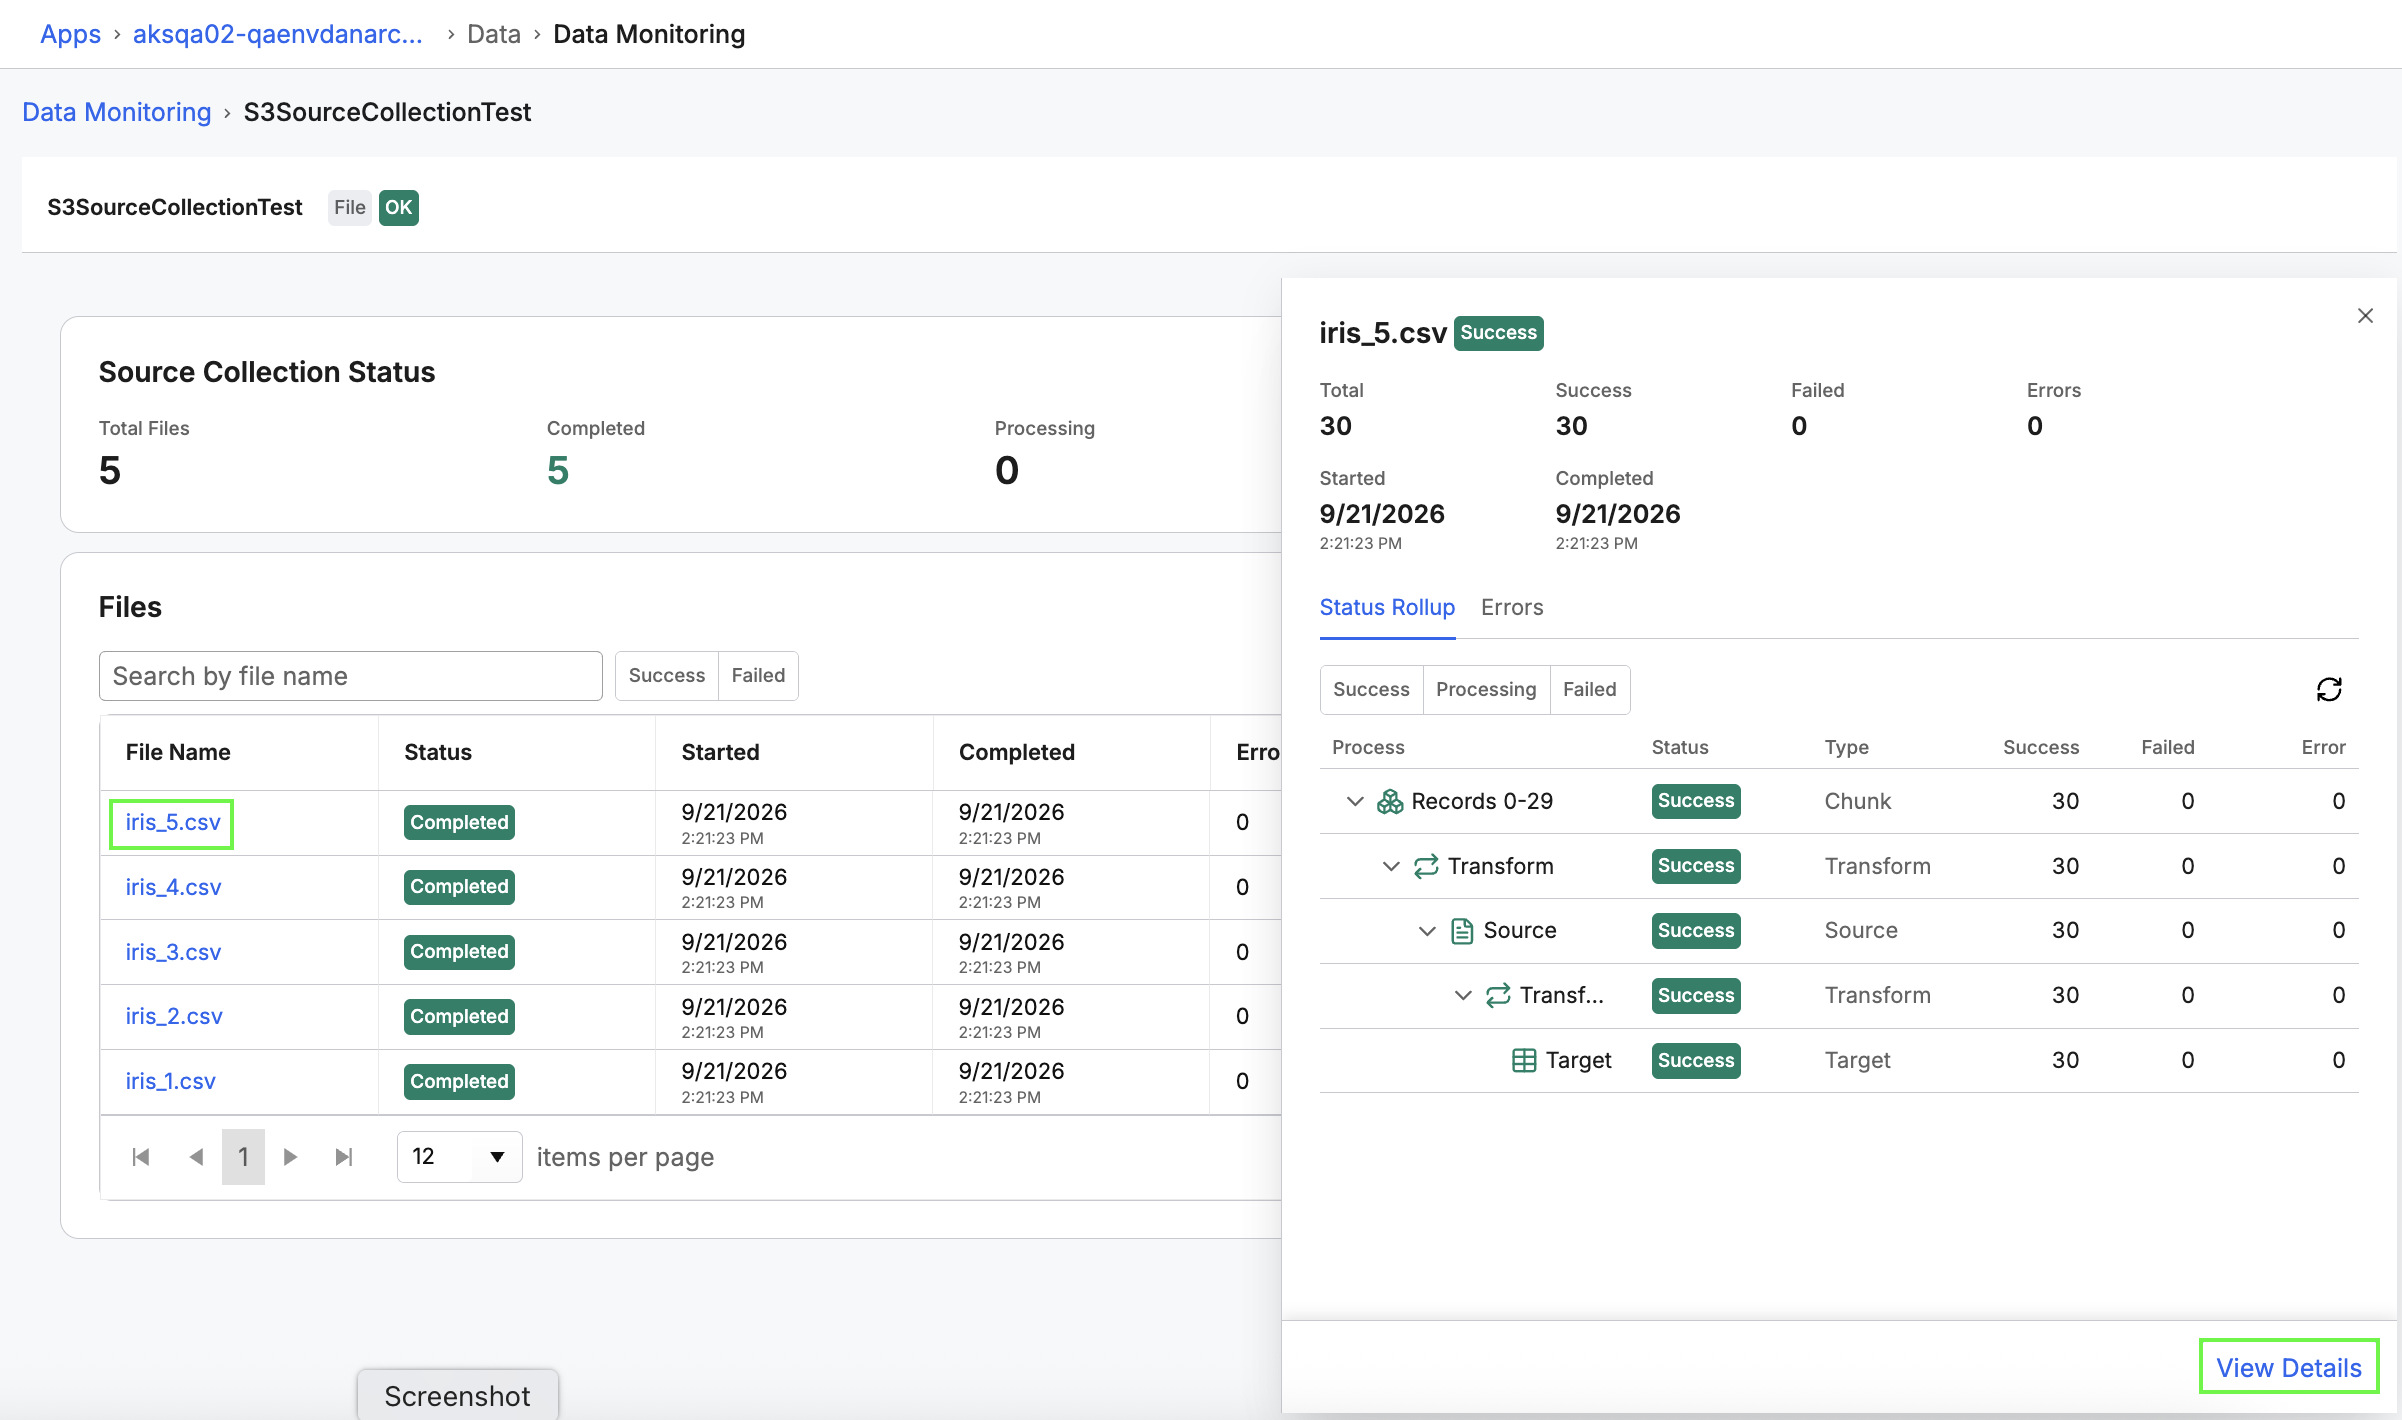 |
| Select a File to View File Detail |
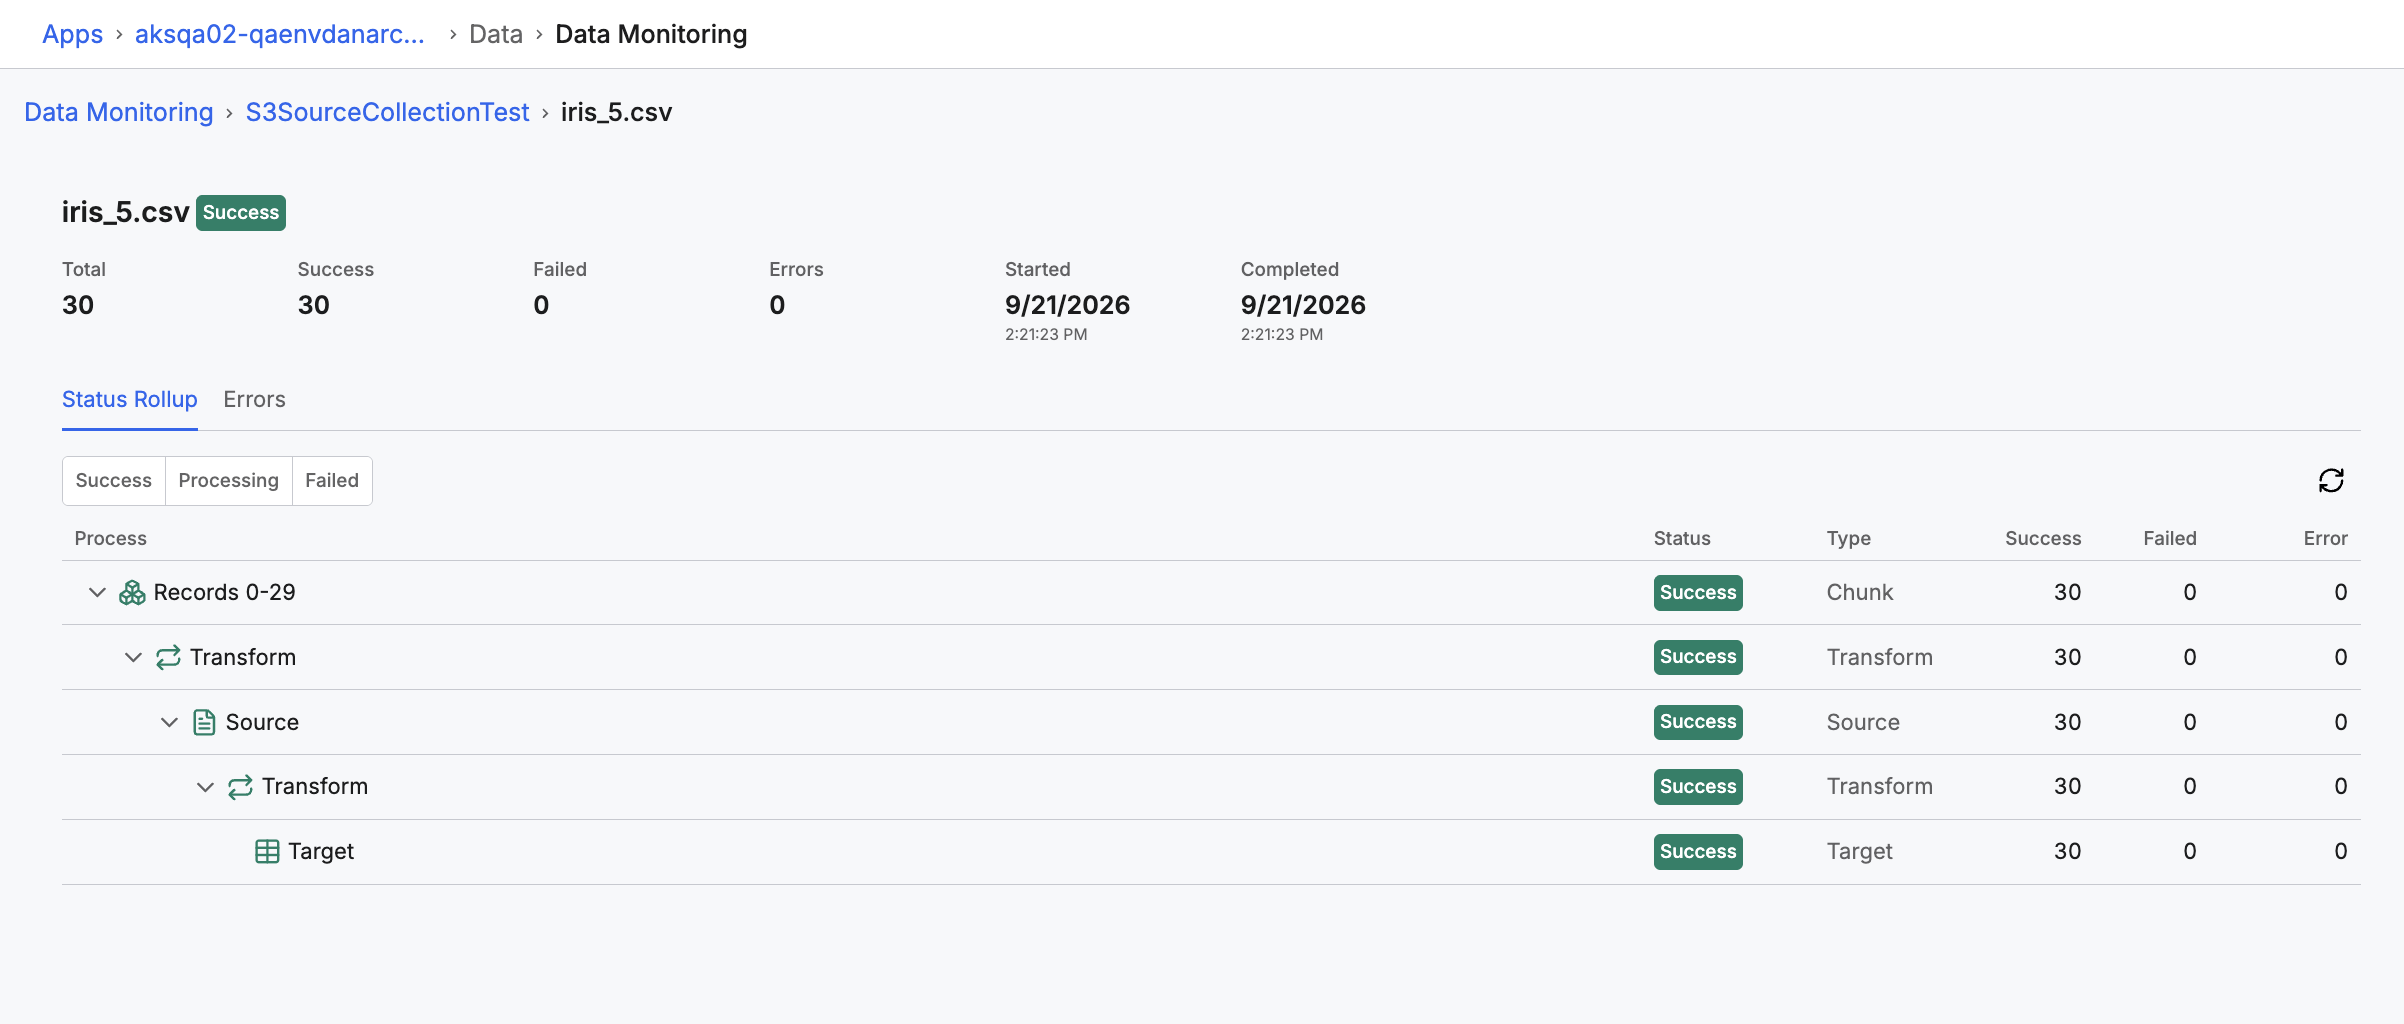 |
| Expanded Window After Selecting View Details |
The detail view shows the following:
- Total: Total rows in the file.
- Success: Rows that were successfully transformed and persisted.
- Failed: Rows that failed transformation.
- Errors: Number of errors encountered while processing.
- Started: When processing started.
- Completed: When processing completed.
The detail view has two tabs:
- Status Rollup: A tree of the processing steps (source, chunk, transform, and target), each showing its status and success, failure, and error counts. Select a step to see more detail.
- Errors: A list of errors encountered while processing the file.
Run detail
For a Cloud Message, select a run to open its detail view. You can also select the View Details button to expand the window.
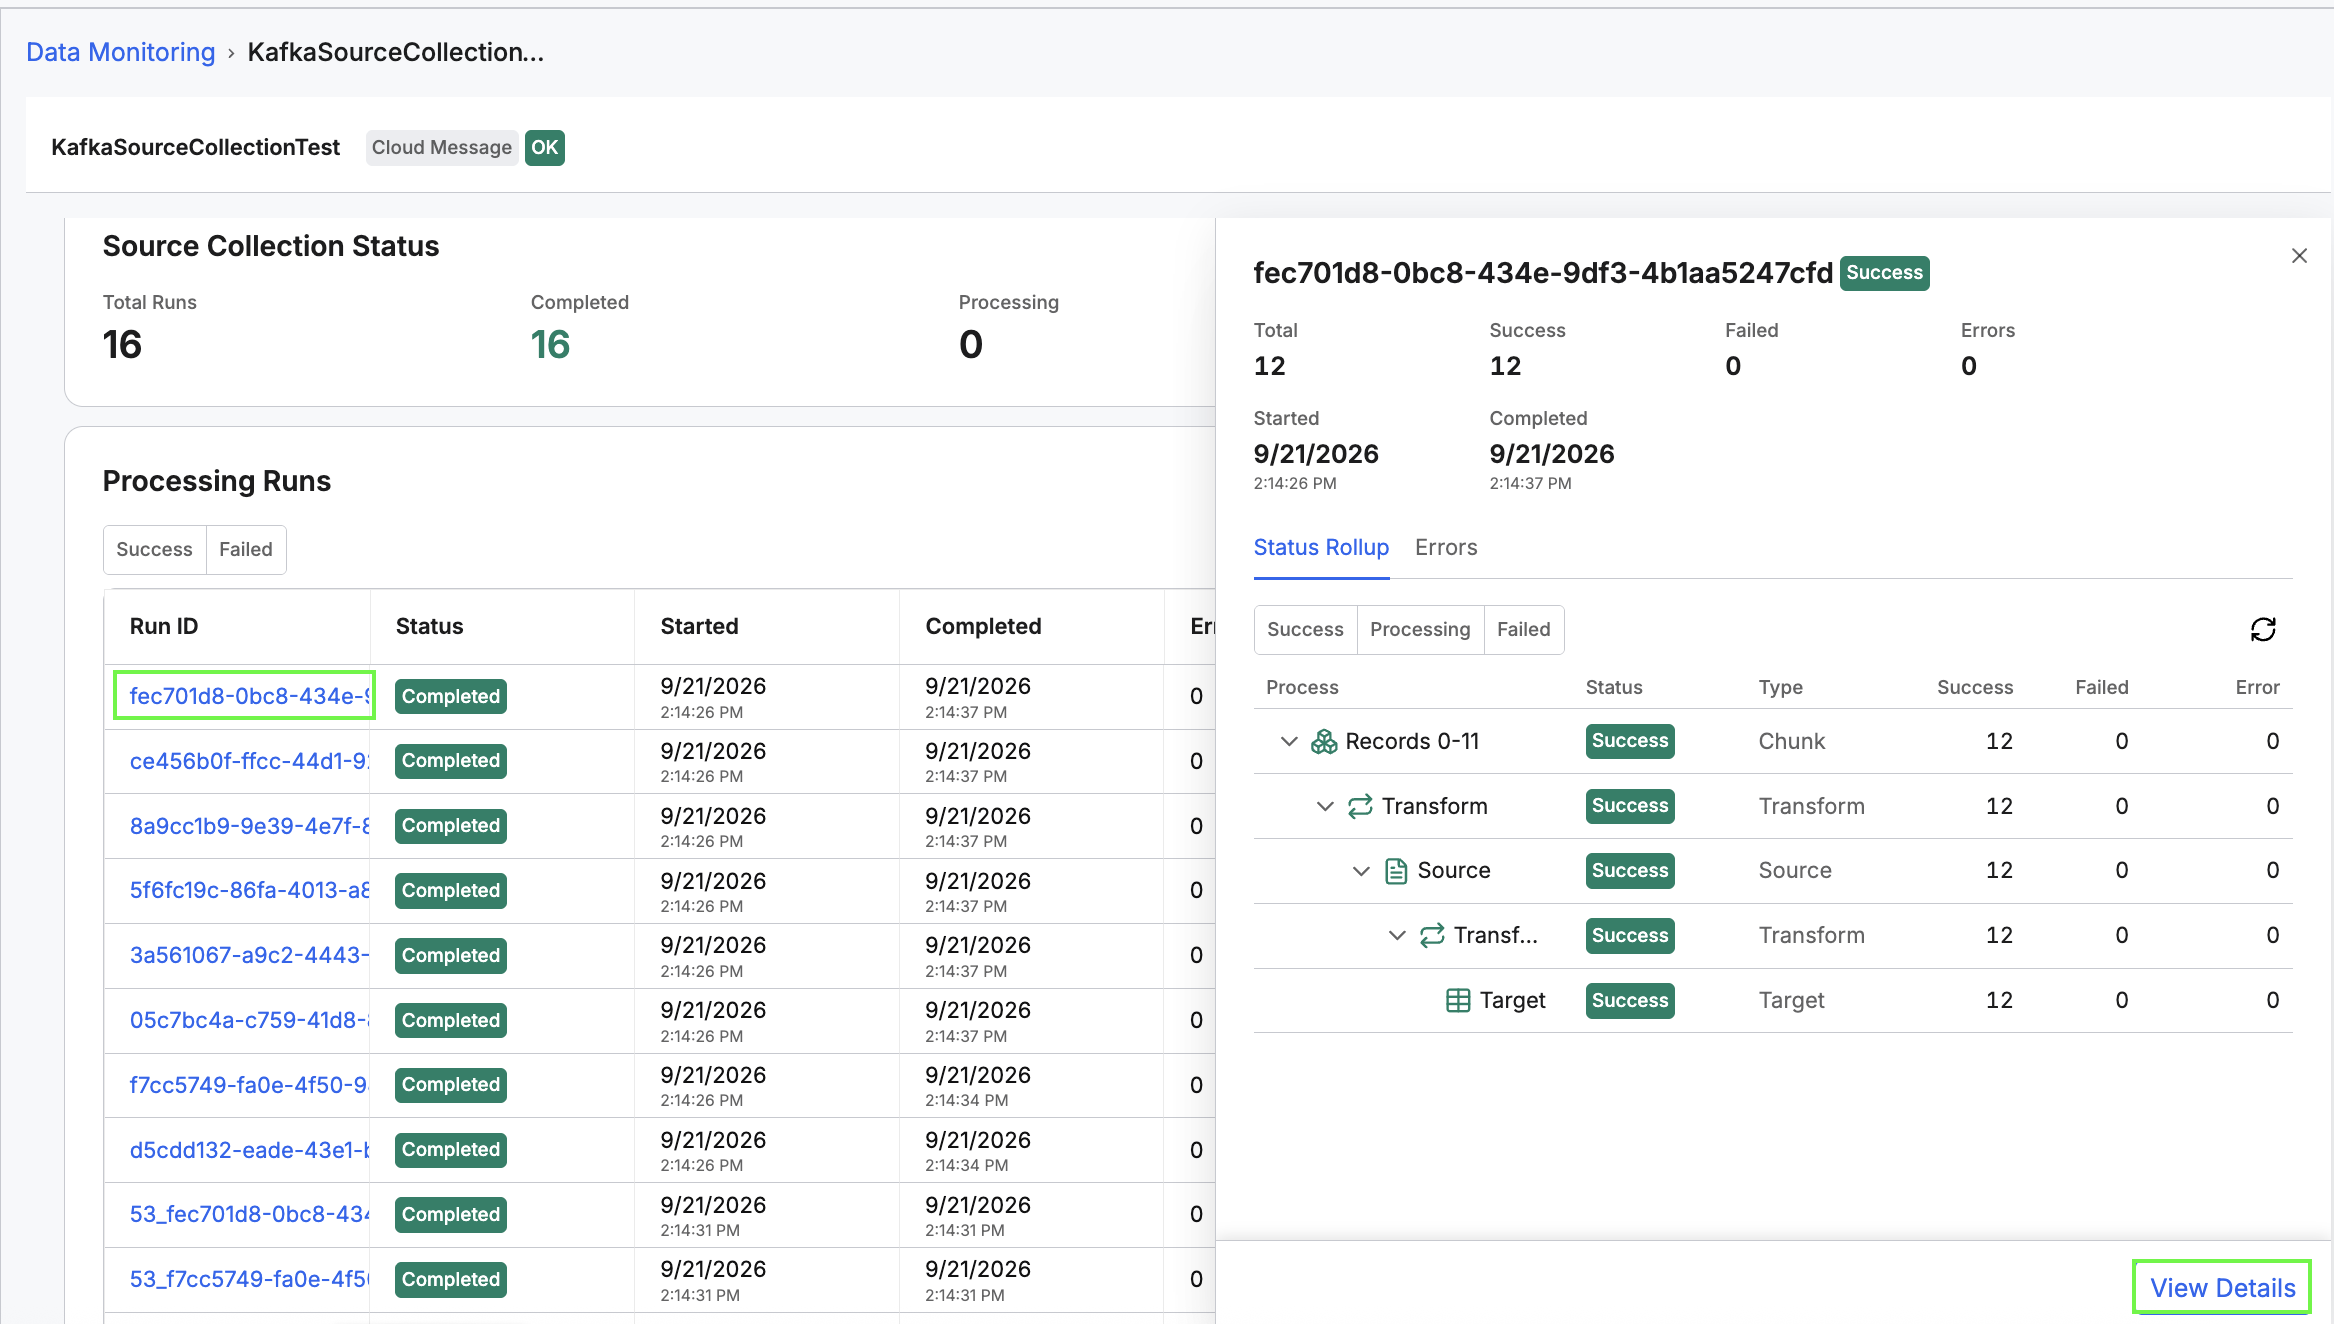 |
| Select a Run to View Run Detail |
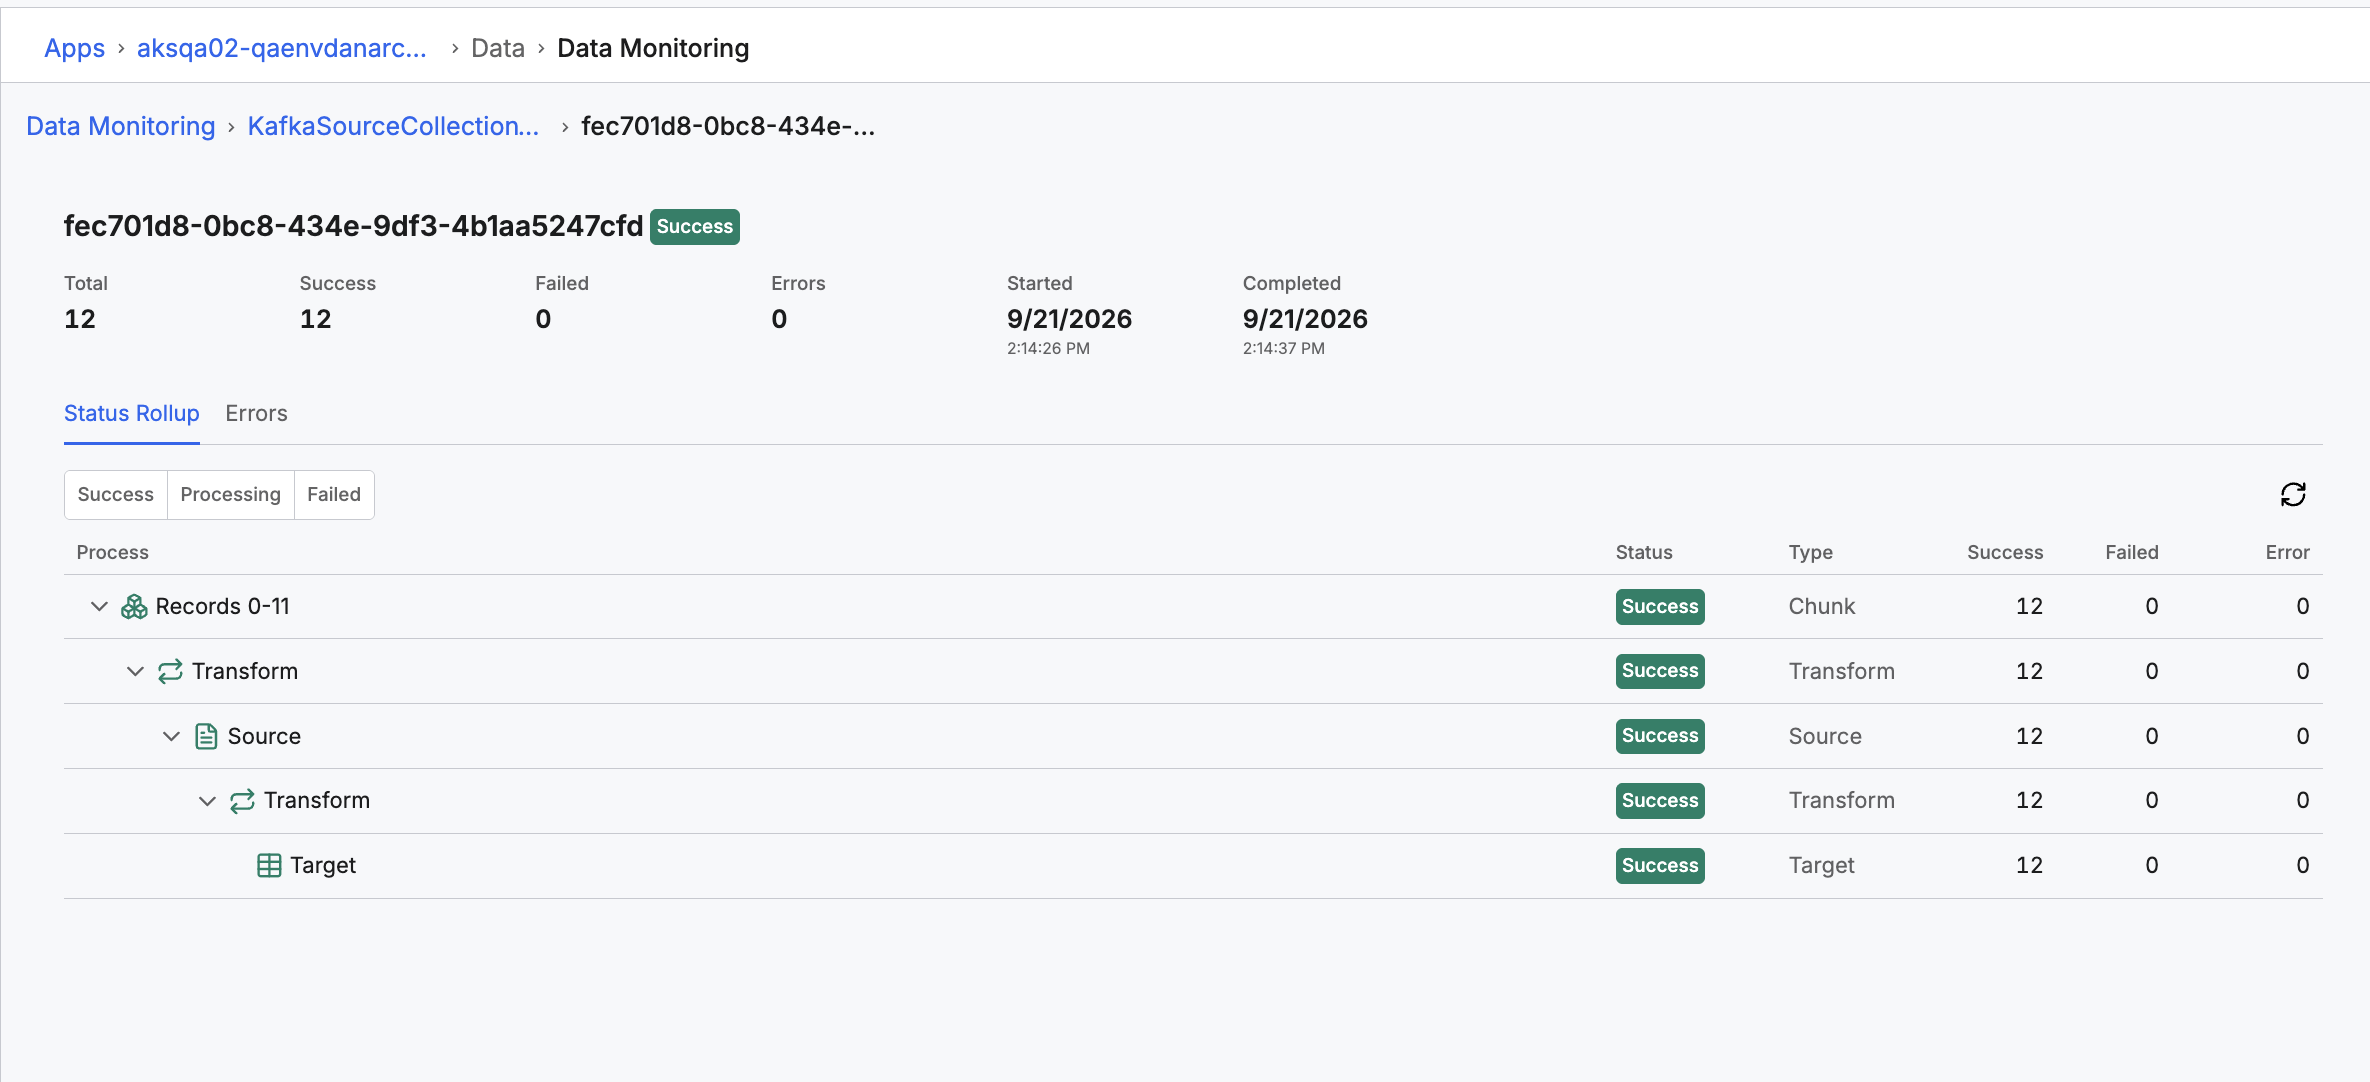 |
| Expanded Window After Selecting View Details |
The detail view shows the following:
- Total: Total rows in the run.
- Success: Rows that were successfully transformed and persisted.
- Failed: Rows that failed transformation.
- Errors: Number of errors encountered while processing.
- Started: When processing started.
- Completed: When processing completed.
The detail view has two tabs:
- Status Rollup: A tree of the processing steps (source, chunk, transform, and target), each showing its status and success, failure, and error counts. Select a step to see more detail.
- Errors: A list of errors encountered while processing the run.