Visualize and Inspect C3 Workflow Runs
C3 Workflows are instances of a directed acyclic graph (DAG). Use Workflows to automate a series of tasks, as they can perform complex tasks by breaking them into smaller discrete steps and chaining them together. For more information on C3 Workflows, see Orchestrate Workflows Topic.
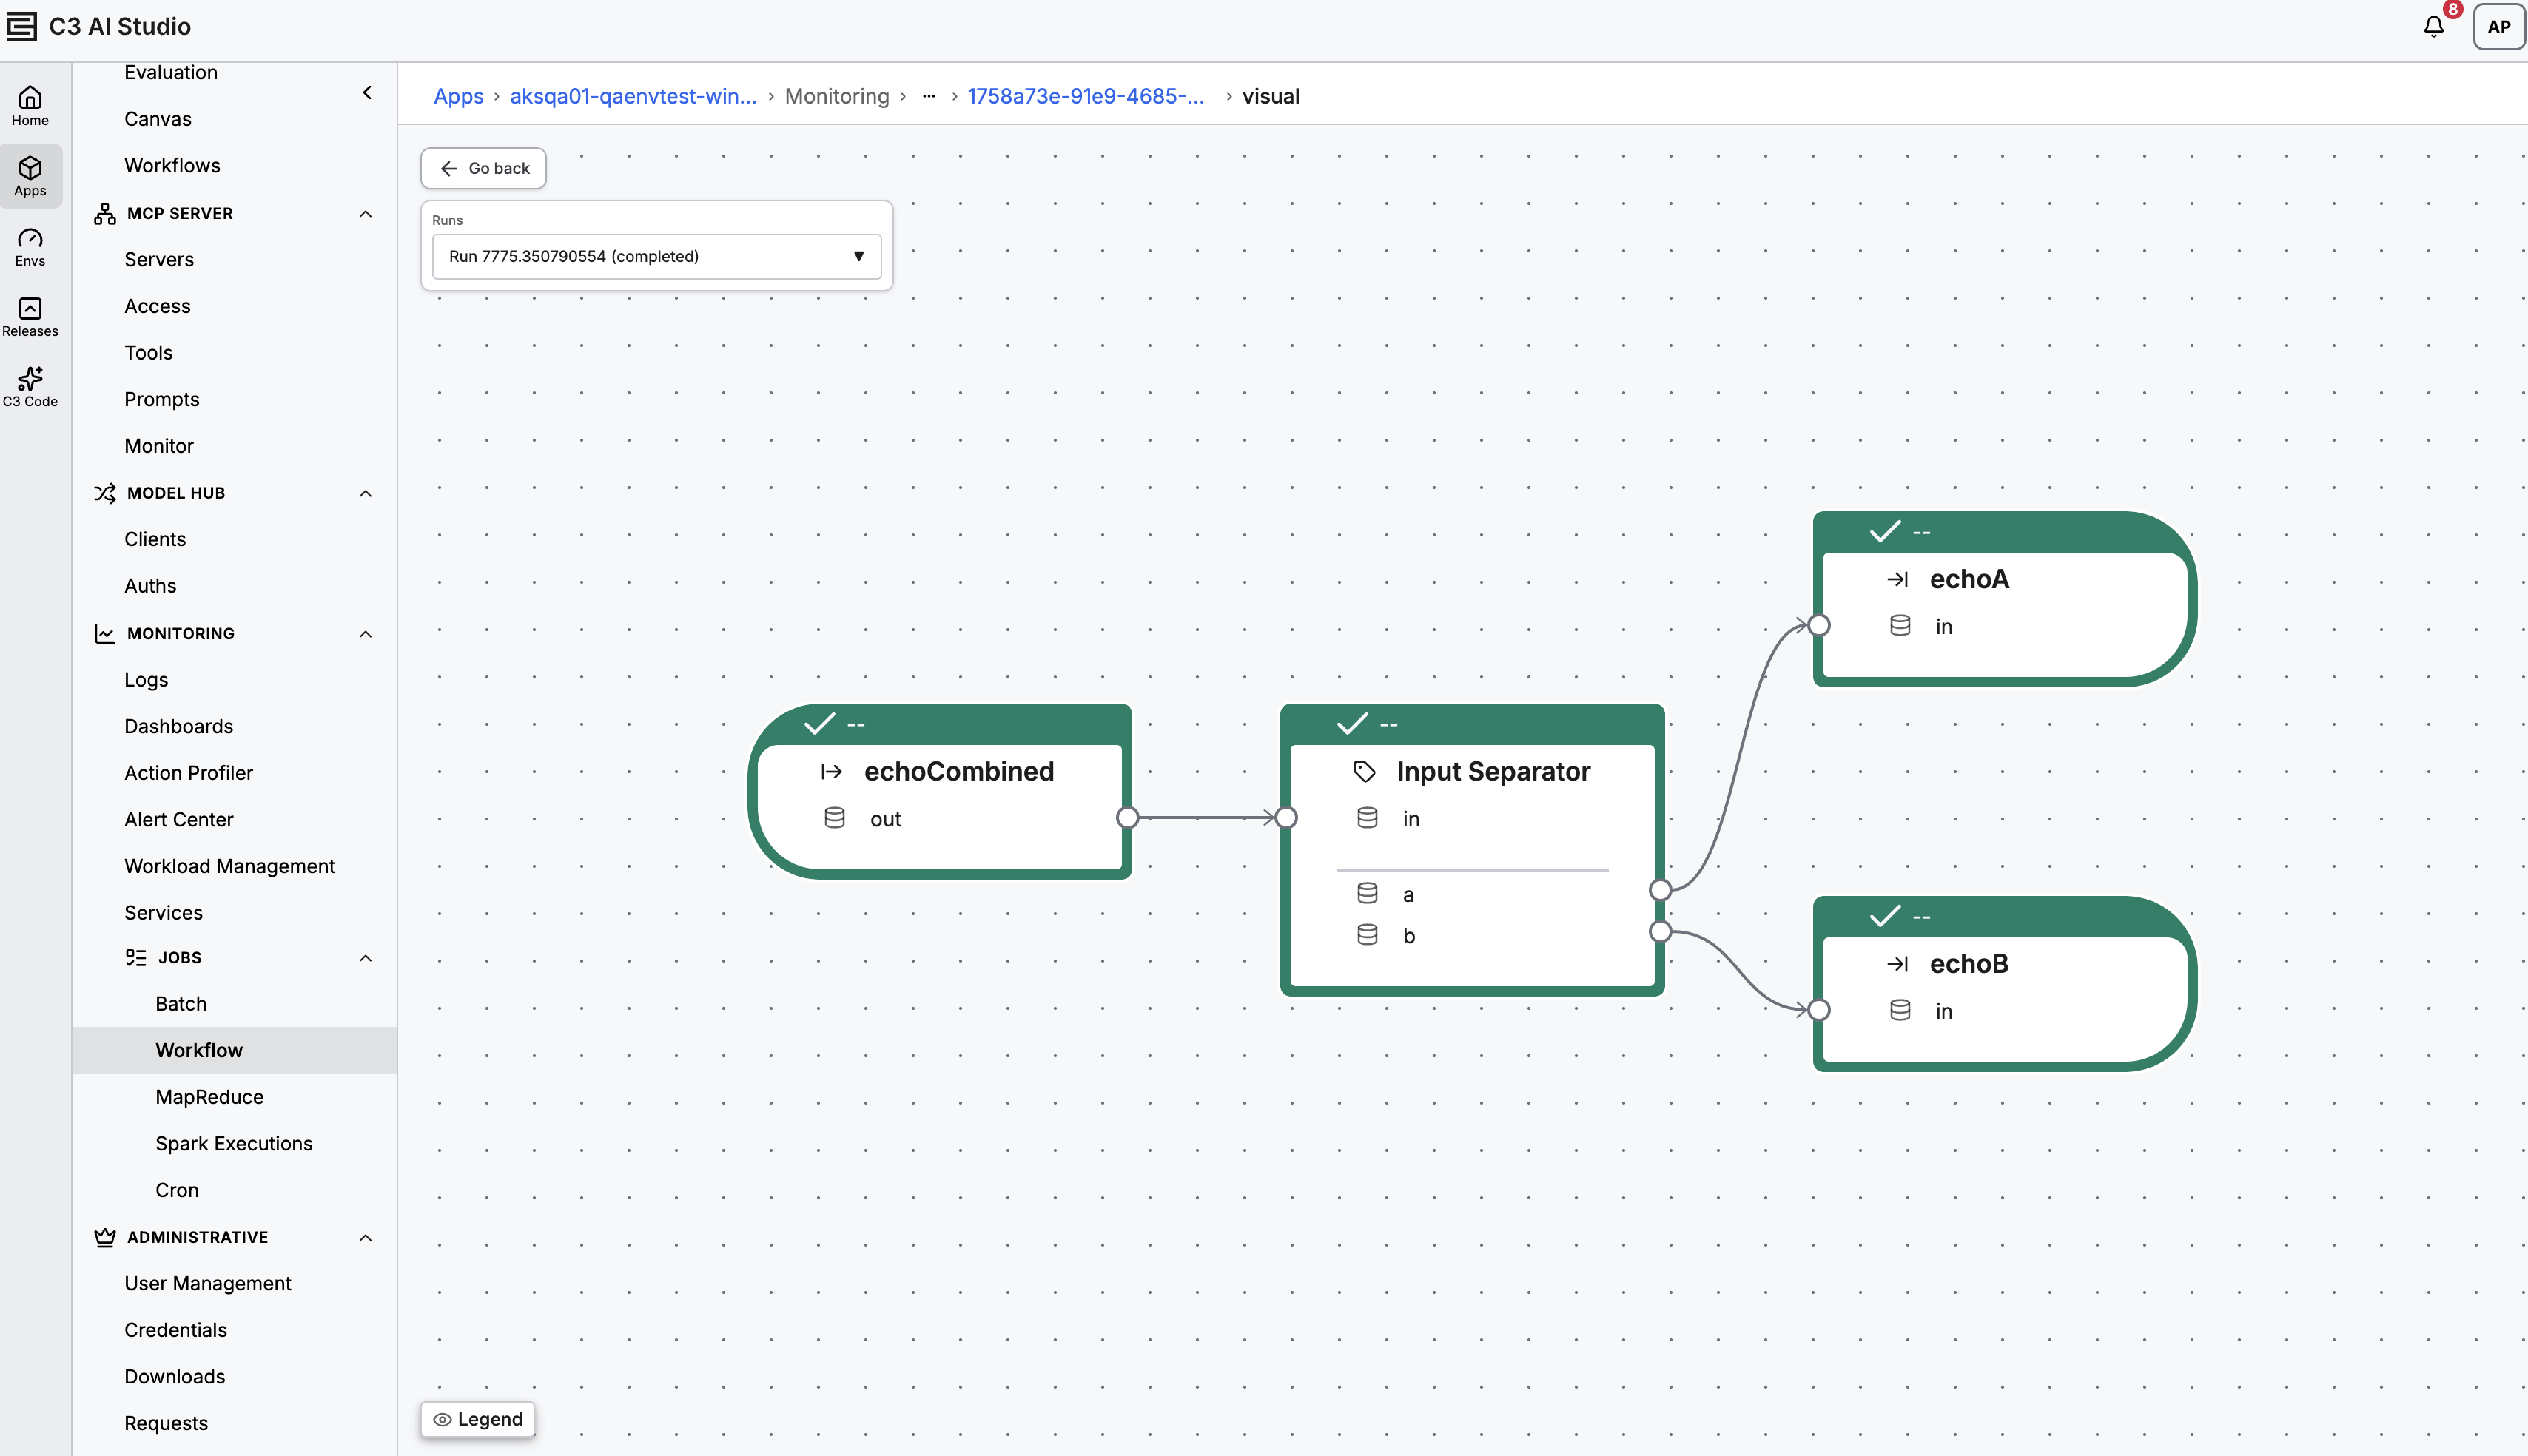
The C3 Workflow Visualization feature within C3 AI Studio allows you to view a graphical representation of the Workflow's DAG. Each Vertex provides you with context about the Vertex's execution status, time taken for execution, errors (if any), and ability to access nested or child Workflows.
Studio Pages
Find C3 Workflows inside the Jobs tab of an app in Studio.<img src="img/workflow-1.png" alt="Jobs Side Panel" height="400"/>
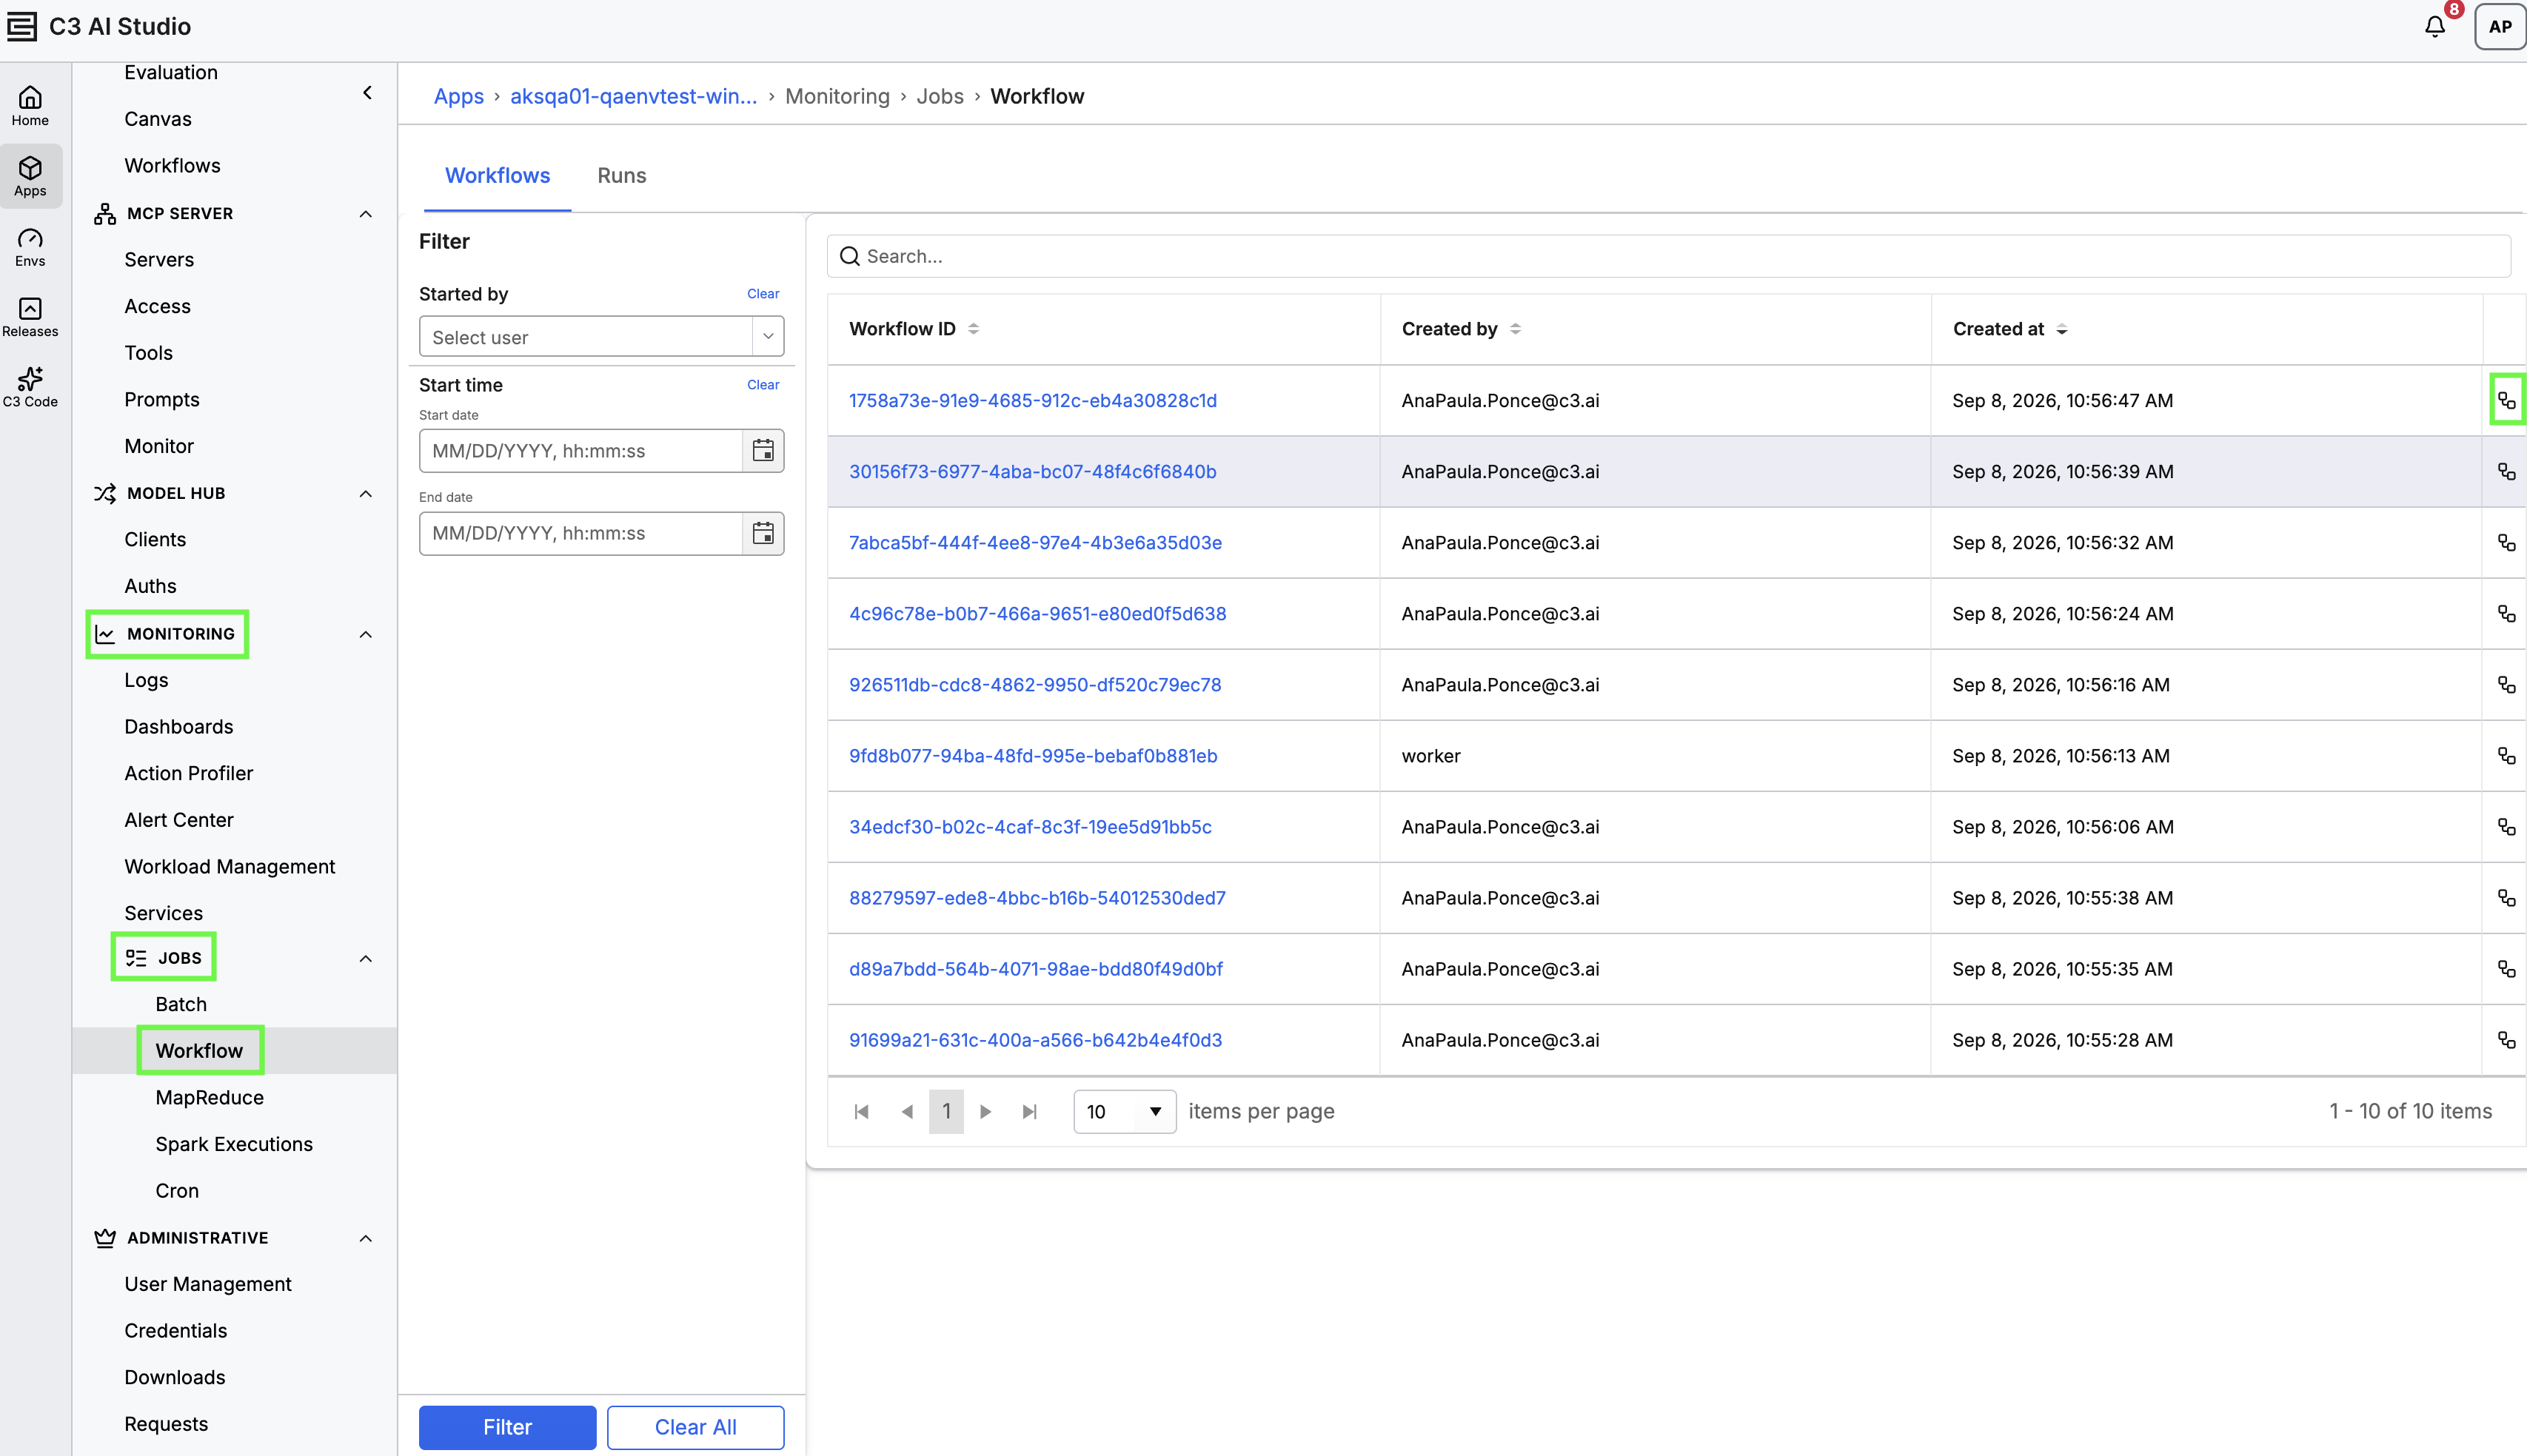
Select the Workflow tab to view the Workflows page, which provides you a list of all Workflows defined in your App. Alternatively, you can use the Runs page, which provides you a list of all Workflow.Runs (i.e runs) in your App
Workflows Page
The Workflows page provides you a list of all an App's defined Workflows. The table provides three columns you can filter or search by.
| Column | Usage | Searchable |
|---|---|---|
| Workflow ID | The unique ID for a Workflow. Clicking on the ID takes you to the Runs page, with a filter to show you only Runs for the selected Workflow. | ☑ |
| Created by | The author of a Workflow. This can be a user of the App, eg. First.Last@c3.ai, or Workflows created by the system, which will appear as Worker. The Started by filter allows you to display Workflows by a selected author. | ☑ |
| Created at | The date and time a Workflow was created. The Start time and End time filters will allow you to display Workflows that were created during the specified time and date range. | ☒ |
The graph icon at the end of each row is the Visualize button. Select this button to view Graph View of the most recent run of the selected Workflow.
 |
| Workflow Tab |
Runs Page
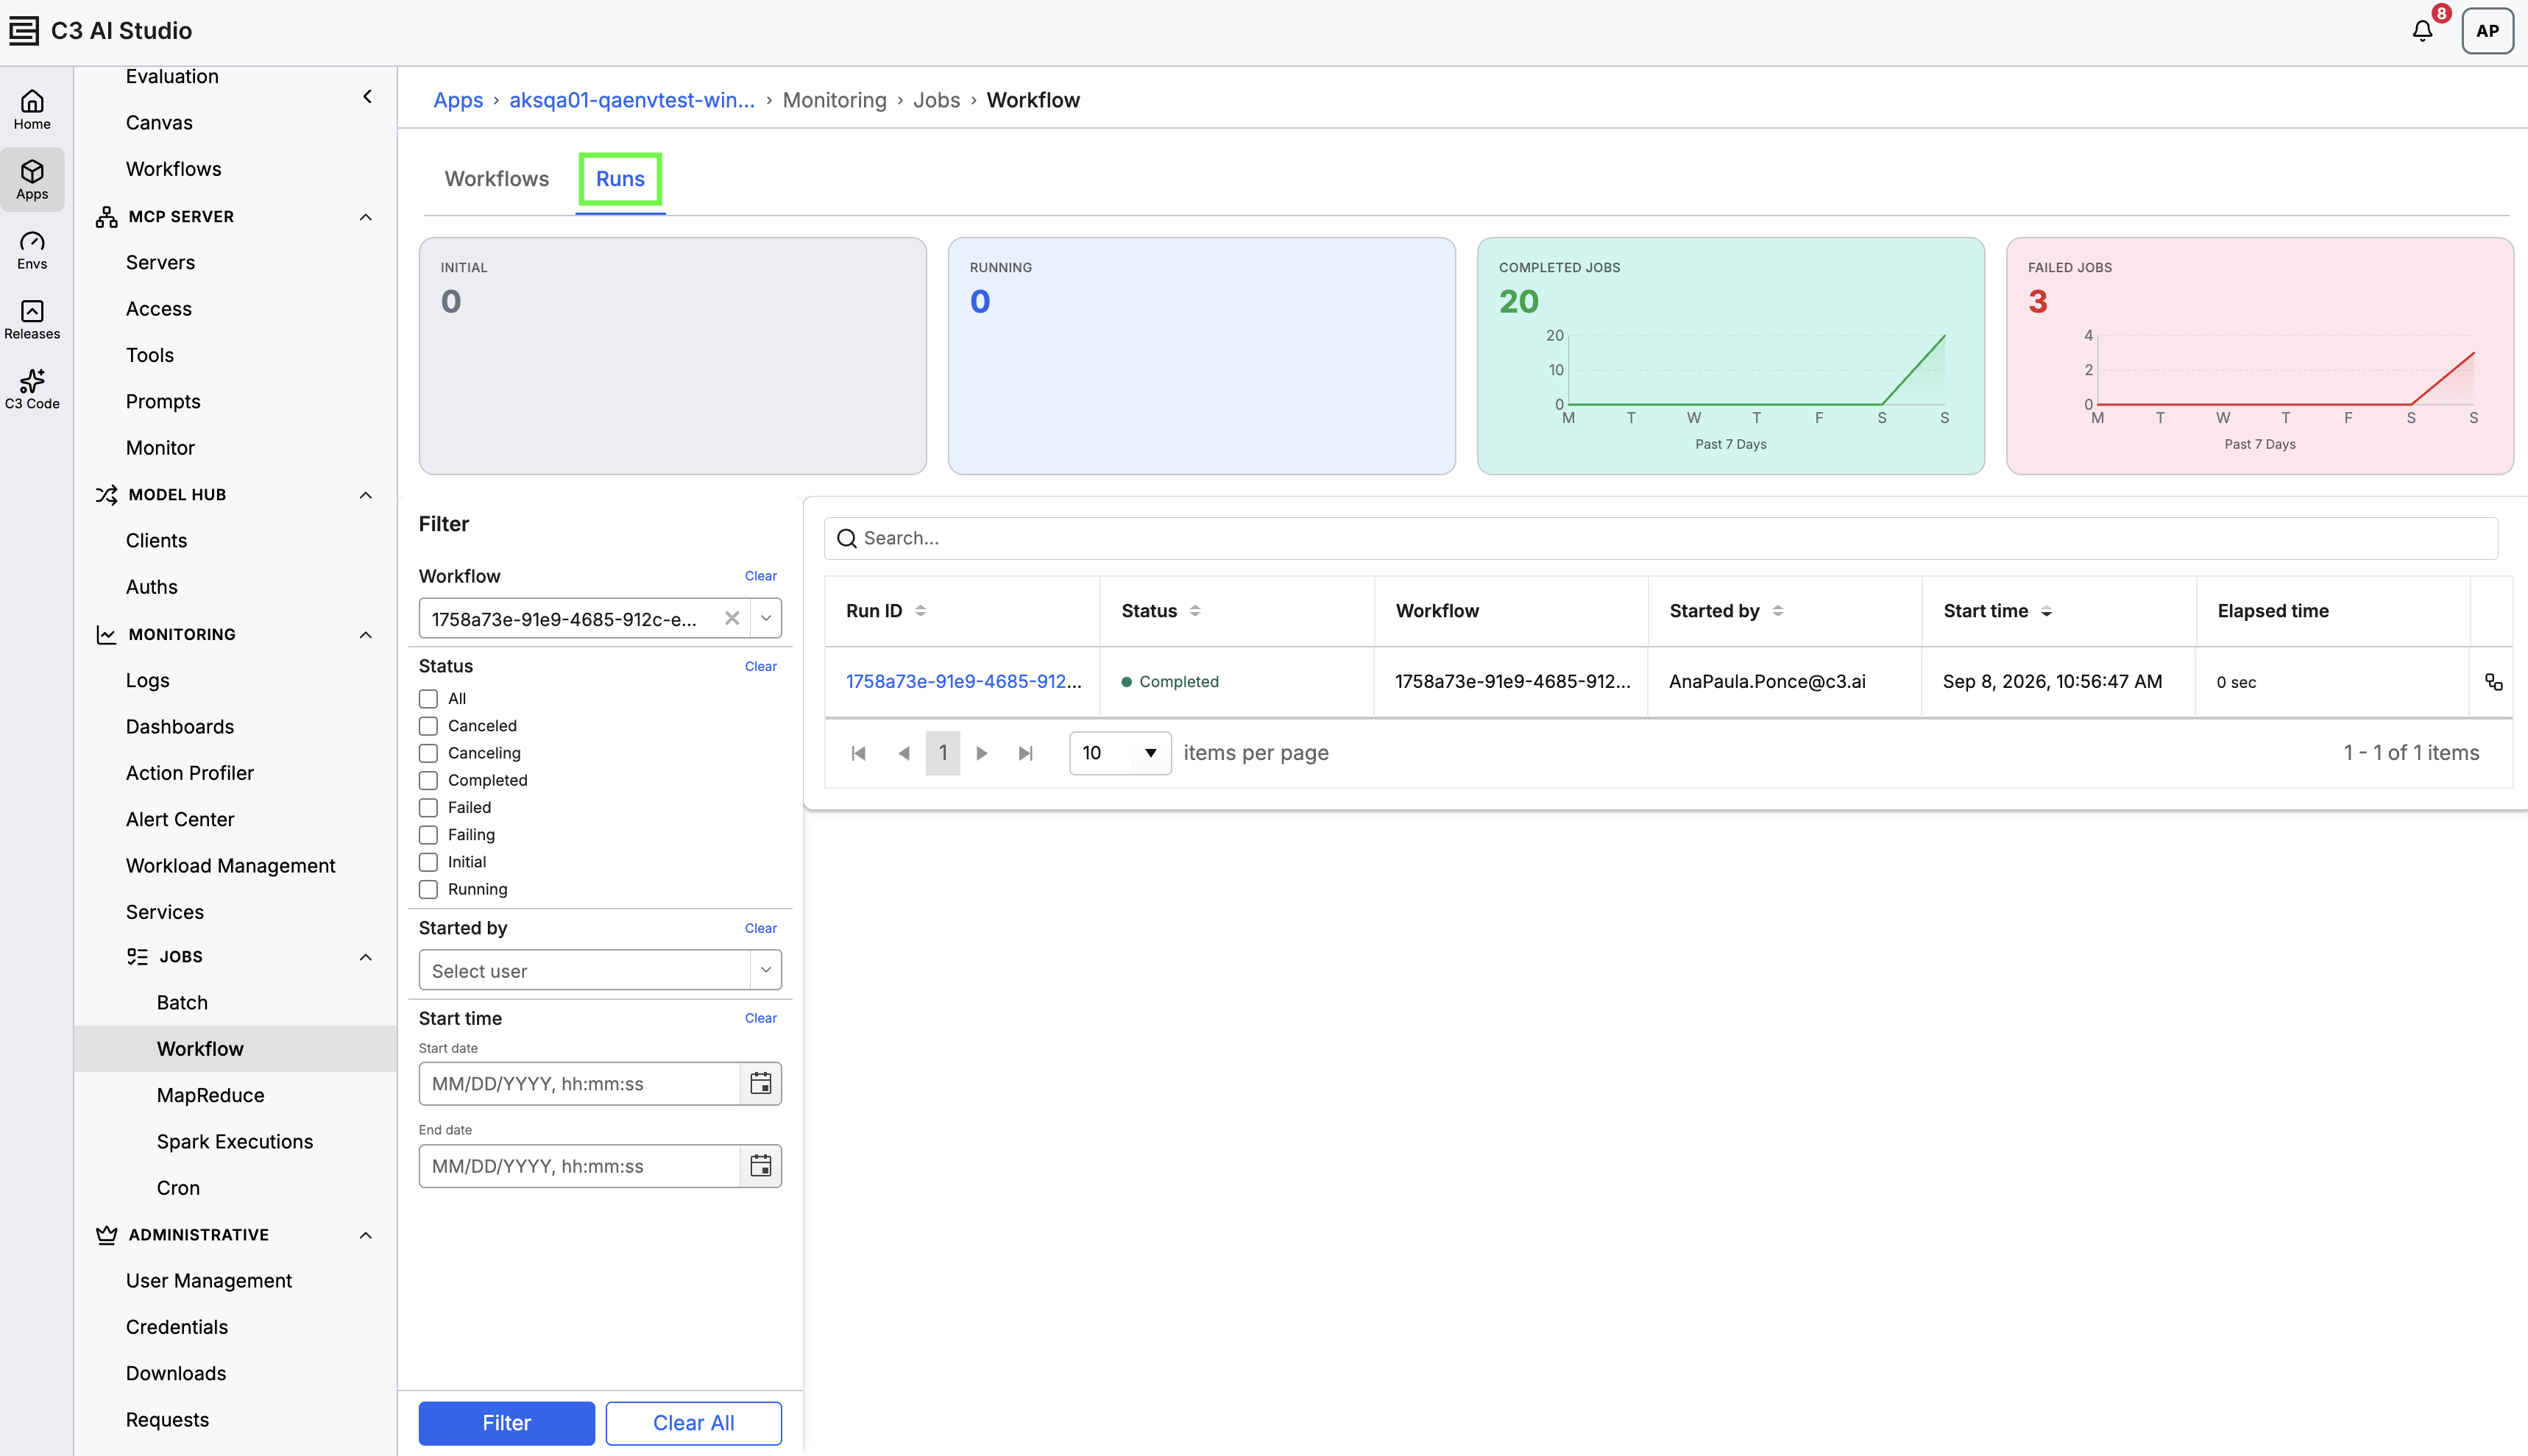
The Runs page provides you a list of all Workflow Runs performed within an App. This includes:
- Runs launched by the user
- Runs launched by CRON jobs
- Runs created as part of Nested Workflows (such as those created in MlPipelines)
The page consists of two sections:
- Overview Section - Provides the number of Initial, Running, Completed, and Failed Workflow runs
- Runs Table - Provides a table of the individual Workflow Runs within an app
The table provides you with seven columns that can be filtered or searched on:
| Column | Usage | Searchable |
|---|---|---|
| Run ID | The unique ID for a Workflow Run. Selecting the ID takes you to the Legacy Runs page. | ☑ |
| Status | The run status for the Workflow Run. The seven statuses for a run are: Canceled, Canceling, Completed, Failed, Failing, Initial, and Running. You can select specific statuses in the Status filter | ☑ |
| Workflow | The unique ID for the Workflow a Run is an instance of. The Workflow Filter allows you to specify specific Workflows. | ☑ |
| Started by | The initiator of the Workflow Run. This can a user of the App, eg. First.Last@c3.ai, or Workflow Runs started by the system, which appear as Worker. The Started by filter allows you to display Workflows by a selected author. | ☑ |
| Start Time | The date and time a Workflow Run was initialized at. The Start time and End time filters allow you to display Workflow Runs that were started during the specified time and date range. | ☒ |
| Elapsed Time | The duration of a Workflow Run. | ☒ |
The graph icon at the end of each row is the Visualize button. Select to enter the Graph View of the the selected Workflow Run.
 |
| Runs Tab |
Workflow Visualization Pages
Workflow Graph View
The Workflow Visualization Graph is a graphical representation of the Workflow Run's DAG. Each node represents a Vertex of the Workflow. On this page you see the following elements:
| Object | Usage |
|---|---|
| Node | A visual representation of a Workflow Vertex. Each Node contains the following information: <ul> <li>Vertex Name - The name of the Vertex. If the name overflows the Node, hover over the text to view the full name. Next to the Name is an icon representing the Vertex type</li> <li>Port - Inputs (left side of the Node) and Outputs (right side of the Node) of the Vertex. The Ports display the Port name specified by the Workflow author, as well as a stacked cylinder or radio icon to represent if the Port is a Data or Signal Port. </li> <li>Node Shape - In addition to Icons, each Node has a shape representing what Vertex it is. A rectangle with a semi-circle on the left is an input, a rectangle with a semi-circle on the right is an output, action vertices are rectangles, any vertex with a child Workflow has a stack of rectangles, and conditional vertices are rectangles with diagonals in their corners. </li> <li>Execution Status - The status of the Vertex displays in the top left of the Vertex</li> <li>Execution Duration - The duration of the Vertex displays in the top left of the Vertex, to the right of the Vertex's Status. Input and Output Vertices do not have execution durations. </li> </ul> |
| Legend | Find a collapsible legend in the lower left of the page. It lists the six statuses a Vertex can have (Successful, Running, Pending, Failed Upstream, Failed, and Canceled) as well as their respective Icons and Colors. The Legend also contains the icon type for the 13 Vertex types (such as Action, Input, etc.). |
| Run Selector | A dropdown menu containing the Run ID and the Run's Status. Select the dropdown icon to view and select other Run instances of the Workflow. |
| Breadcrumbs | A menu on top of the graph's canvas. The structure of the breadcrumb is App > Runs > Run ID. If you click into a Nested Workflow, the breadcrumb appends the Run ID of the Nested Workflow after the top level Run ID. Click into any of the Breadcrumbs to navigate to the respective page or Workflow. |
| Minimap | A display showing the graphical view of the Workflow Run, including zoom options. |
 |
| Workflow Graph Image |
Vertex Features
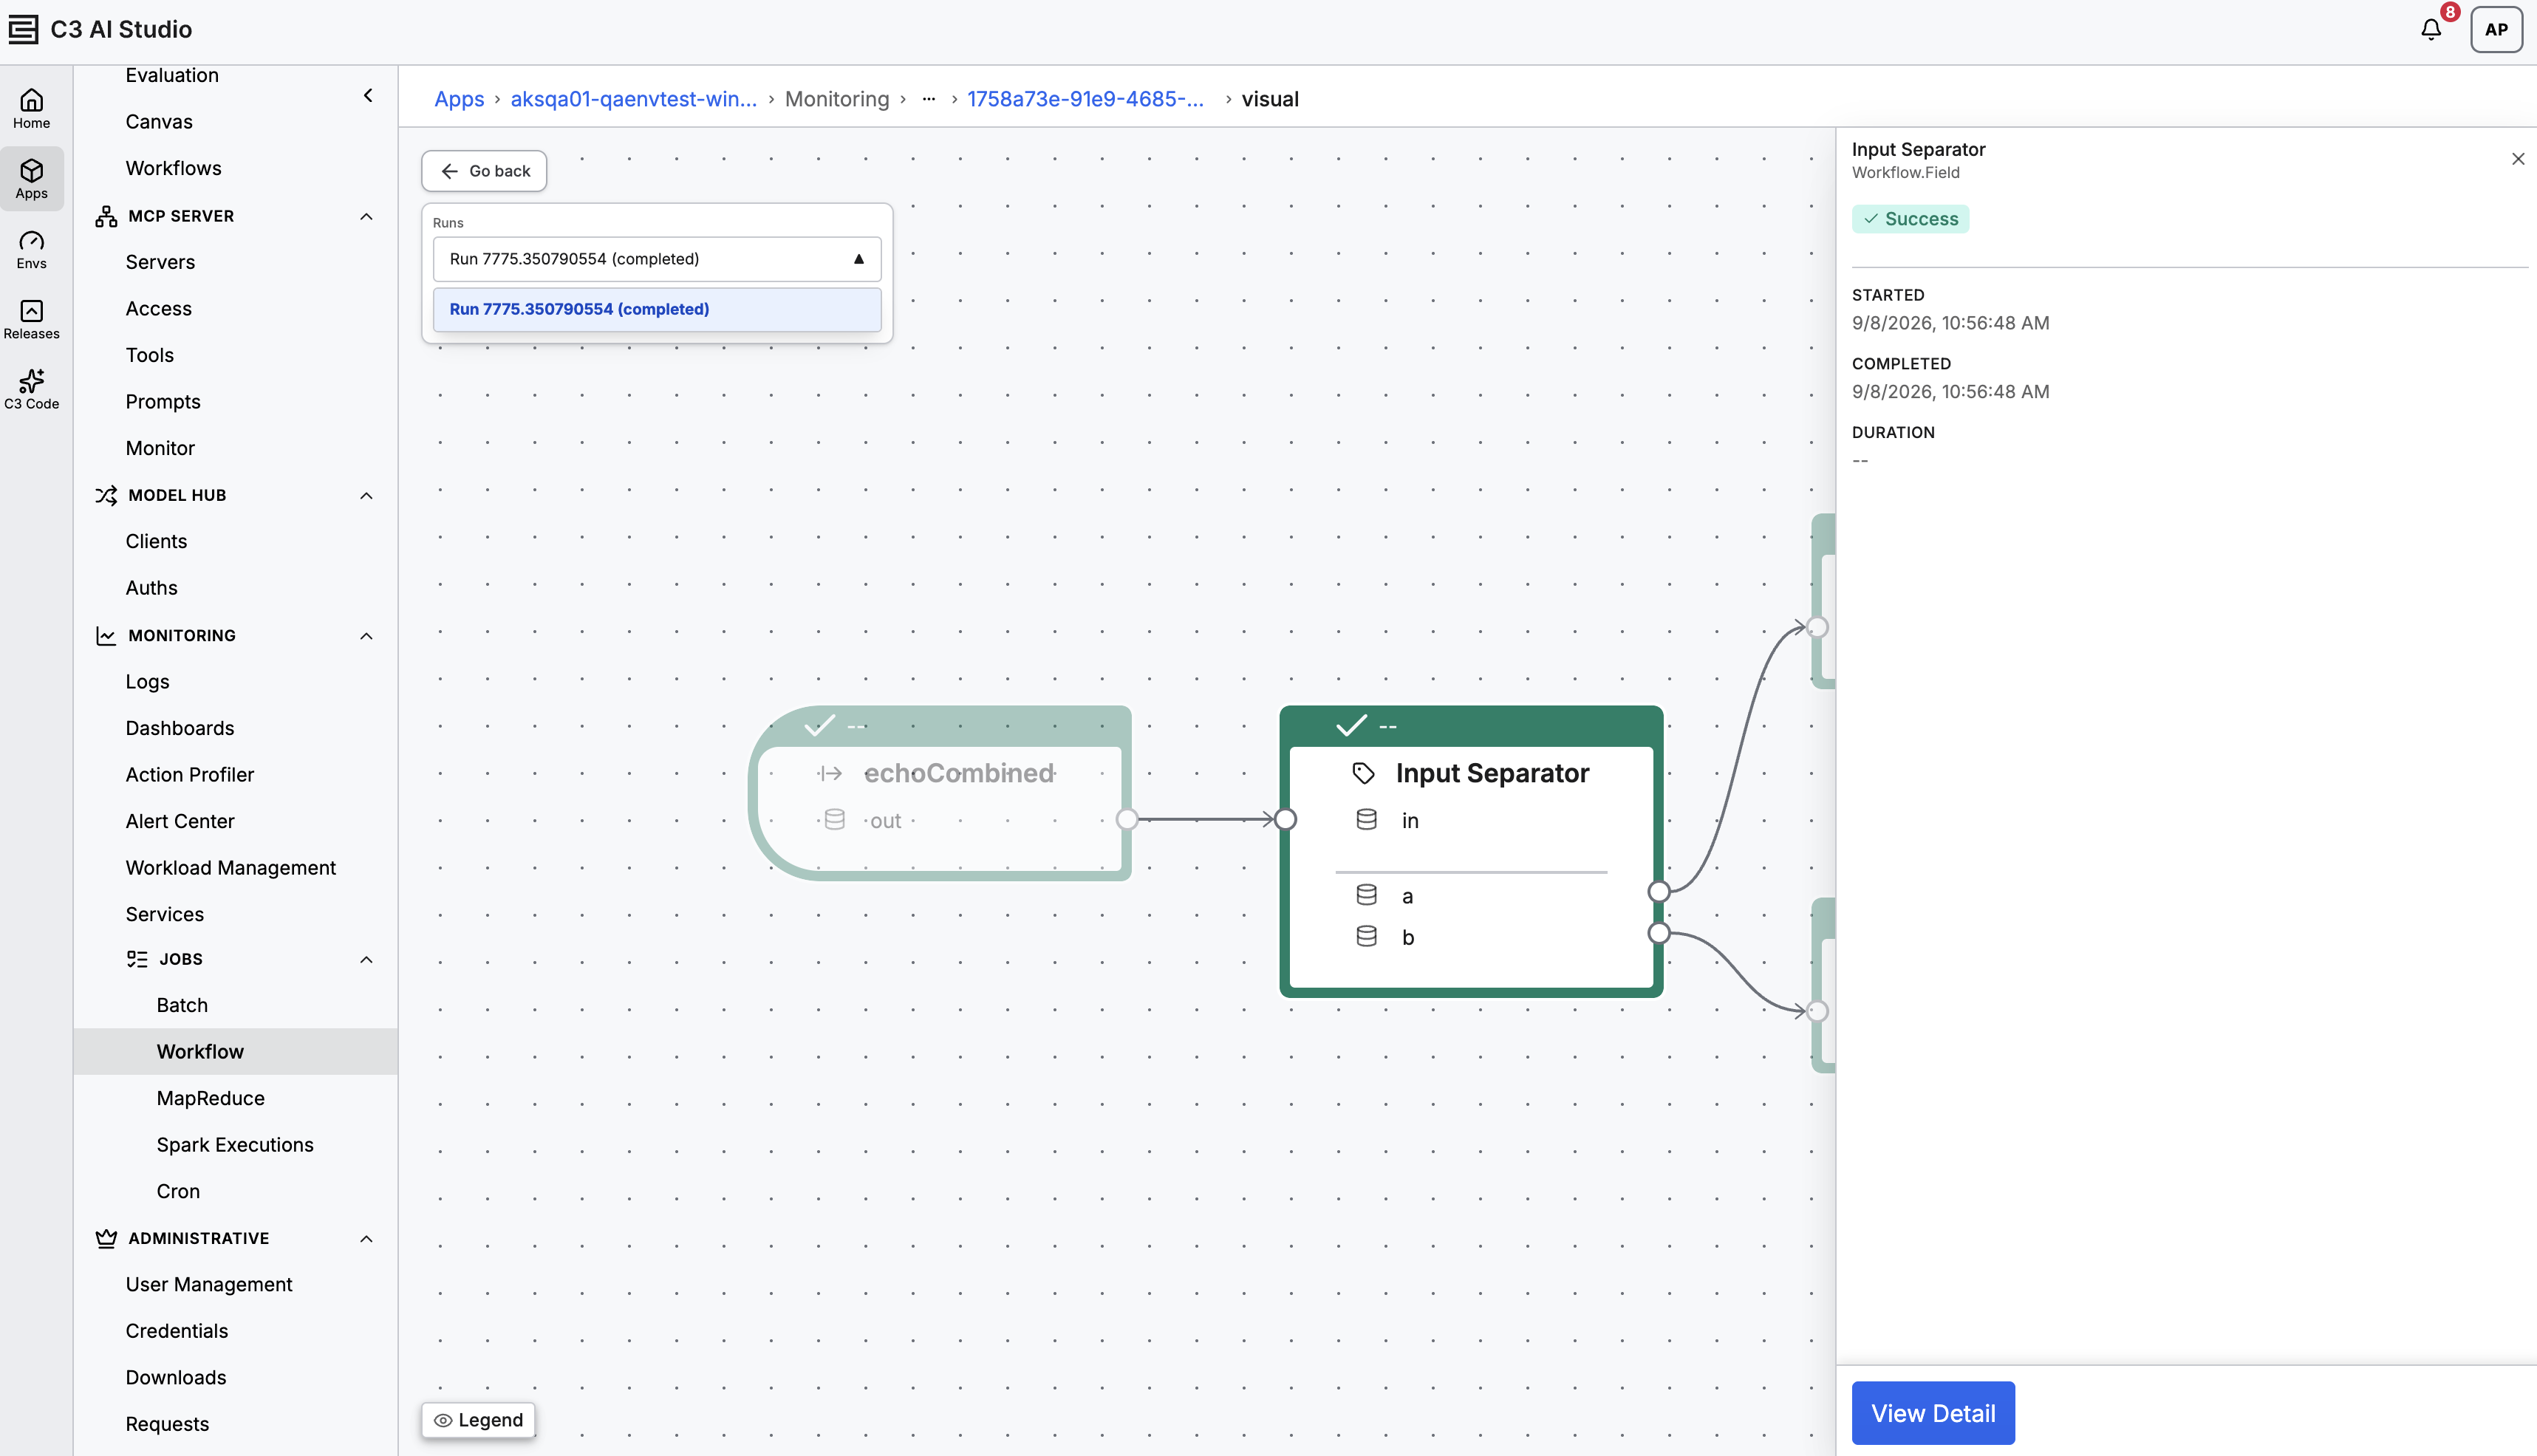
When you click on a Vertex, an Info Panel opens on the right hand side of the canvas. This panel contains a Vertex's Name, Vertex Type, Status, Started Time, Completed Time, Duration, and Error Log if any errors occurred.
 |
| Workflow Graph Side Panel |