Usage of Application Metrics Framework
Application Metrics Framework allows developers to report custom metrics from the C3 AI applications. This could be used to instrument code for observability or performance monitoring purposes.
This framework allows defining and recording metrics using the C3 AI Type System API that internally uses a time series database for storing metrics series.
The series could further be aggregated to build dashboards.
There are four meter Types:
App.Meter.Counter - A counter that monitors monotonically increasing values, such as the number of user requests.
App.Meter.Gauge - A gauge that monitors increasing and decreasing values.
App.Meter.Histogram - A histogram that tracks sample distribution of events.
App.Meter.TimeHistogram - A TimeHistogram is subset of Histogram which tracks a sample distribution of events for measurements of time.
You can follow the steps below to create metrics.
Step 1: Define meter metadata
Any Meter Type requires you to define Metadata that consists of common fields like the name of meter, a description, and tags you can use to identify unique metric series.
This example below shows how to place metadata in any package for Counter Meter Type. Metadata JSON follows the structure defined in a App.Meter.
metadata
   |-- App.Meter
     | -- CarCounter.json
Metadata JSON for CarCounter.
{
  "type" : "App.Meter.Counter",
  "name" : "CarCounter",
  "description" : "Test Car Counter",
  "tags": {
    "model": "honda",
    "make": null
  }
}Step 2. Usage of meter to generate metric series
After you define the metadata for the Meter Type, it is ready for collecting metrics. Each Meter Type has a unique way of recording metrics but has a similarity in tagging the unique series.
The Meter framework automatically populates the App.Meter.DefaultTagKey Cluster, Env, App, Package, and Node for each metric.
It is also possible to add user-defined tags by specifying the tags in the Metric's metadata. User-defined tags can have default values (if a non-null value is set in metadata).
Values for user-defined tags can be set on a per-observation basis, however set of tag keys should be fixed and defined in the metric's metadata.
Meter name: Every meter name should be a single word containing no spaces and no special characters, and prefixed by a package name when it appears in Grafana discussed below.
The following snippet shows how to collect measurements for each Meter Type.
tags = {
  "make": "accord"
};

App.Meter.Counter.forName("CarCounter").increment(1.0, tags);
In this example, the user-defined make tag was set to have the string accord, so the full list of tags assigned to this observation is:
{
  "model": "honda",
  "make": "accord"
}
You can pass a different set of tags for model and make to override values defined in metadata.
tags = {
  "model": "toyota",
  "make": "corrola"
};

App.Meter.Counter.forName("CarCounter").increment(2.0, tags);
Gauge only requires registering a meter, it's expression is evaluated at runtime to fetch measurement for set of tags.
To learn more about using expressions, see Use Expression Functions and ExpressionEngineFunction.
App.Meter.Gauge.forName("MyGague").register(tags);Histogram
App.Meter.Histogram.forName("MyHistogram").record(0.7, tags);TimeHistogram
App.Meter.TimeHistogram.forName("MyTimeHistogram").recordSeconds(Duration.fromSeconds(3.0), tags);
App.Meter.TimeHistogram.forName("MyTimeHistogram").recordMilliseconds(Duration.fromMillis(247), tags);increment, record are lightweight operations and could be used in time-sensitive code paths. Collected metrics are published in the background by the App.Meter Framework internally.
Note: This asynchronous publishing may cause up to a 60 second propagation delay between the actual event time and changes in the dashboard.
Step 3. Creation of Grafana dashboard
Once the APIs shown above begin generating metrics, it can be made available in Prometheus time series DB. Grafana can leverage those metrics to build dashboards. Grafana can be access for each cluster, <cluster_url>/grafana/.
Each metric follows this naming convention.<package-name>_<5char-hash-of-default-keys>_<meter-name>_<meter-specific-suffixes>
Example, platform_8b0ab_CarCounter_total or zoo_cd89b_myMeter_buckets
For exploration of this metric series in Grafana, you can go to Explore page and type meter name which shows a quick plot, all available tags and metric values.
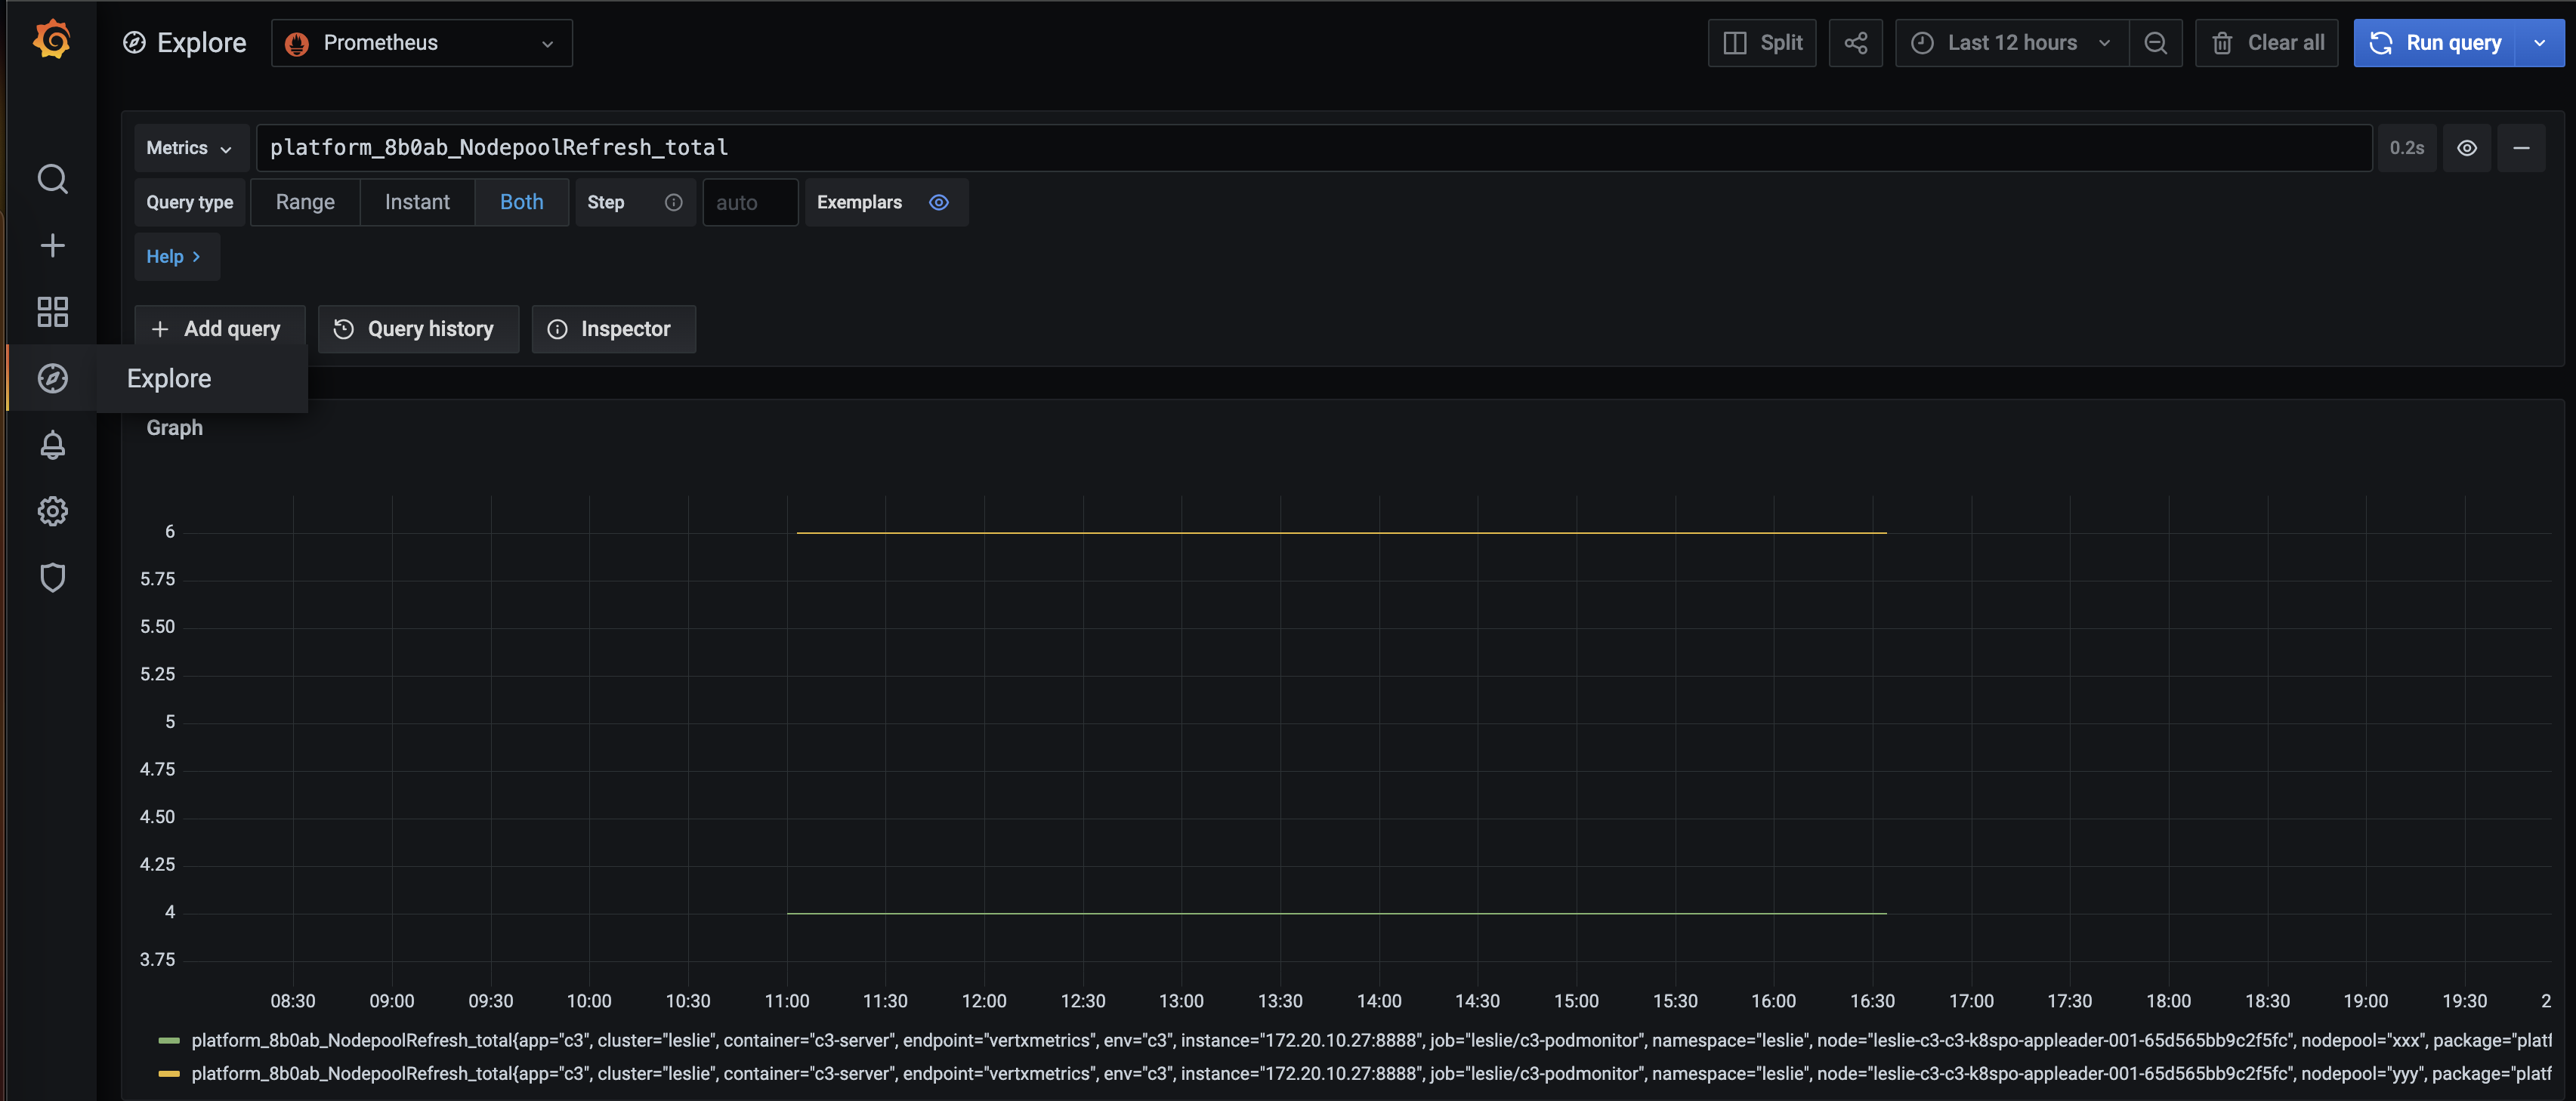
Check the Prometheus documentation to query (aggregation, filtering) these metrics stored in Prometheus, https://prometheus.io/docs/prometheus/latest/querying/examples/.
Use the following steps to build a dashbaord and seed it in the standard deployment:
- Go to Grafana Dashboards.
- Either pick an existing dashbaord or create a new folder/dashboard.
- Add new panels to the dashboard using these metrics.
- Download the JSON file of this dashboard.
- Seed the JSON template under
platform/cloud-k8s/src/main/helm/c3/templates