Visualizing Metrics
After you use metrics to create the data for the Timeseries Type, you can view the metrics using the C3 Console, Metric Designer, Data Explorer.
Metric results can be explored in two main forms using the browser console.
Tabular format
This is done by calling the command c3Grid() in the browser console. Note the data points are all displayed based on their value.
var spec = EvalMetricsSpec.make({
  ids: ["SMBLB1"],
  expressions: ["AverageTemperature", "AverageLumens"],
  start: "2013-01-01",
  end: "2013-03-01",
  interval: "DAY"
});
var result = SmartBulb.evalMetrics(spec);
c3Grid(result);
The result displays a hybrid view with a table and tree of the argument object.
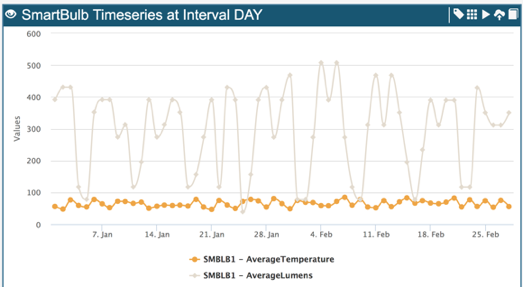
c3Viz()
The c3Viz console command can be used to visualize metrics (and all Timeseries for that matter). This can display a graph with the Timeseries plotted according to the date.
In the below example, both the AverageTemperature and the AverageLumens – 2 simple metrics, are plotted at the same point in time. These are also evaluated together in one evalMetrics call.
var spec = EvalMetricsSpec.make({
  ids: ["SMBLB1"],
  expressions: ["AverageTemperature", "AverageLumens"],
  start: "2013-01-01",
  end: "2013-03-01",
  interval: "DAY"
});
var result = SmartBulb.evalMetrics(spec);
c3Viz(result);