Gradient Boosted Tree Regression
Train a Gradient Boosted Machine (GBM) regression model that can predict continuous values in Visual Notebooks.
Configuration
| Field | Description |
|---|---|
| Name default=none | Name of the node A user-specified node name displayed in the workspace, both on the node and in the dataframe as a tab. |
| Select Column with Labels *Required | The column the GBM regressor should predict Select a column from the dropdown menu. This column contains the values that the model should be able to predict after training. |
Select Features
| Field | Description |
|---|---|
Select Features default=Select all columns as features, excluding the selected label column | Features to train the model with Use all columns as features, or select specific columns using the dropdown menu. Columns selected as features are used to train the model. |
Select optional timeseries column default=Off | Timeseries column If there is a timeseries column in your data, check the box in this field and select the timeseries column from the auto-populated dropdown menu. Timeseries information is used when splitting the data into separate train, validation, and test datasets. |
Test and Validation Settings
When training models, data is split into multiple components. The bulk of the data is used for training and validation, while a small portion is set aside for testing. The fields in this section determine what percentage of the data is used for training, how the data is used during the training process, and the strategy used to split the data.
| Field | Description |
|---|---|
Select test and validation method default=Train-validation-split | Test and train method Select Train-validation-split to split the dataset into separate train, validation, and test datasets. Select Cross-validation to split the data into a specified number of subsets. During training, one subgroup is used for testing and validation, while the other subgroups are used for training. The process is then repeated so each subgroup is used as the testing and validation group once. |
Select percentage split default=Train: 70%, Validation: 15%, Test: 15% | Data split percentage Move the slider to split the data into test, validation, and train datasets. If Cross-validation is selected in the Select test and validation method field, move the slider to split the data into a train dataset that will be divided into subgroups, and a separate testing dataset. The default split when using the cross-validation method is 80% train and 20% test. |
Select number of cross-validation folds default=6 | Number of cross-validation subgroups Enter a number between 2 and 20. The data allocated for training is divided into the specified number of subgroups. |
Prediction
The output of this node is each model's predictions on the training data. This section determines how the predictions are portrayed in the resulting dataframe.
| Field | Description |
|---|---|
Prediction Column Name default=prediction | The column name for the model's predictions Enter a name for the column that contains the selected model's predictions. Column names can contain alphanumeric characters and underscores, but cannot contain spaces. |
Dataset Selection default=Train Dataset | Data used to display a model's predictions Select one of the following options: all data, train dataset, validation dataset, or test dataset. Visual Notebooks displays a selected model's predictions on the dataset selected with this field. |
| Include all columns default=off | Whether to include all columns in the predictions table Select Toggle this to include all columns in the predictions table, including the columns that you did not use as features for the model. By default, only columns you selected as features will be included. |
Node Inputs/Outputs
| Input | A Visual Notebooks dataframe |
|---|---|
| Output | A dataframe with predictions on the training data |
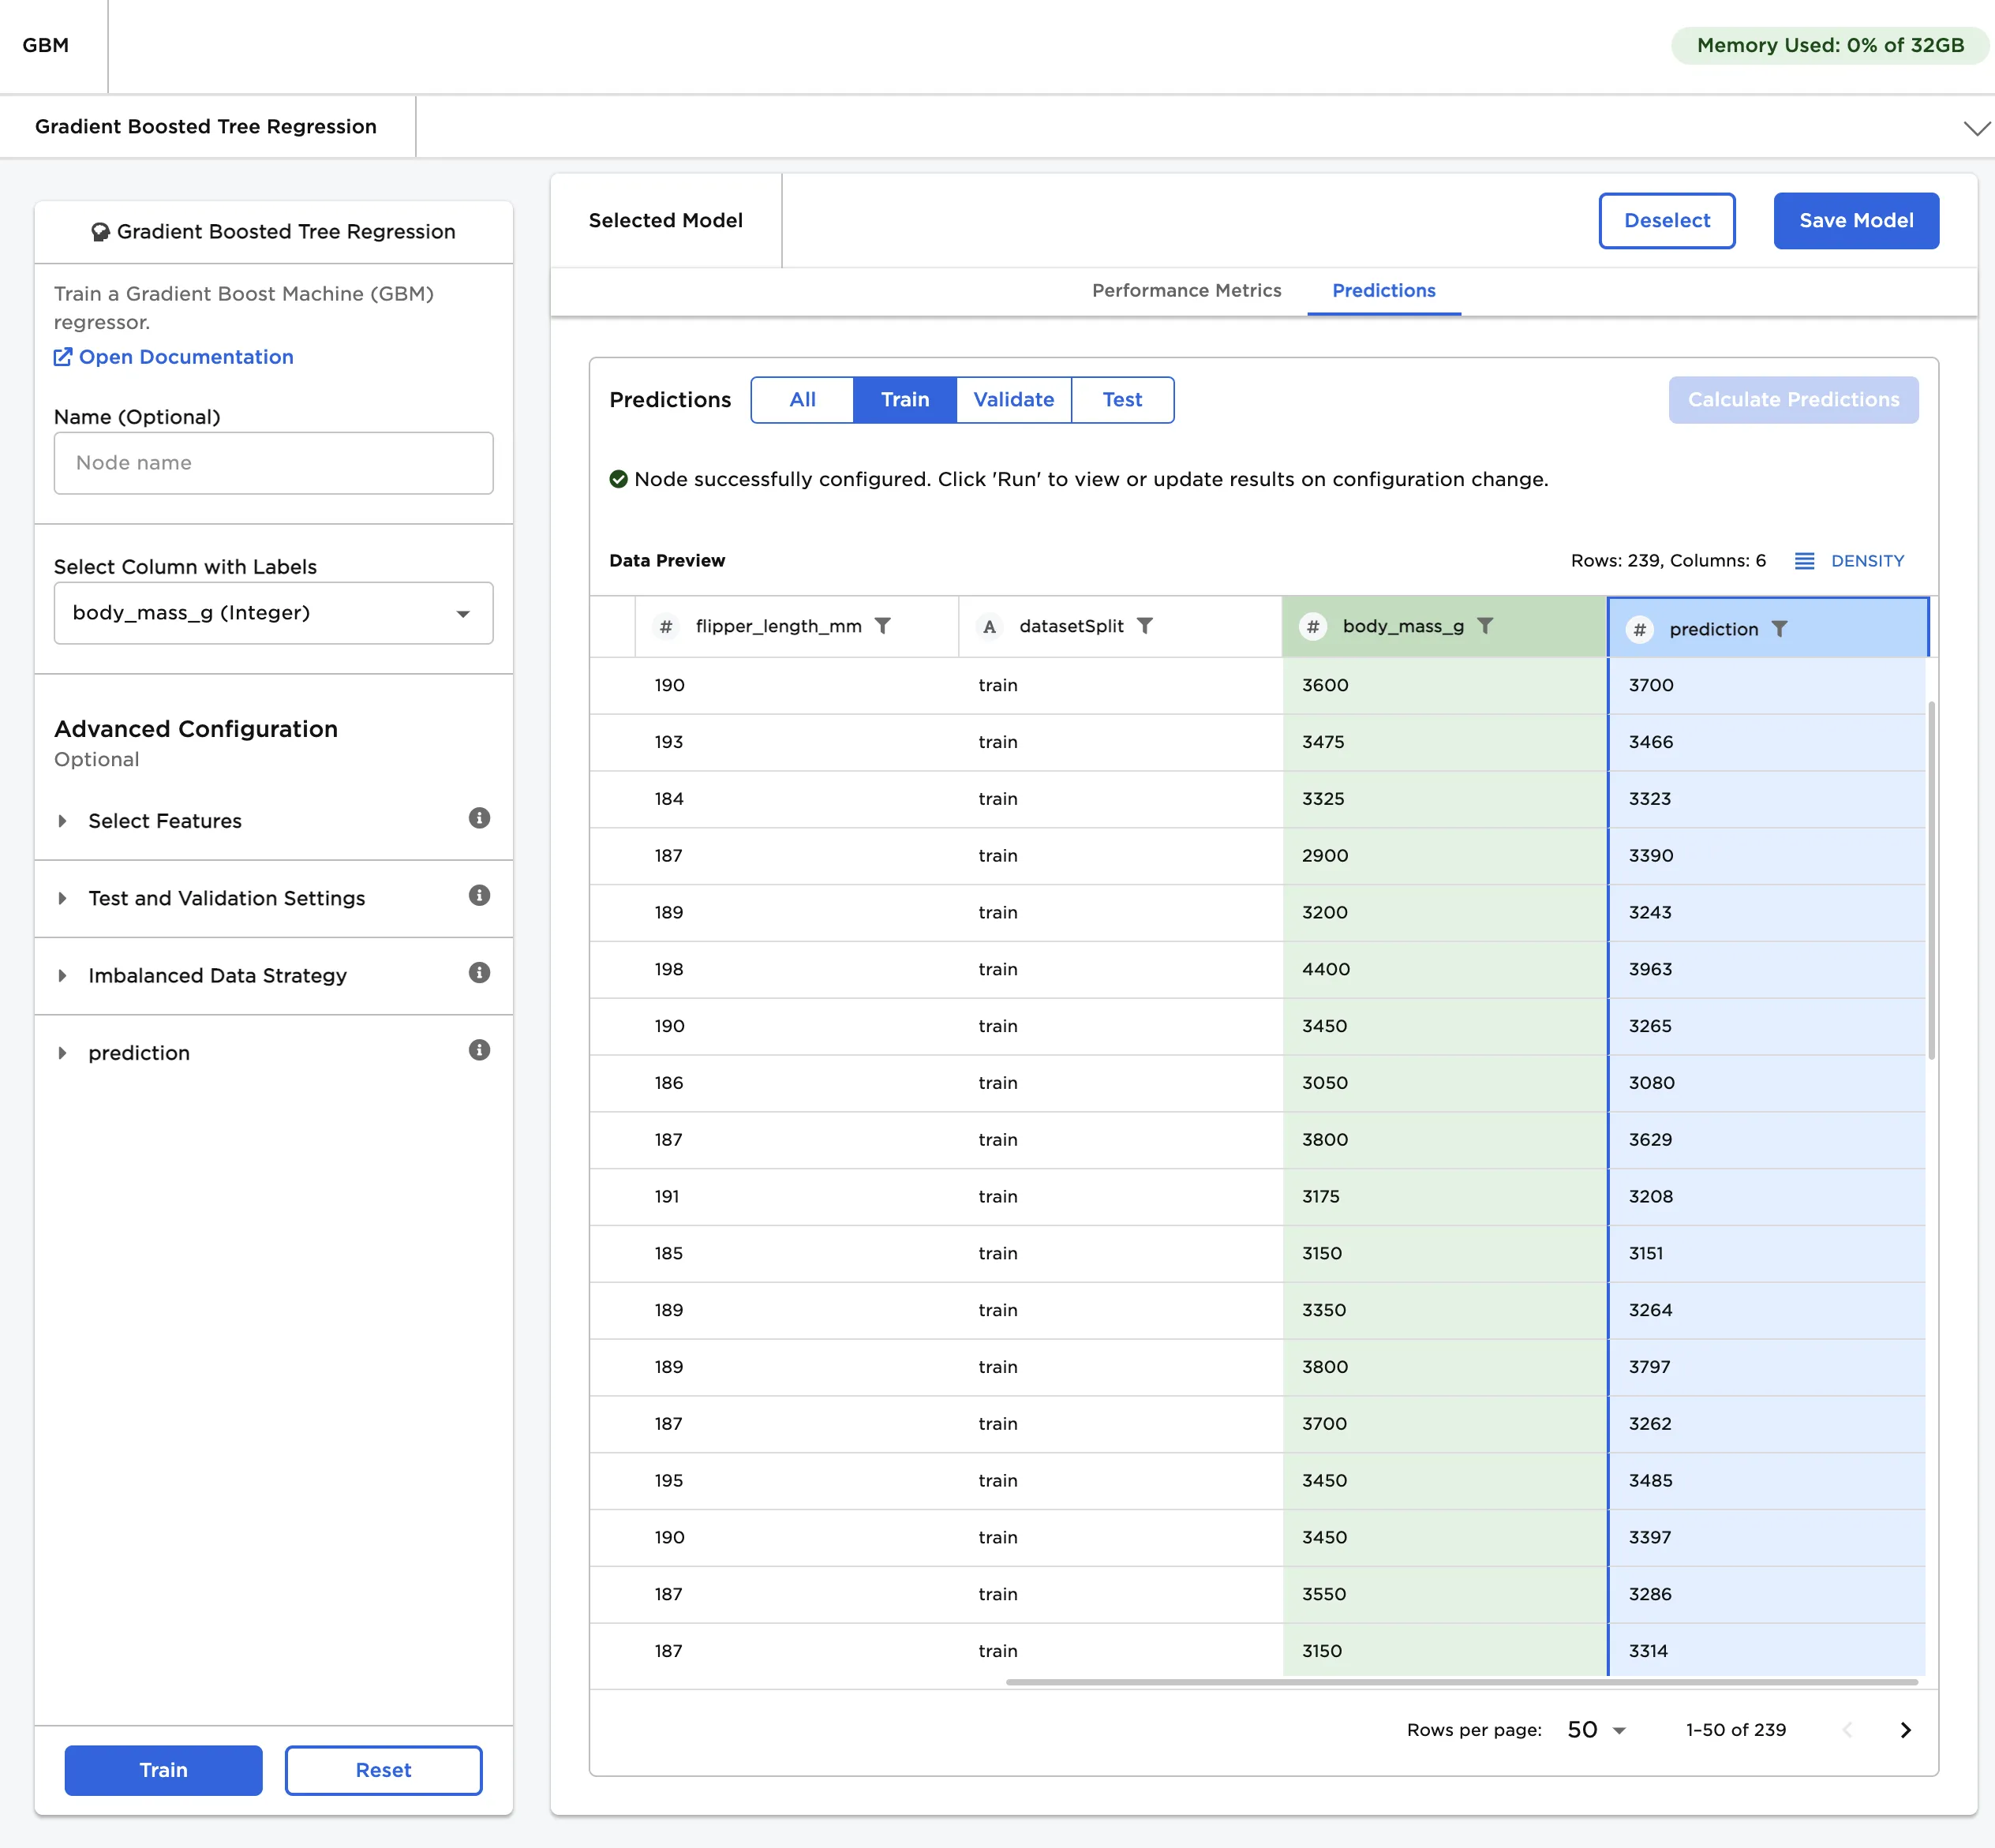
Figure 1: Example output
Examples
The dataframe shown below is used in this example. It contains identifying characteristics of over 300 penguins. This data is used to train a model that can predict a penguin's body mass given its bill length, bill depth, and flipper length.
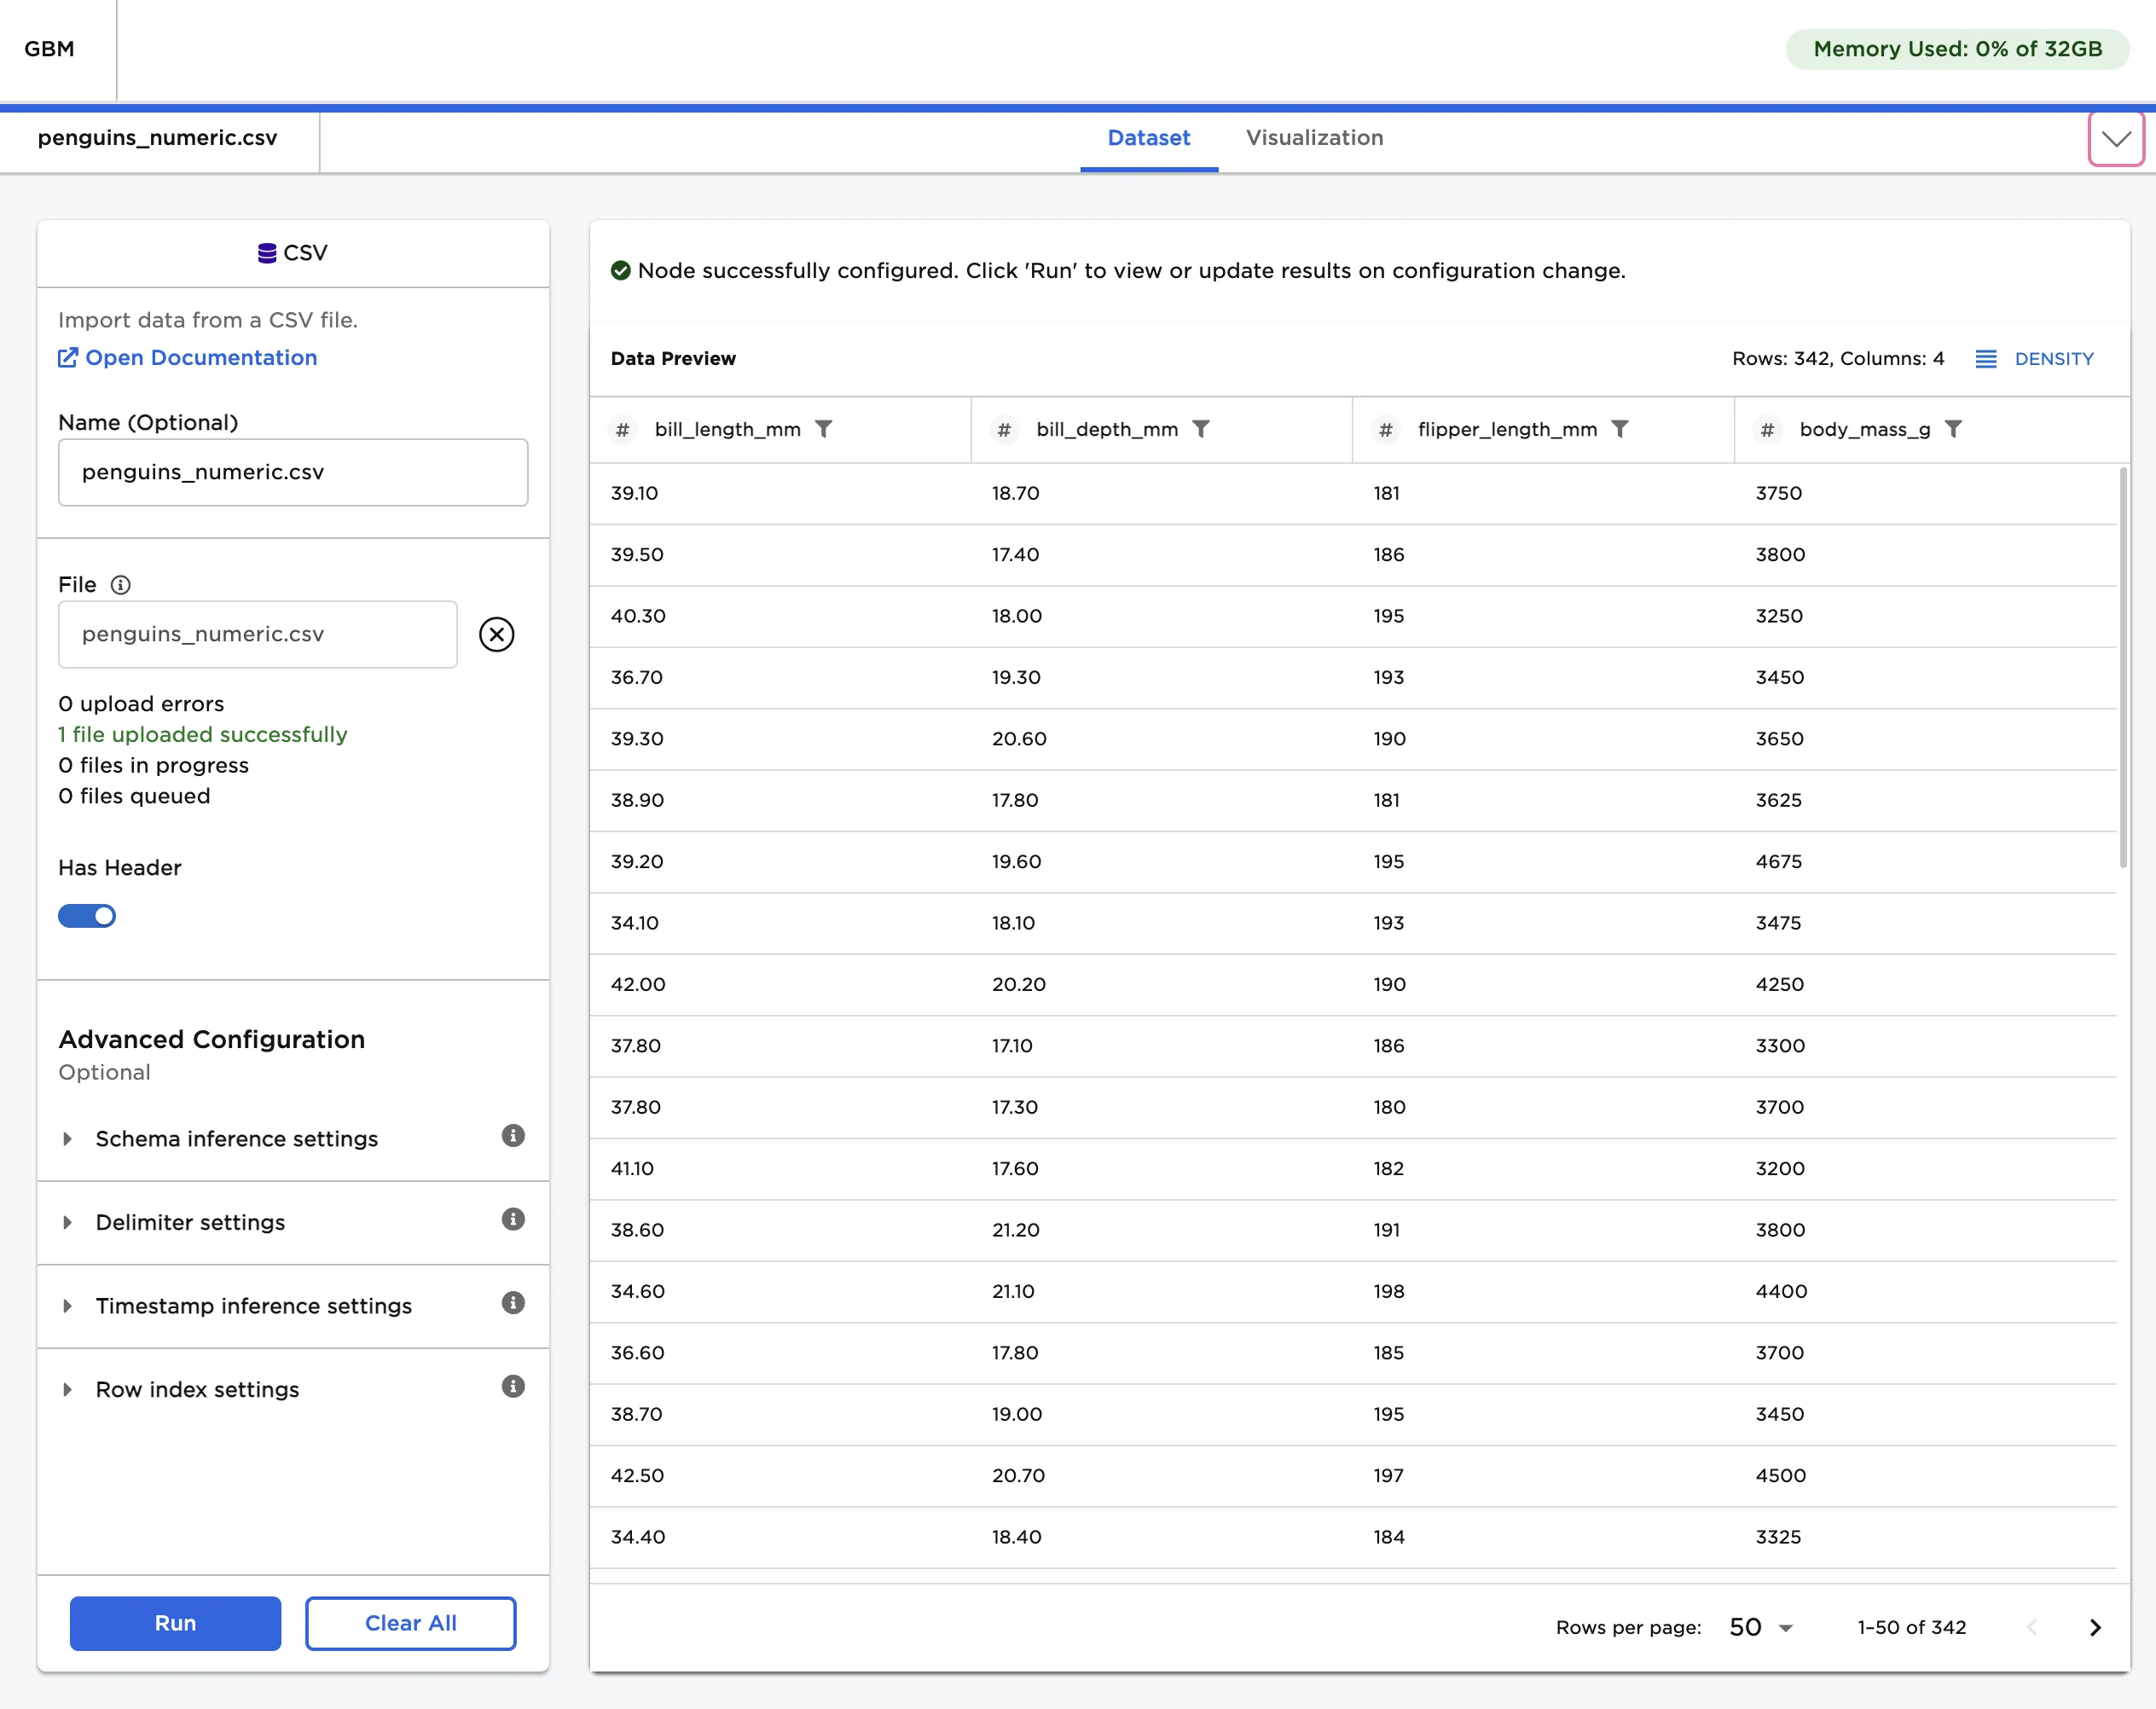
Figure 2: Example input data
- Connect a Gradient Boosted Tree Regression node to an existing node.
- Select body_mass_g (Integer) for the Select Column with Labels field. The model should be able to predict the values in this column after training.
- Select Train to train a model with the default settings.
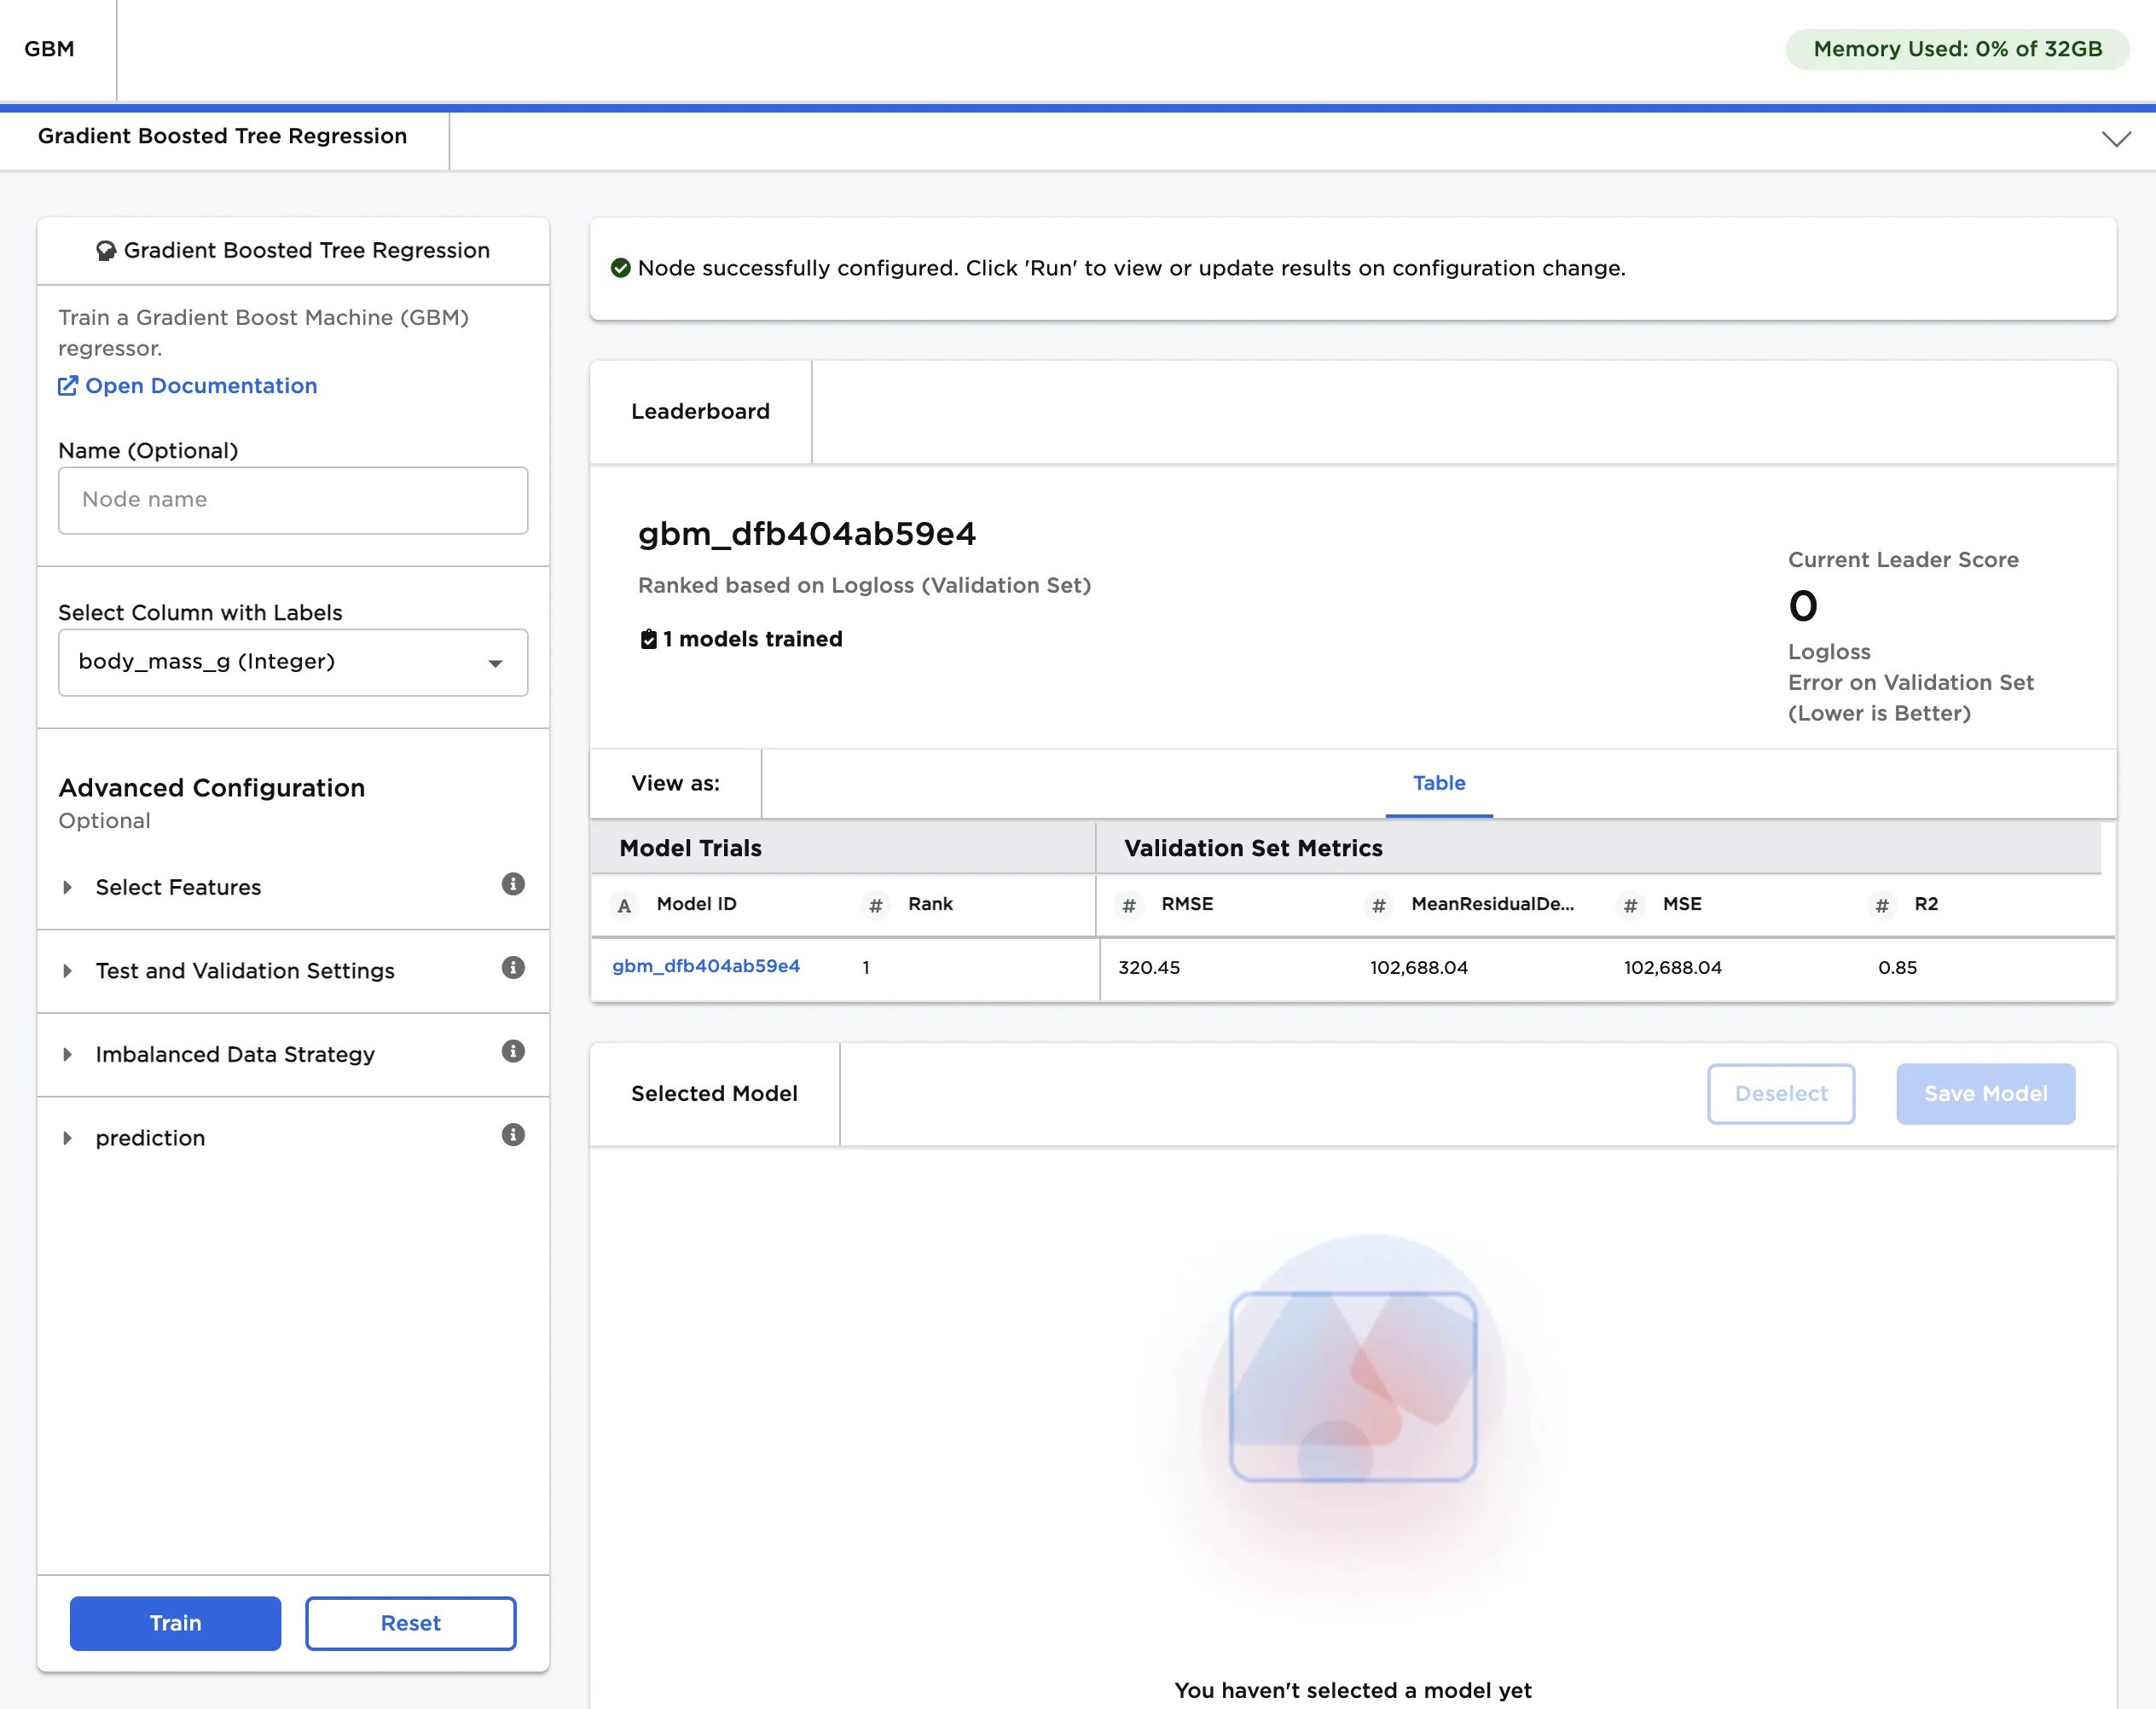
Figure 3: Trained model
- Select the trained model, then scroll down to view information about the model and a bar chart with the importance of each feature.
- Select Calculate Additional Details to view additional test metrics and a scalar regression chart. The button appears dimmed after it has been selected. For more information about test metrics, see the C3 AI Visual Notebooks User Guide.
The scalar regression chart shows the model's predictions as a gray line. The actual values are displayed as blue dots. Although the model in Figure 4 does not accurately predict all values, it successfully captures the general trend of the data.
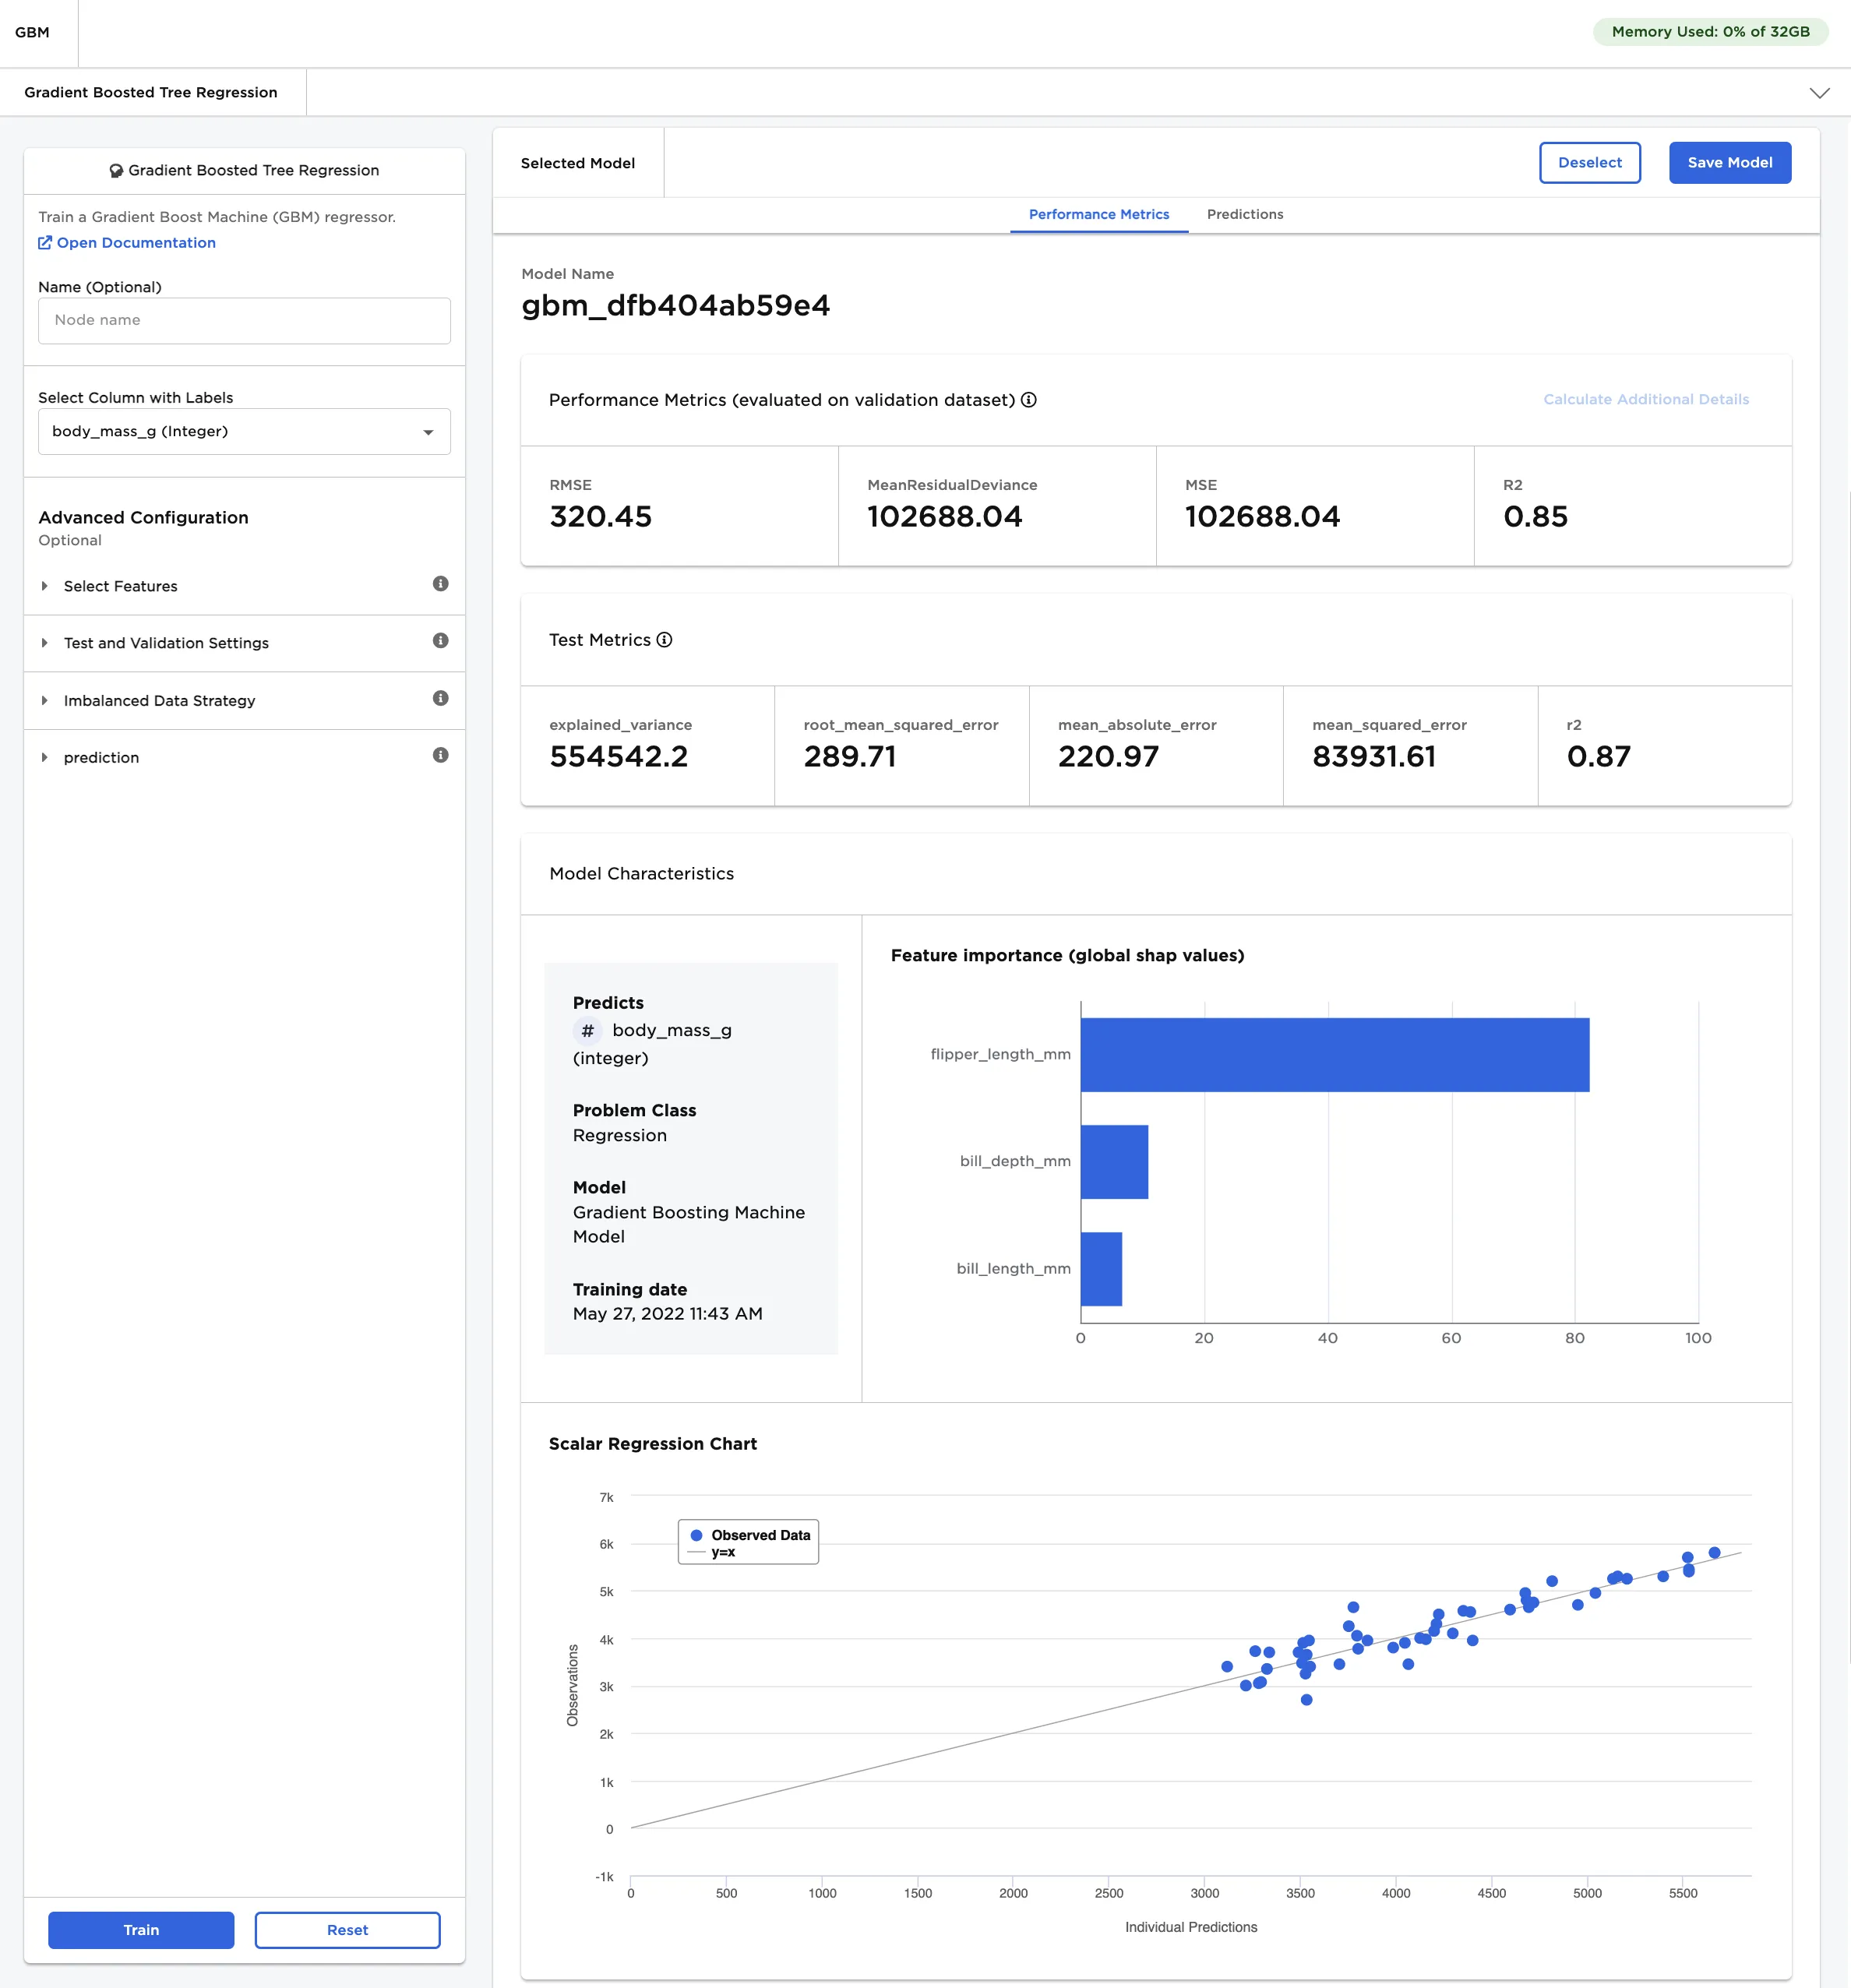
Figure 4: Model details
- Navigate to the Predictions tab.
- Select Calculate Predictions to view the model's predictions on the training data. The button appears dimmed after it has been selected.
If the leading model doesn't perform as well as you'd like it to, try altering the advanced configuration options and training new models.
Note that if your model correctly predicts all values, it might be overfit. In other words, the model may be too closely aligned to the training data to make accurate predictions on unseen data. Try using a different AutoML node.
Figure 5: The model's predictions