Use a step-by-step debugger to troubleshoot your transforms
Use a debugger when you need to inspect values inside a transform or transformArgs function. Breakpoints let you pause execution, view live variables, and step through the code.
Step 1: Write your transform
Start by creating a transform or transformArgs function. If you need help, see these topics:
Step 2: Bundle your app
Before debugging, make sure you bundle your application using the bundler in VS Code. The debugger won't find your code unless you build the app first.
Step 3: Set breakpoints in your browser
- Open your browser’s DevTools.
- Navigate to the Sources panel.
- Search for your TypeScript file that implements your transform logic.
- Set a breakpoint on the line you want to inspect.
This screenshot shows a paused breakpoint inside a transformArgs function, with variables in scope.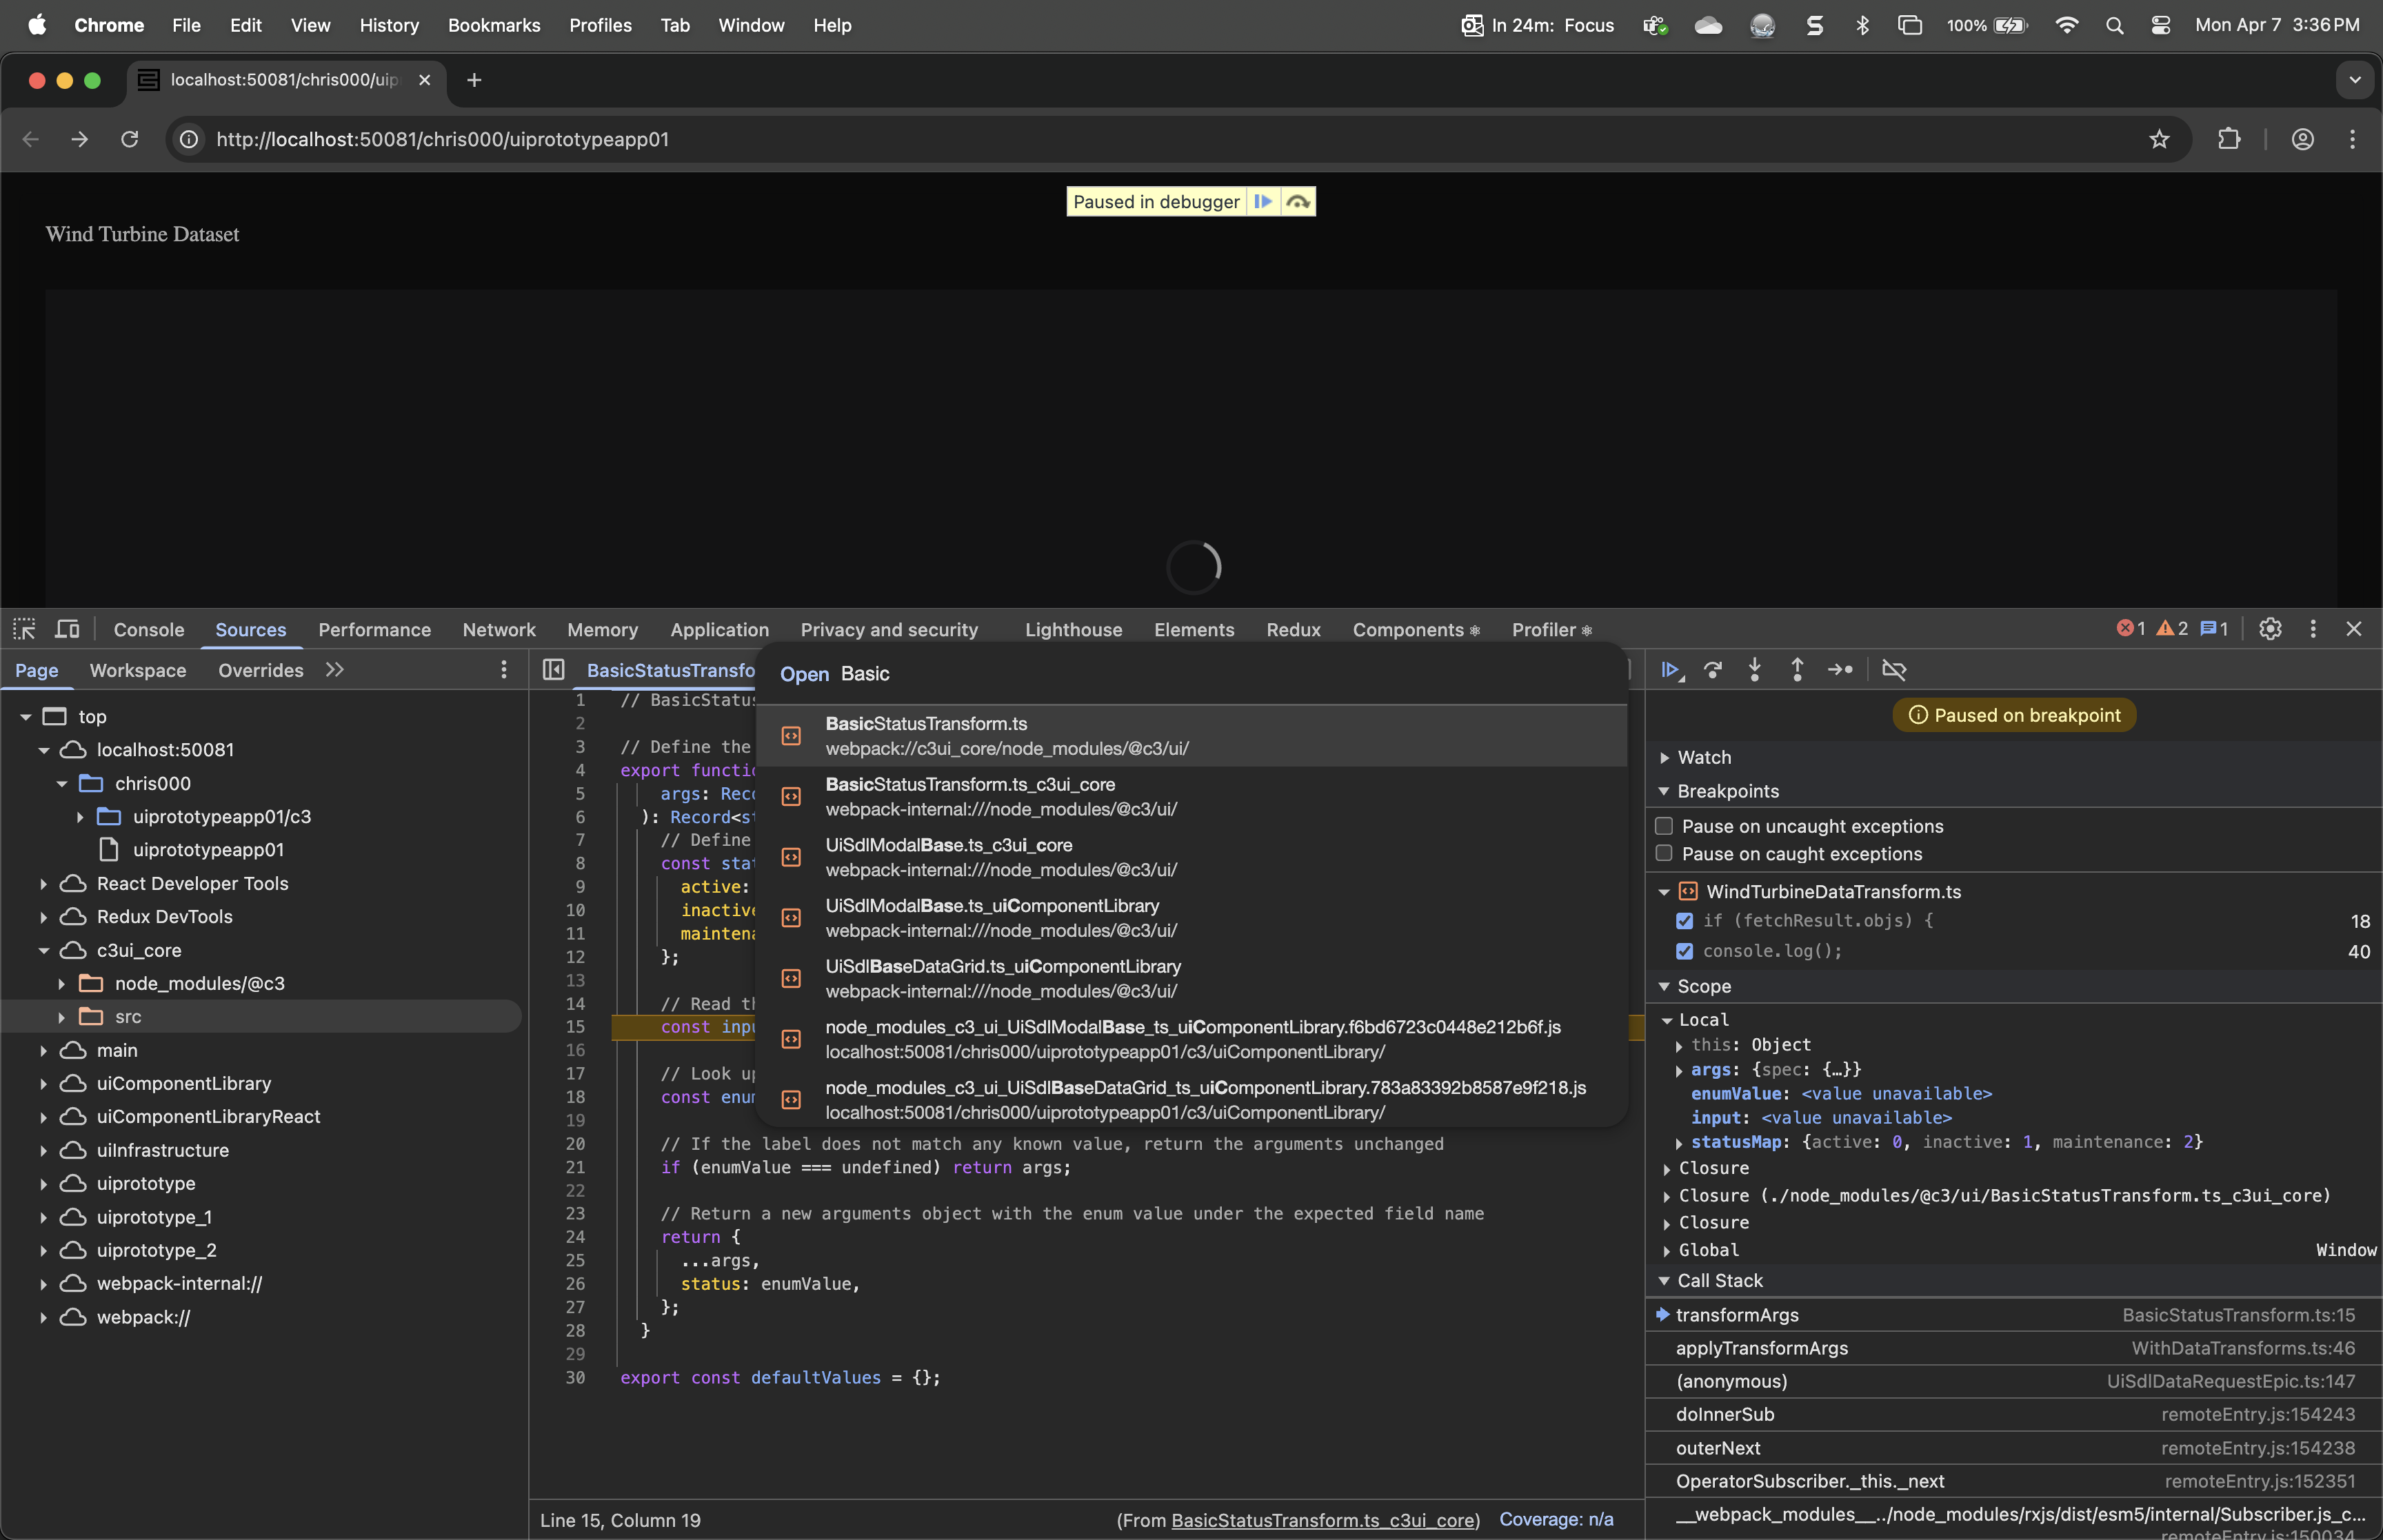
That’s it
Once you hit a breakpoint, use the debugger to inspect arguments, view local variables, and trace execution.