Debug and Profile
This section covers debugging and profiling your user interface.
Prerequisites:
- A user interface that you've created with C3 AI UI Stack.
Use these debugging tools and extensions
Chrome DevTools and the React and Redux extensions are the tools used to debug the C3 AI UI Stack. These debugging tools and extensions provide helpful debugging information. Familiarize yourself with the following tools and install the extensions to follow along with the next sections.
Chrome DevTools:
- Open Chrome DevTools
- Console overview
- Sources panel overview
- View, edit, and delete cookies
- Analyze runtime performance
React and Redux extensions:
Inspect the component instance source code
The component instance's source code is the first place to inspect to see if issues are related to incorrect component configuration or code generation.
In your package, under the ui/c3/meta folder, the component instances configured through the JSON files translate into TypeScript React code, the "source code".
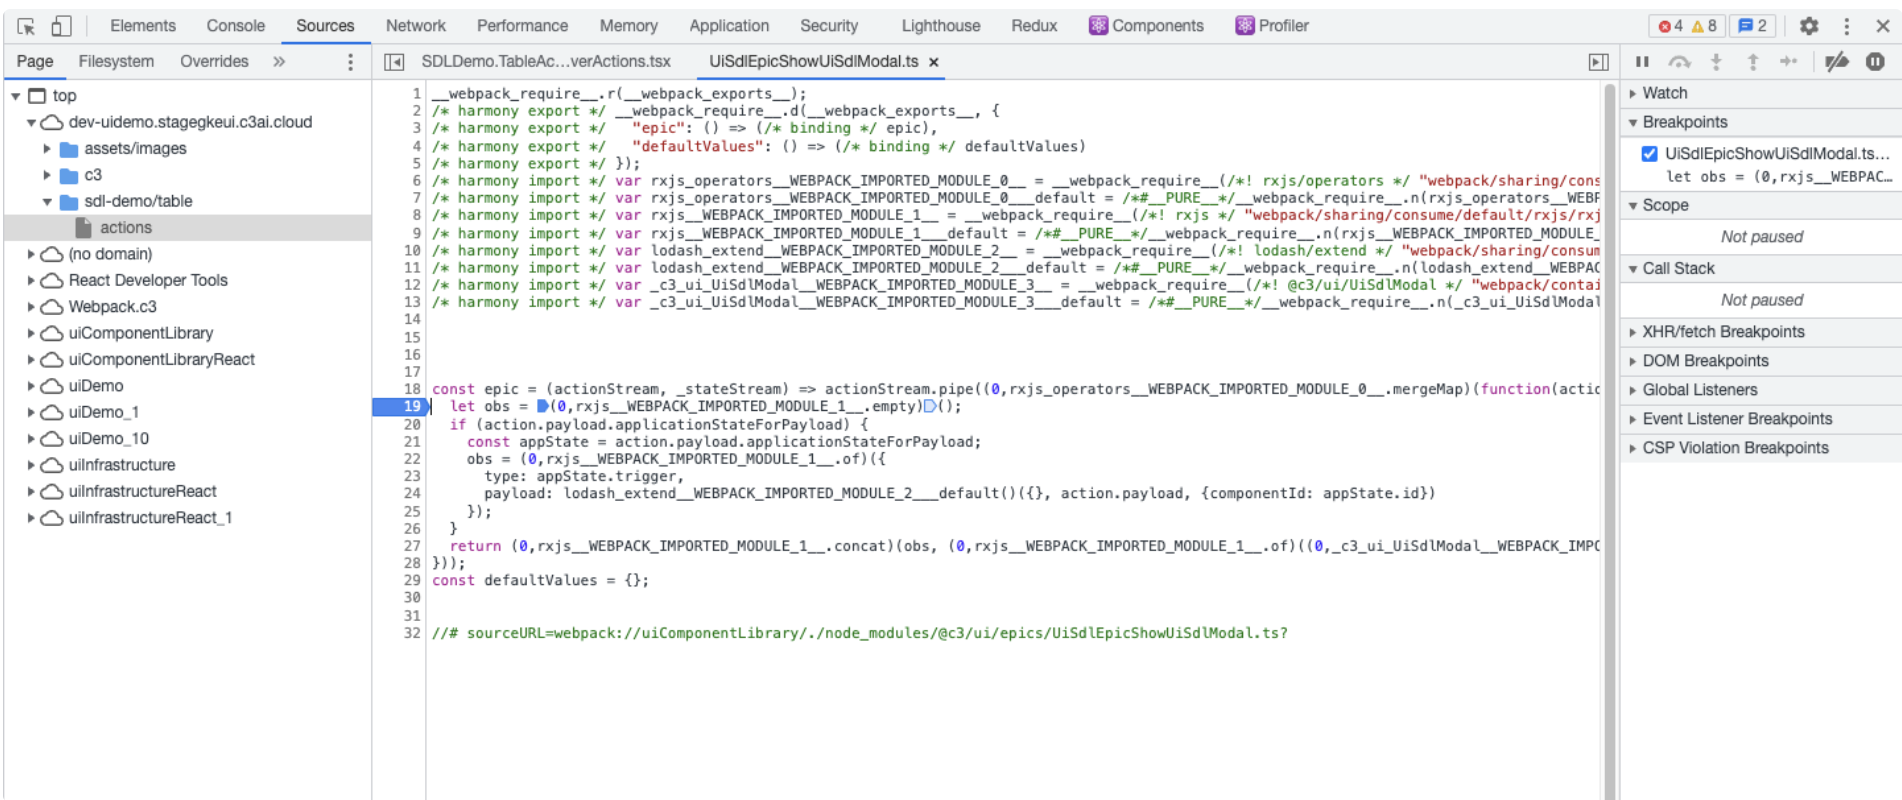
To inspect the source code:
- Navigate to the Sources panel in Chrome DevTools.
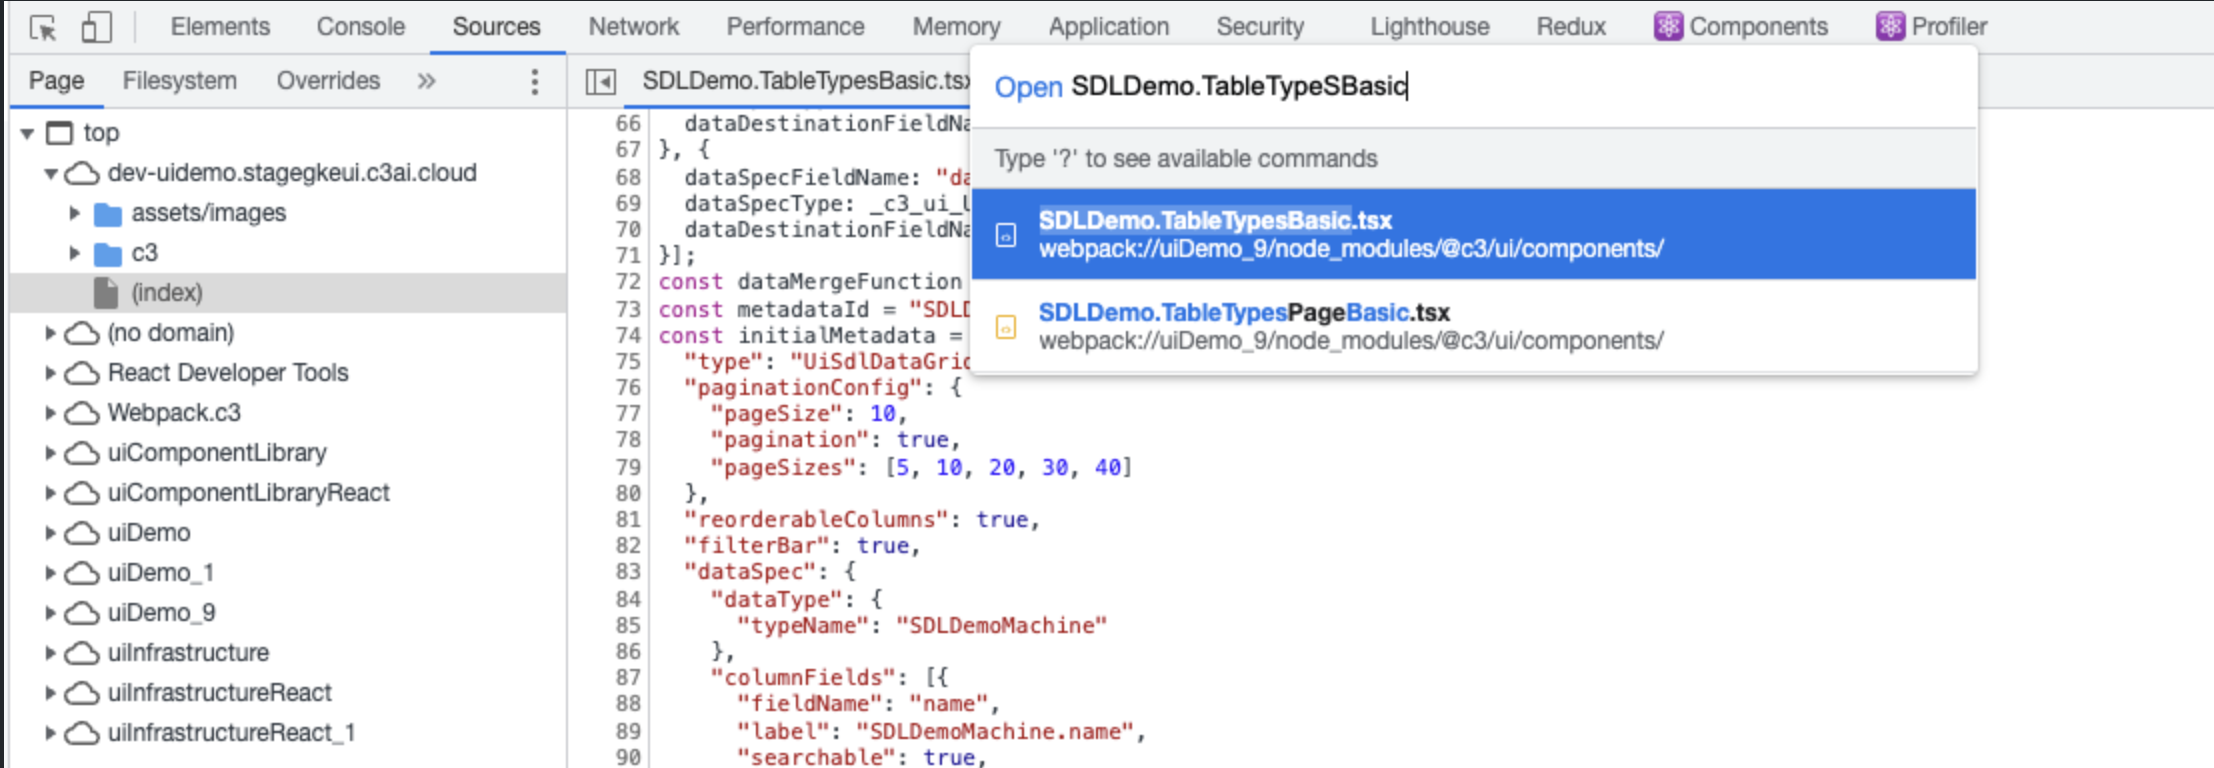
- Enter the JSON file name (without the extension) for the component that you want to troubleshoot.
- Select the corresponding TSX file.
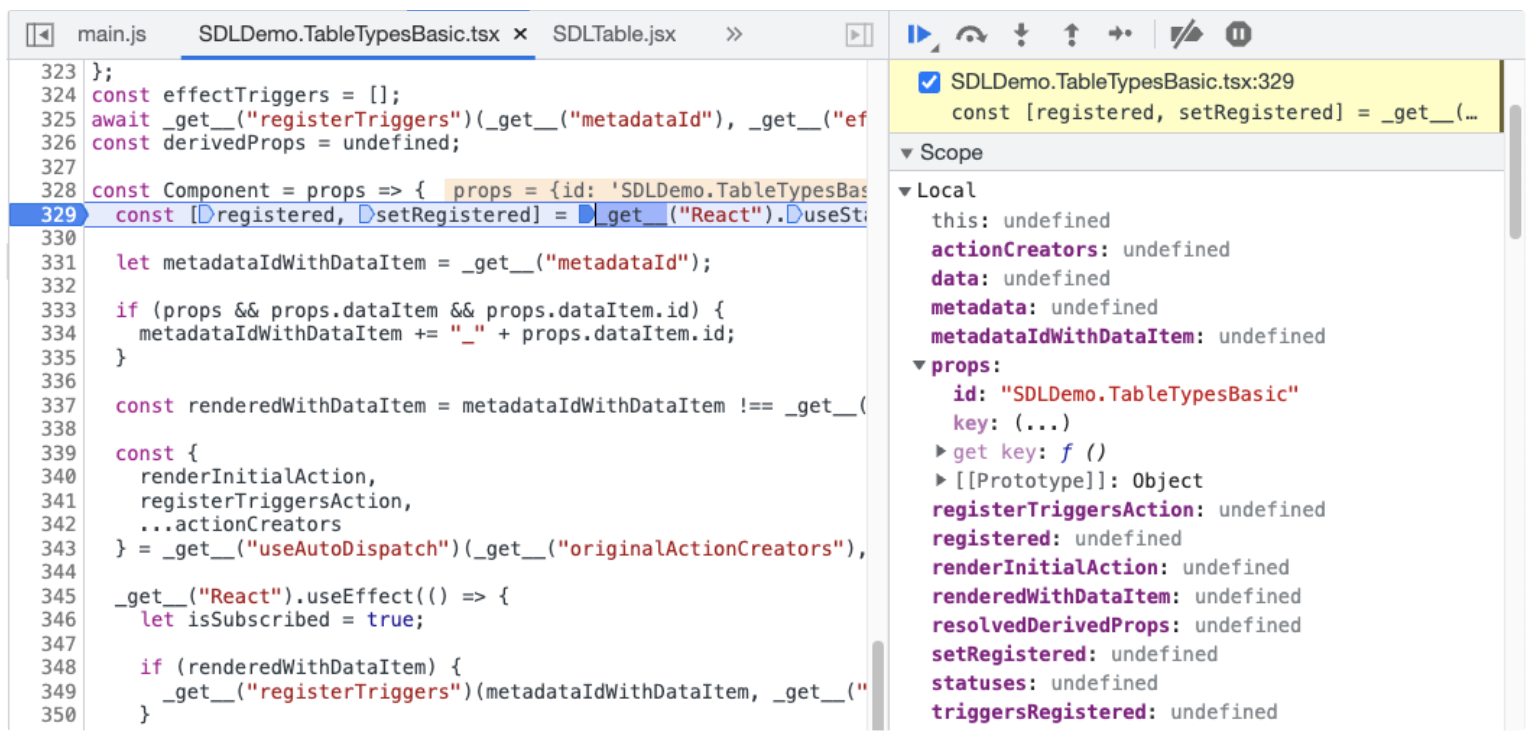
- Set breakpoints. The best place to set a breakpoint is the first line of the component function. This allows you to see the result of every property that is passed in.
- Inspect the variables, key/values pairs, and source code.
Cannot find the TSX file
The previous example image shows the Sources panel in the Chrome DevTools when you enter the JSON file name SDLDemo.TableTypesBasic and select the TSX file. If there is no corresponding TSX file, these can be the following reasons:
- If you do not see any file(s) with the same JSON filename, you might be debugging a production build that is not supported.
- If you see a list of similar files, you might have multiple source maps that provide source code with changed names. JSX files appear this way. In this situation, choose the file containing the additional fingerprint after the
?.
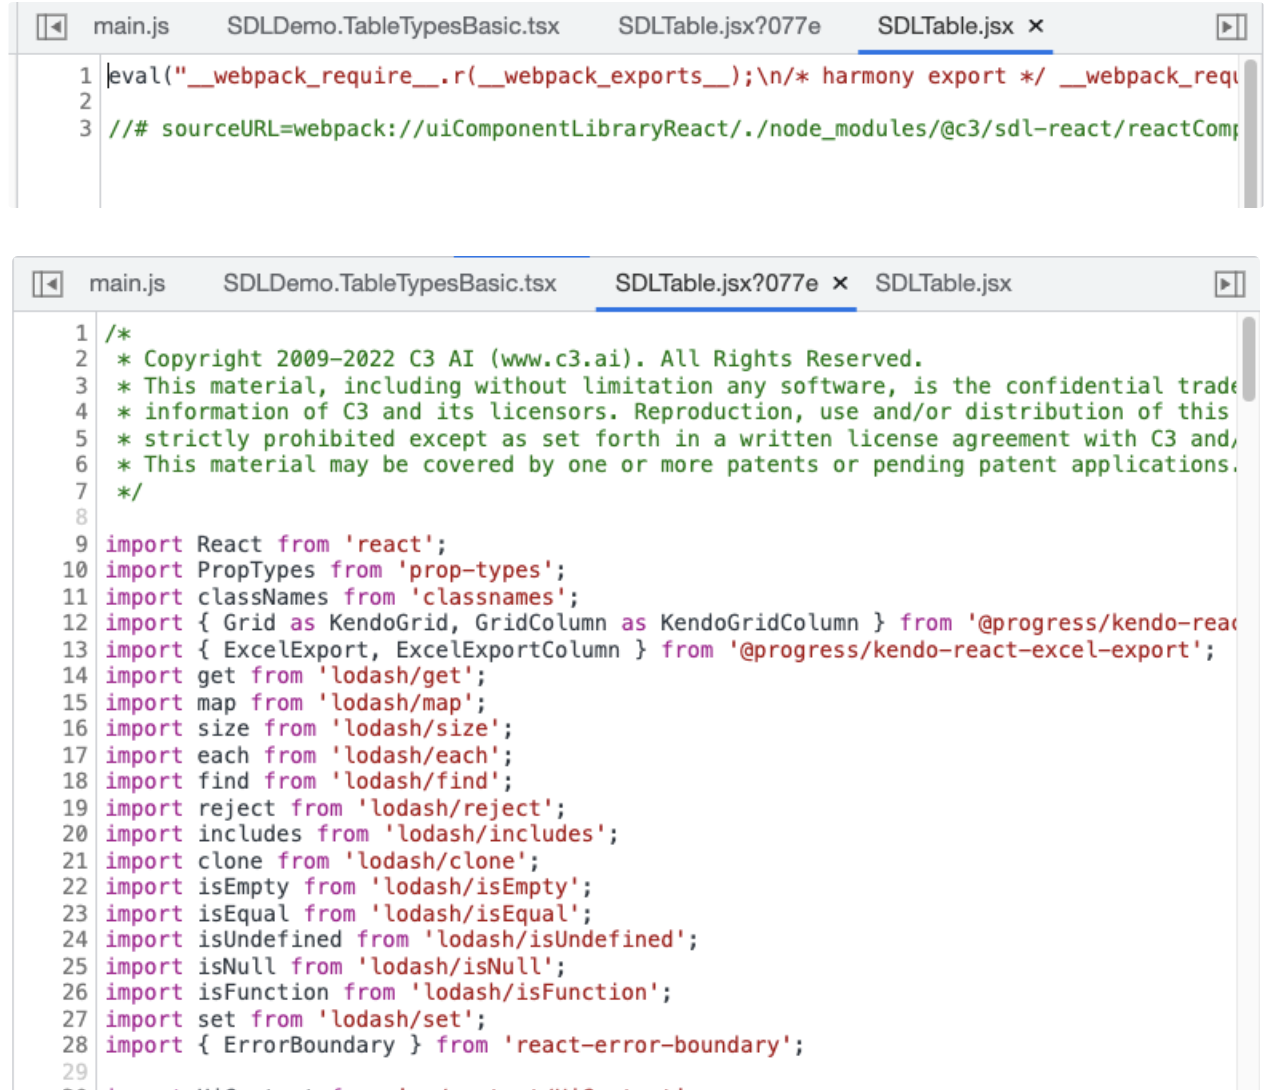
An example image of the multiple files for a jsx file:
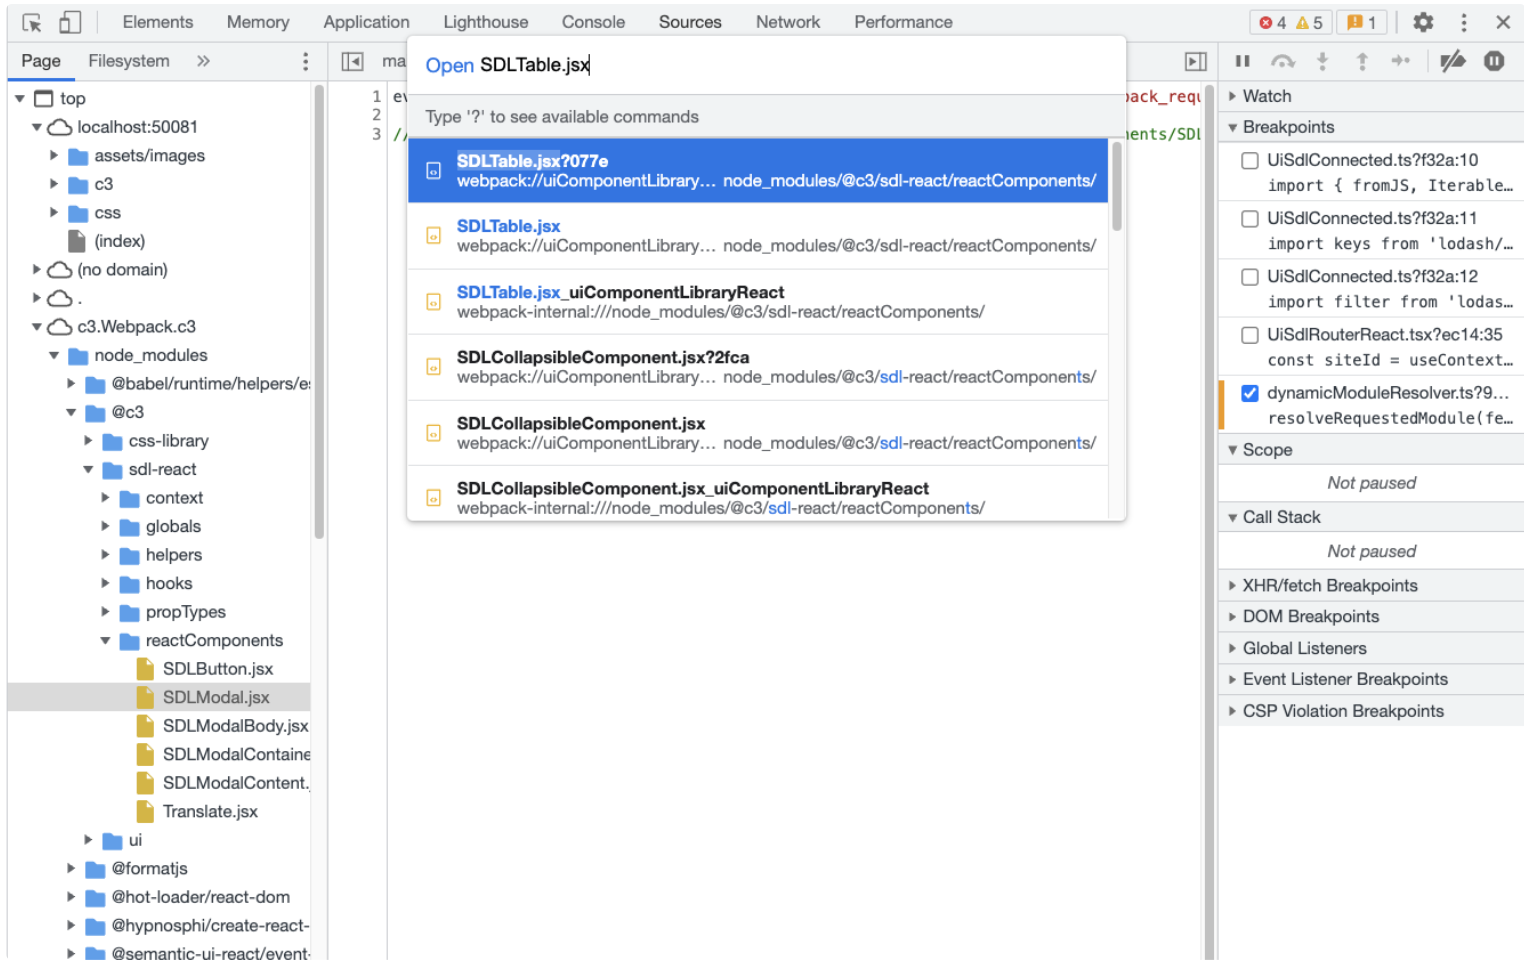
Choose the file containing the fingerprint after the ?, SDLTable.jsx?077e to see the source code.
Find the rendered component ID
The component ID consists of the component instance JSON filename. When debugging the UI, there might be times you do not know the component ID. To find the component ID, install:
To find the component ID:
- Open the Components tab in the React Devtools.
- Select the inspection tool.
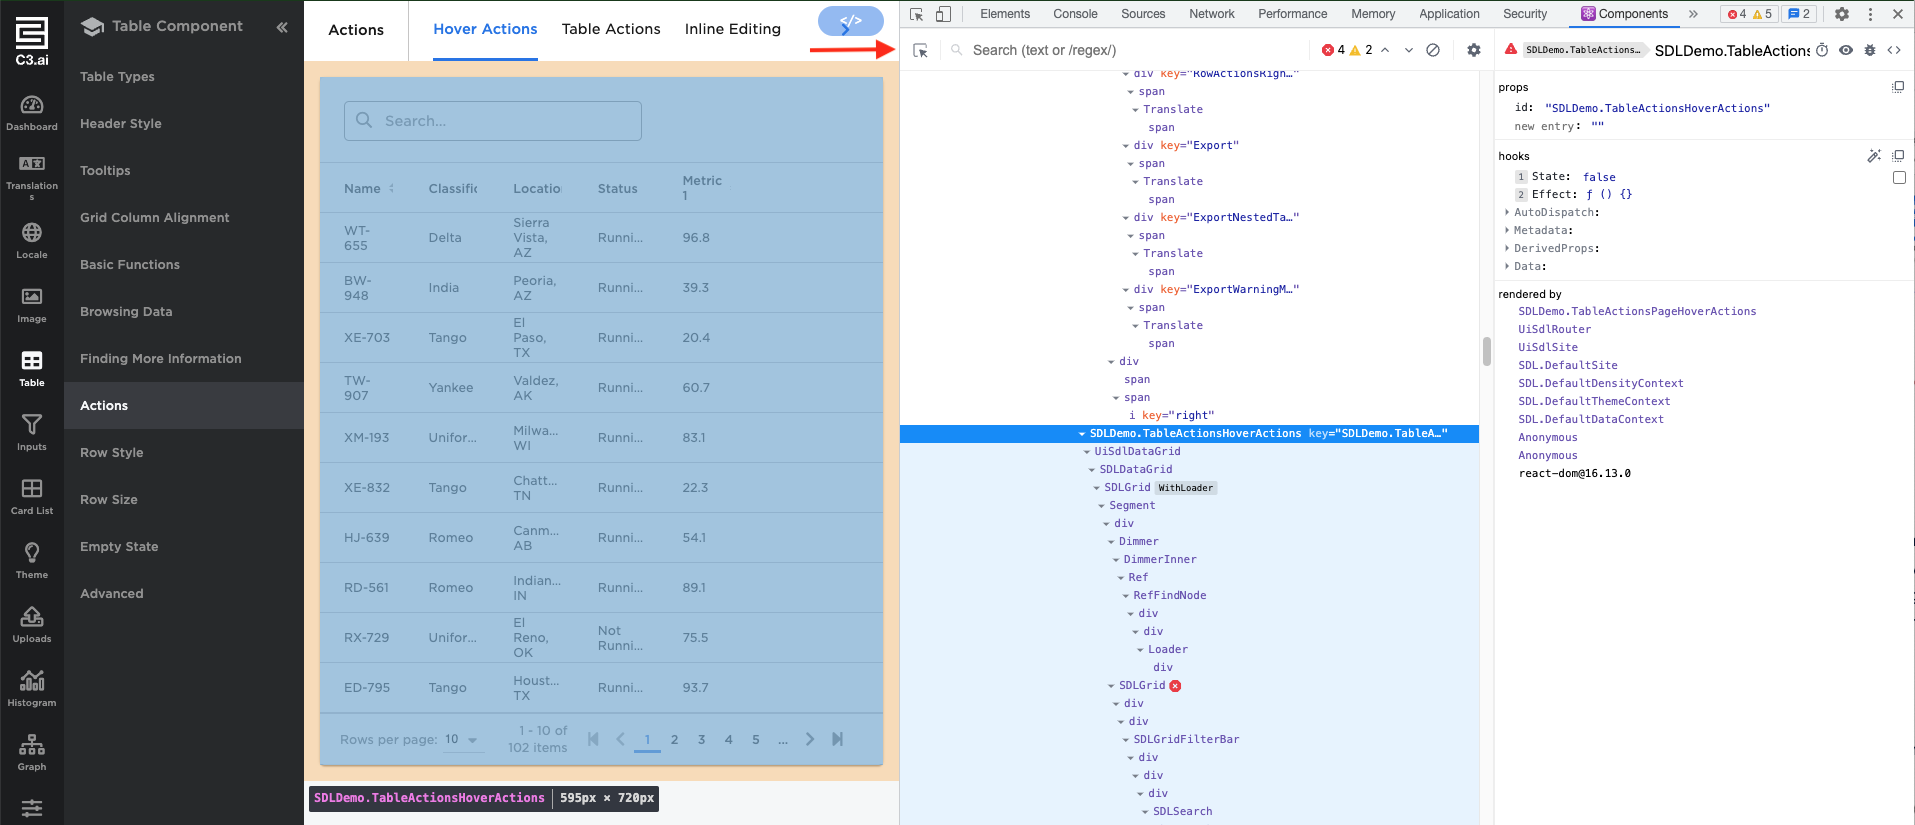
- Hover over the component to find the component ID. You can also hover over the component ID in the Components tab to highlight the component instead.
- See the highlighted component ID with the following syntax:
ModuleName.ComponentName.
View triggered actions, payloads, and changes in the state of a component
Note: Install Redux DevTool to see triggered actions, payloads, and the changes in the state of a component.
Components interact with each other by triggering actions. The trigger field in the component's JSON configuration declares the action. To debug an action, open Redux DevTools.
To following example code block shows the JSON configuration of a component with a trigger.
[{
"trigger": "SDLDemo.TableActionsHoverActions.ROW_ACTION_CLICK_DELETE_WITH_CONFIRMATION",
"effectType": "UiSdlEpicShowUiSdlModal,"
"payload": {
"modal": "SDLDemo.RowDeletionConfirmationModal"
}
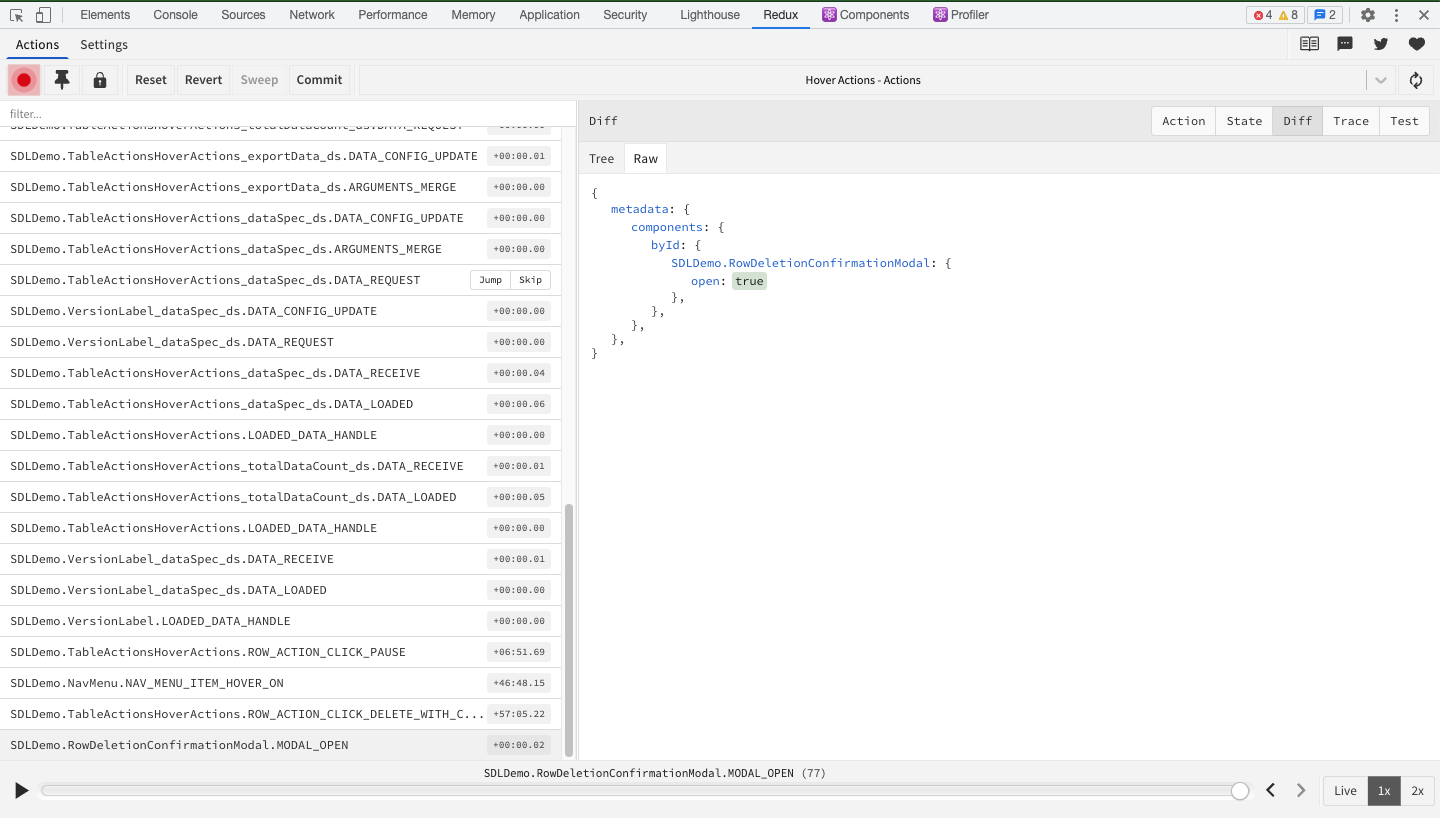
}];Following the previous codeblock, the ROW_ACTION_CLICK_DELETE_WITH_CONFIRMATION triggers when clicking on the delete the icon on the row. Then, the ROW_ACTION_CLICK_DELETE_WITH_CONFIRMATION successfully starts the MODAL_OPEN action.
To view triggered actions:
- Open the Chrome DevTools.
- Select the Redux Tab.
- If you do not see the Redux tab, select the arrow and then the Redux option in the dropdown menu.
- If it is still not shown, verify that you installed the correct Redux extension.
- Select the red circle button. This action will clear the previous action logs.
- Trigger an action by selecting the delete icon on a table row.
- Select the desired action to view the passed data.
Expected actions are not triggered
If the expected actions are not triggered, it might be due to a typo in the action names. Check for typos in the effectTrigger field component JSON configuration.
This debugging method applies to any type or subtype interacting with actions like UiSdlEpic, UiSdlTransform, or UiSdlApplicationState. To further debug, enter the effectType value. In the previous code block, the value of the effectType is UiSdlEpicShowUiSdlModal.
Note: To learn more about how data is passed between components, see communication between components.
View change in the component's state
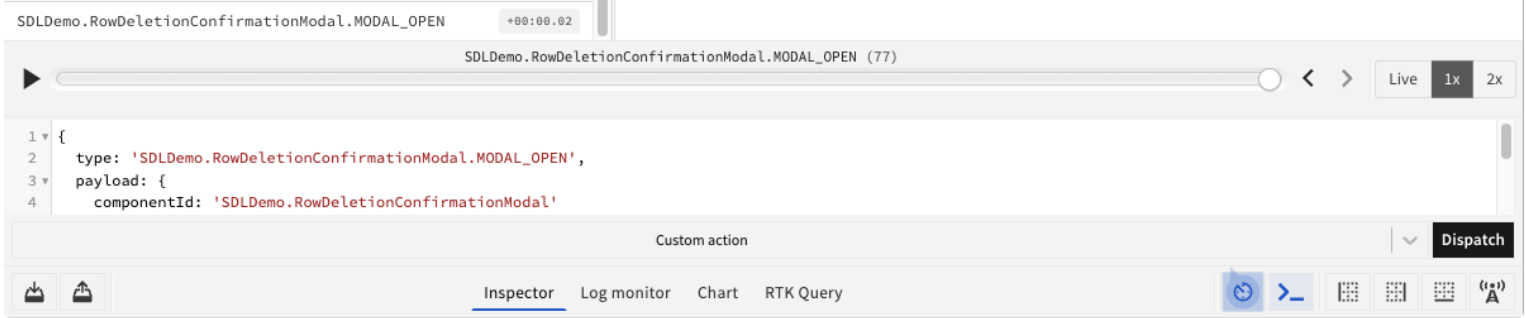
One of the best ways to see what changed in the state of your component is to view the Diff tab, where only the values that changed are shown and highlighted:
Send a modified action
To debug or send potential fixes, you can also send modified actions. To do so, follow these steps:
- Open the Redux DevTools.
- Select the icon at the bottom of the panel to open the dispatcher.
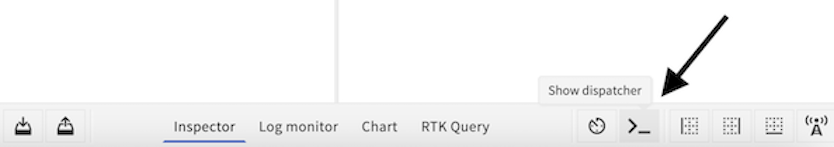
- Enter the modified action and select the Dispatch button.
- If you have UiSdlEpic related to the action, view and analyze the source code of the epics by placing breakpoints or by viewing the Inspector panel.
View requests sent by the browser
Read inspect network activity before continuing.
It is vital to ensure your Protocol is at least h2 and that the reported time per request is lower than 100ms. Higher times indicate network latency or server slowness. Address those issues to ensure proper performance. The Network tab of Chrome DevTools gives you a detailed list of sent requests made from the browser.
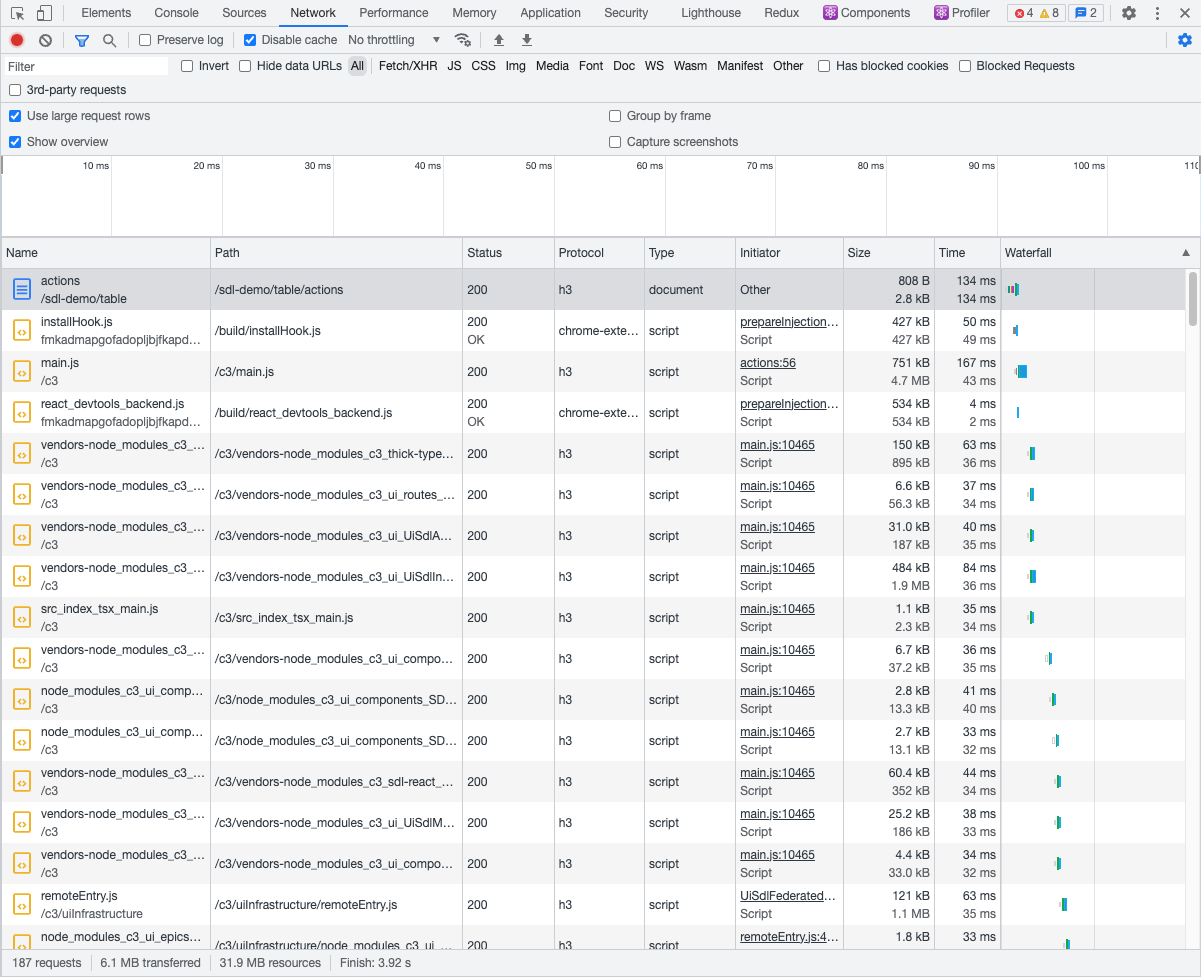
The network tab lets you accomplish the following:
Filter the request by type or name:
- Use the built-in filters, the
Fetch/XHRoption. - Enter the type or name of the request.
- Use the built-in filters, the
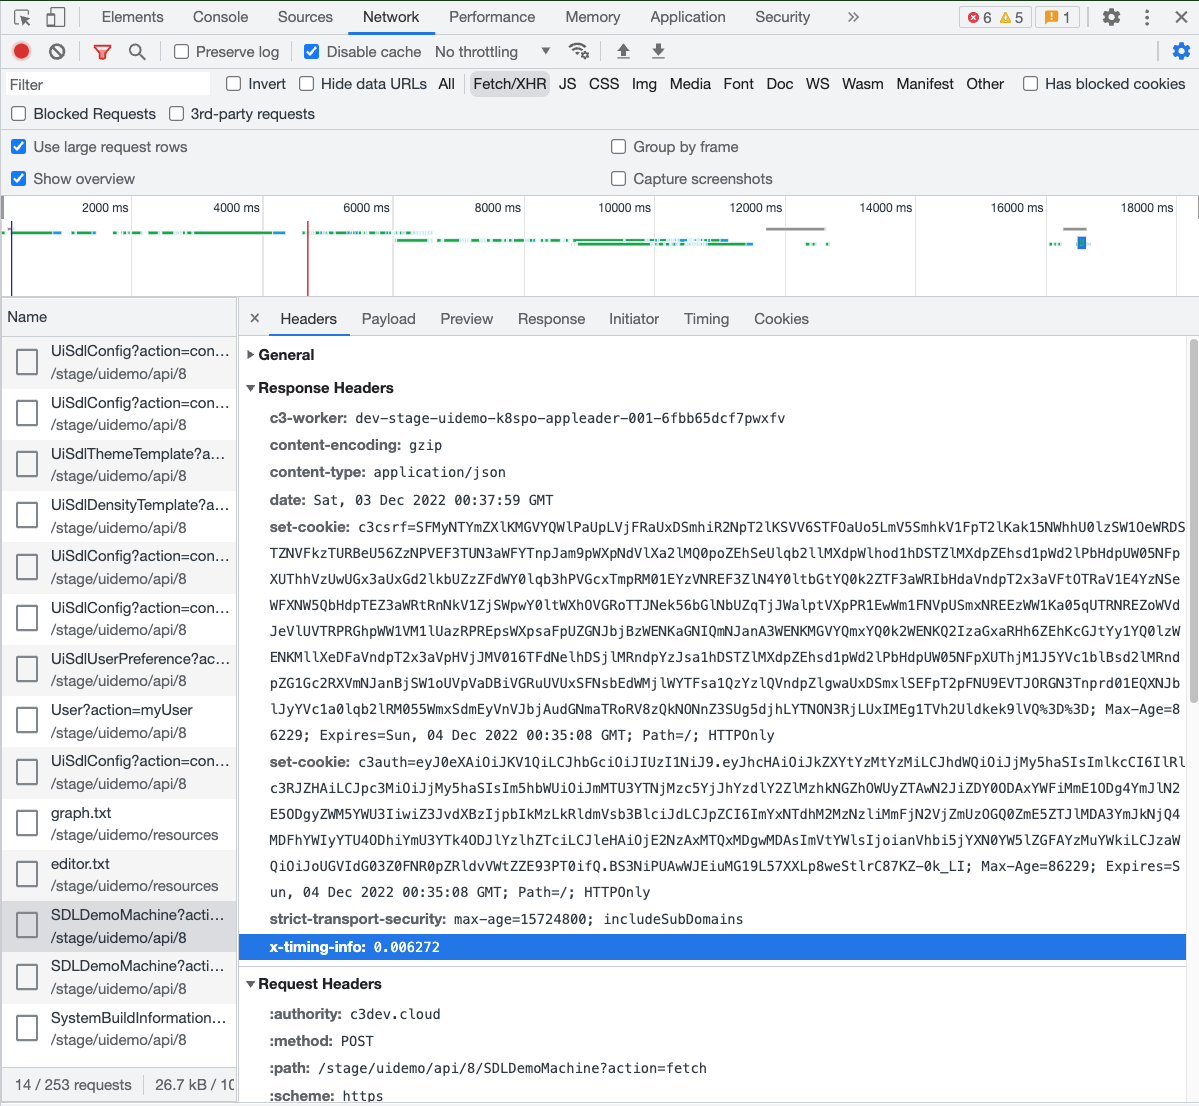
Analyze the time the request spent on the server side:
- Select the desired request to view specific details.
- Select Header tab and view the
x-timing-infounder Response Headers.
View response data when trialing issues that are related to data:
- Select Preview tab. This provides an interactive view of the JSON data that was retrieved from the server. Each level is collapsible and expandable.
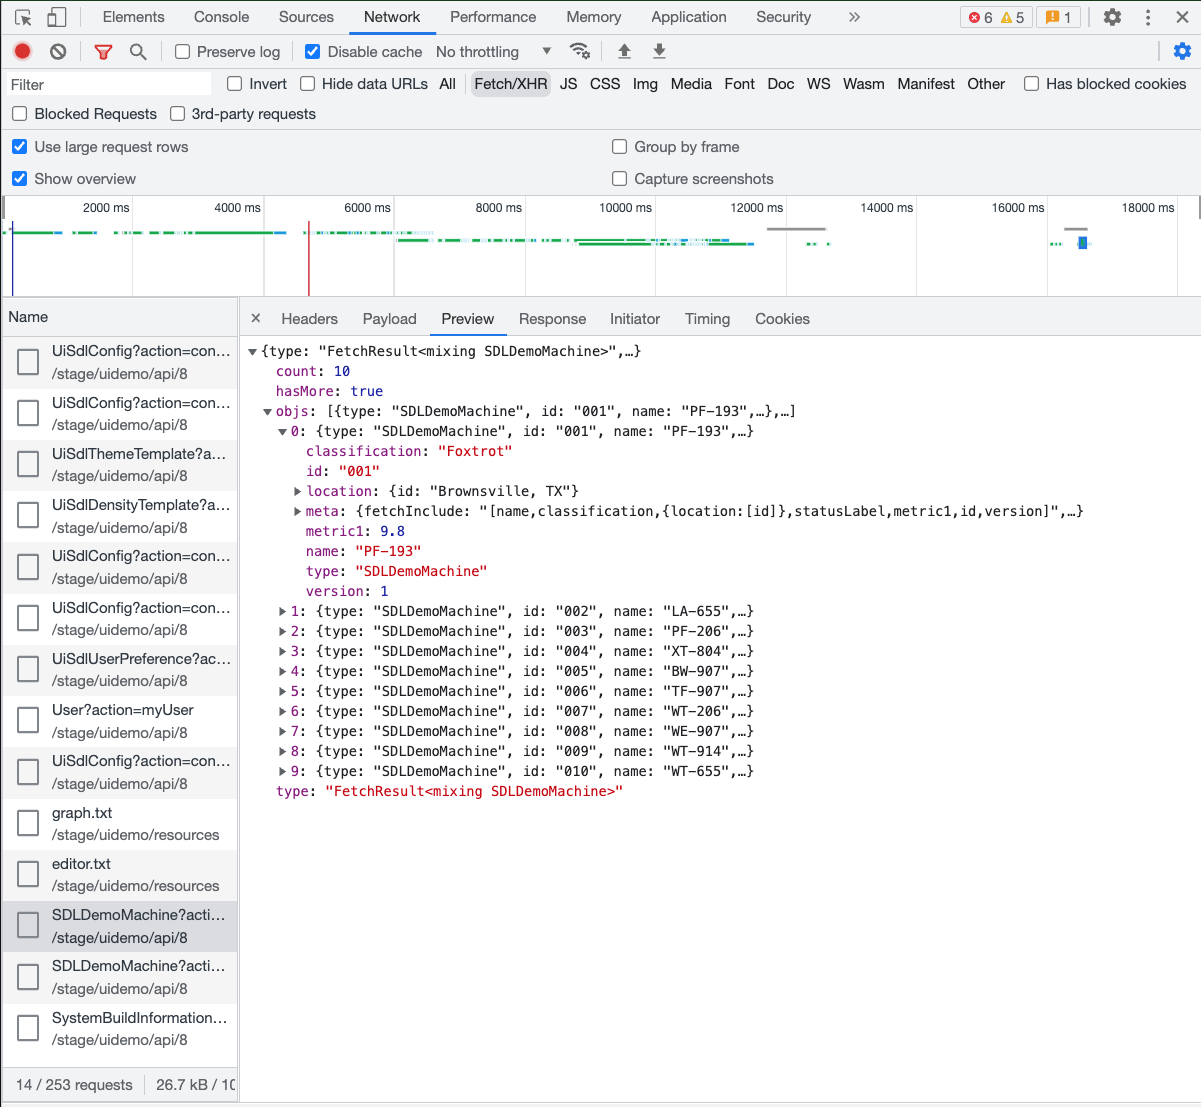 2. Select the Response tab which provides the raw JSON data.
Profiling and performance
Before implementing optimized solutions or reporting performance issues, it is best practice to optimize the quality assurance (QA) and production environments. Optimizing the QA environment helps catch errors early.
Requirements for production and quality assurance environments
Note: Although you can follow these instructions in both development and production mode, you must switch to development mode to identify the code you are debugging by filename.
Determine which mode is currently running:
JavaScriptUiSdlConfig.inst().infrastructure.webpackMode;If this returns
developmentorproduction, that is the mode that UI bundles will be served as. Otherwise if this returnsundefined, then the mode is determined by the AppMode that can be found viaJavaScriptApp.inst().mode;See the below table for a full explanation for which combinations of
UiSdlConfig.inst().infrastructure.webpackModeandApp.inst().modeserve which bundle mode.UiSdlConfig.inst().infrastructure.webpackModeApp.inst().modebundles served as development [any] development production [any] production undefined dev or test development undefined prod or trial production Enable development mode:
Although development mode will be the default if
App.inst().modeis 'dev' or 'test', it can also be set for other App modes with:JavaScriptUiSdlConfig.inst().setConfigValue('infrastructure.webpackMode', 'development');Enable
HTTP/2.- Depending on your cloud provider, this might be enabled. For environments hosted by C3 AI, it is already enabled. Please reach out to your IT organization to see if your provider can enable
HTTP/2.
- Depending on your cloud provider, this might be enabled. For environments hosted by C3 AI, it is already enabled. Please reach out to your IT organization to see if your provider can enable
The following sections discuss ways to find and isolate the root causes of poor code performance.
Diagnose poor performing code
Poor code performance can occur if a component is rendered too many times. This section discusses ways to profile your component code.
If your UI is running slowly, use the following steps to record a profiling session on your component code:
Record a Profiling session when running the slow-running UI.
- If you find that a specific interaction triggers page slowness, start recording before that interaction is triggered.
- If the trigger of the page slowness is unknown, start the recording as soon as the page begins loading.
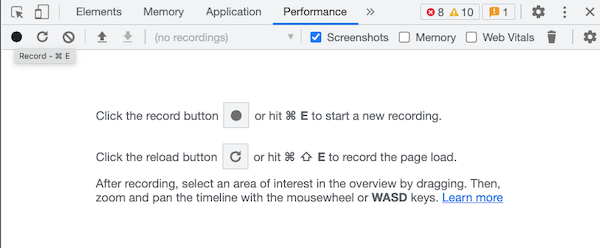
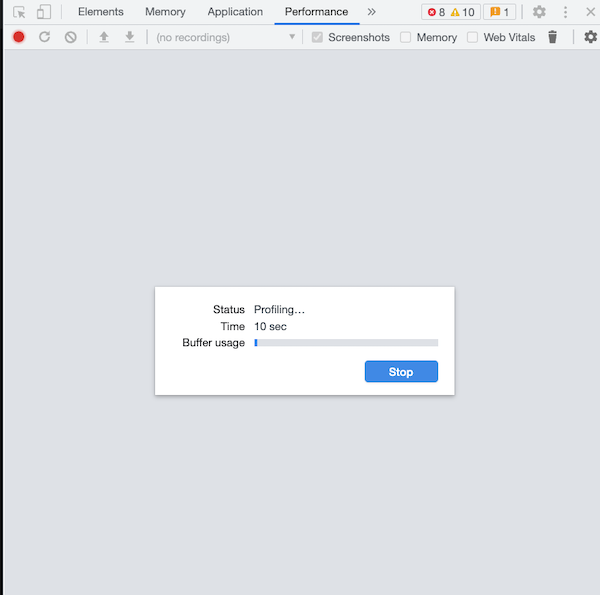
Start recording. Once you start recording, you'll see a modal appear.
Perform the desired user interactions to record.
Stop recording by selecting the Stop button in the modal.
An example image of an analysis you receives after you stop recording a session:
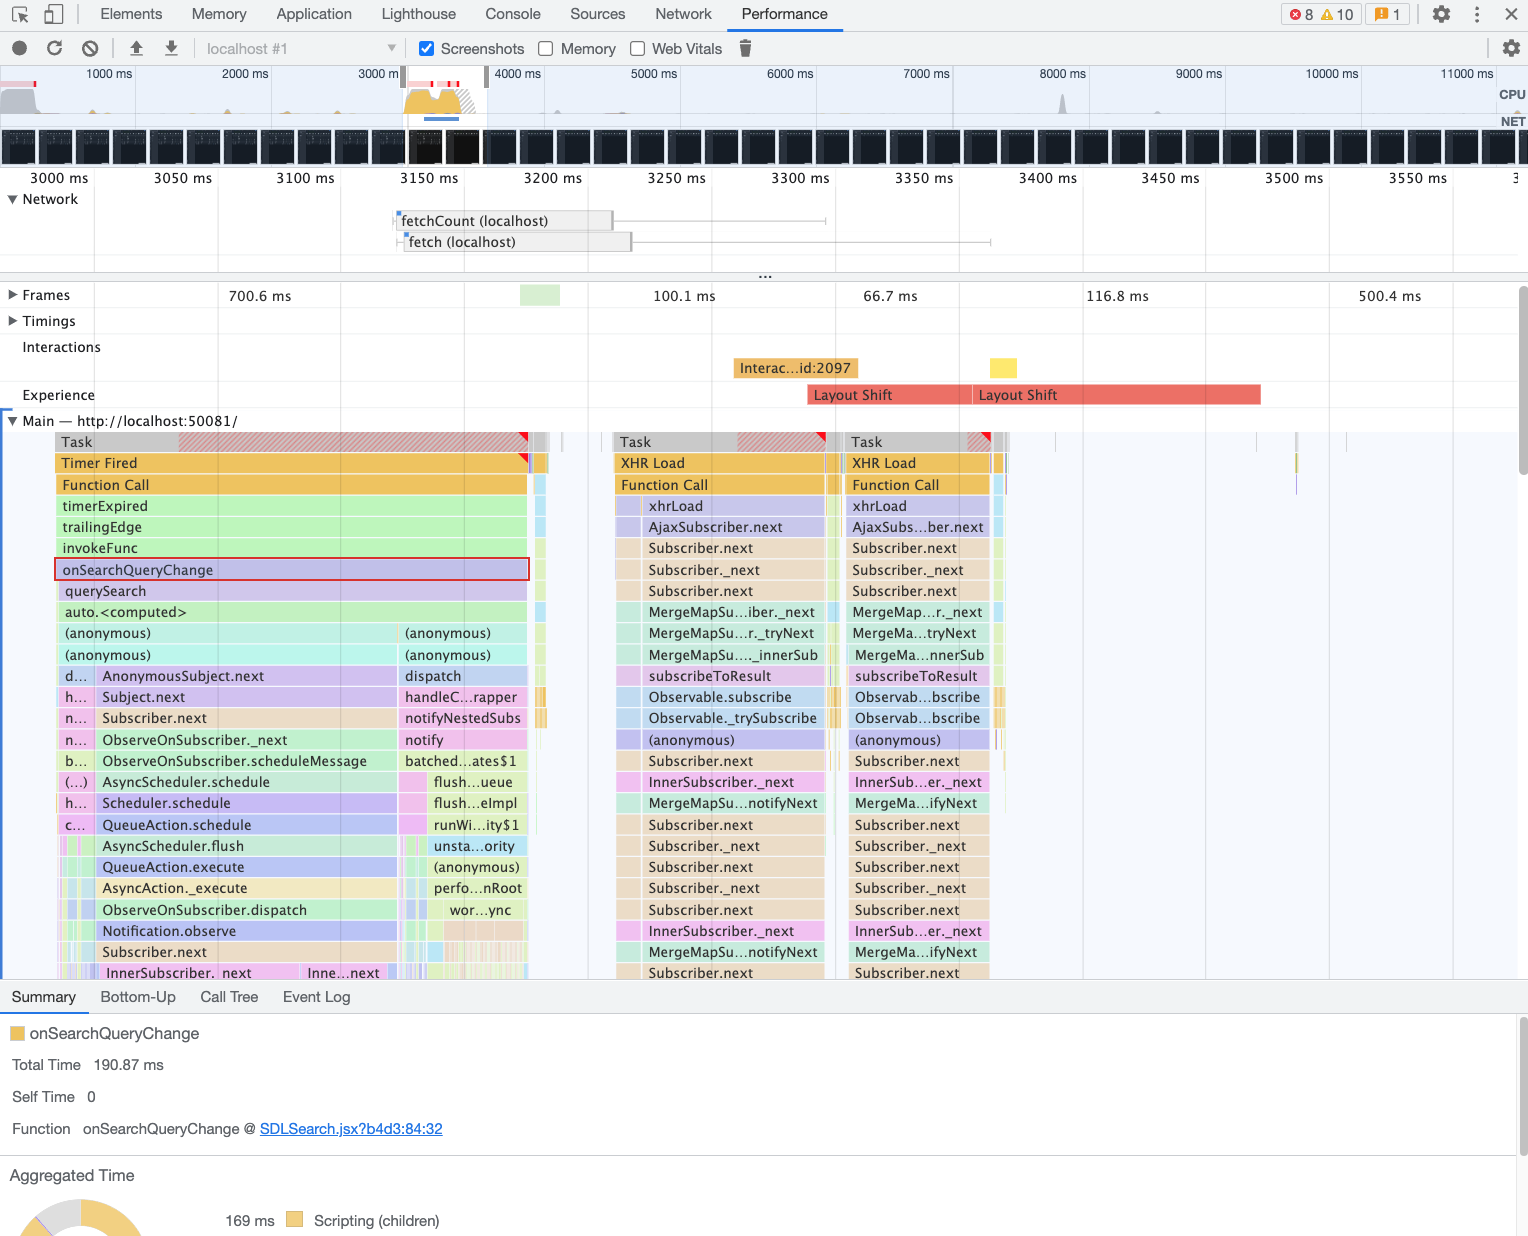
Note: The "flame chart" identifies the called functions and the time spent completing each function. The flame chart shows the function names if your application is in development mode.
View the Summary tab to see:
- Total Time: The time it took for the function to complete running (for the
onSearchQueryChangeit took190.87ms). - Self Time: All the time spent in functions called by it (for the
onSearchQueryChangethe amount of time functions spent calling on it was0). - Function: Showcases the filename for the function. Select the
SDLSearch.jsxto be redirected to the file and set breakpoints or analyze the source code.
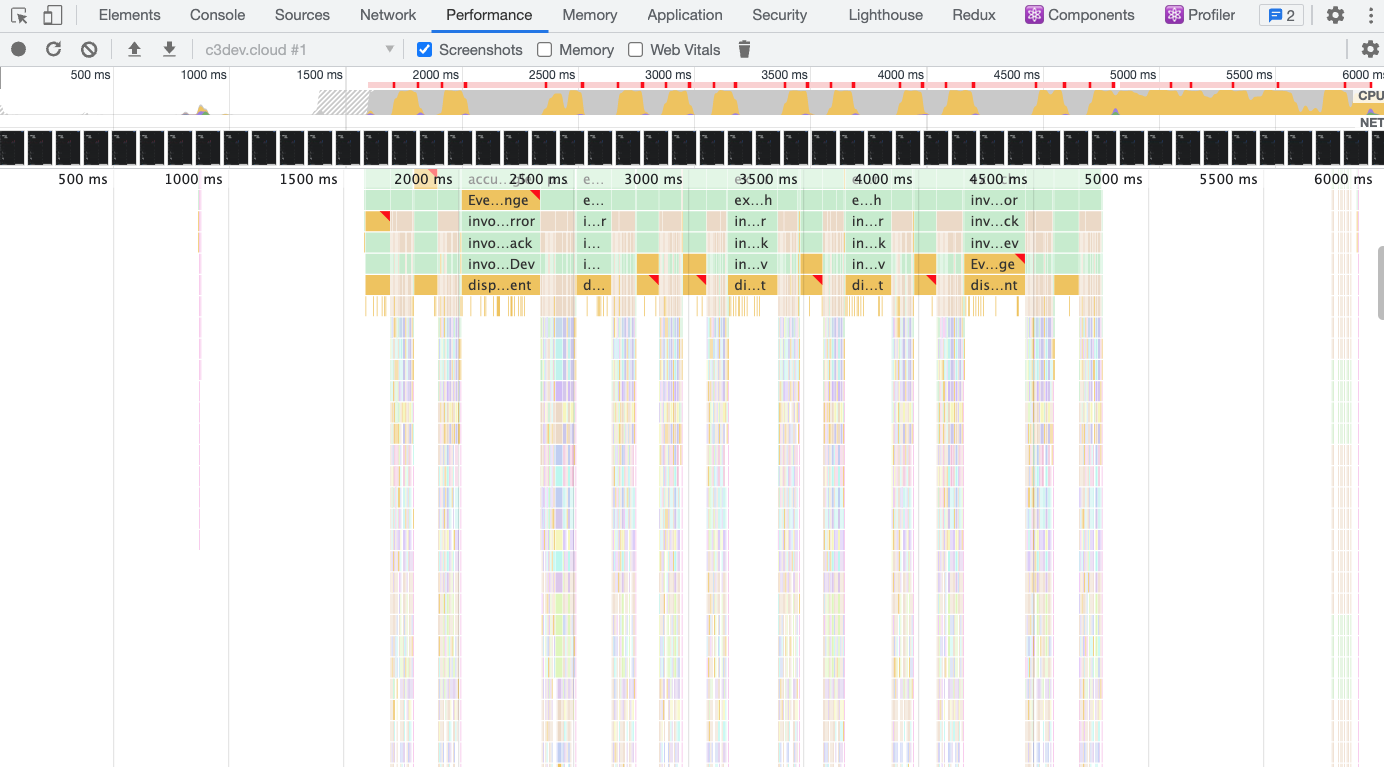
Analyze whether the component is re-rendering too many times
The flame chart indicates when a component is executing multiple times in rapid succession unnecessarily.
These charts cannot show the cause because the function calls are too small to find the root issues.
Example of a session recording of an input field behaving unexpectedly and causing a slowdown when the user interacts with it:
To find the root cause:
View other network requests or application logic contributing to the slowness.
Explore the issue further by using the Profiler in React Dev Tool.
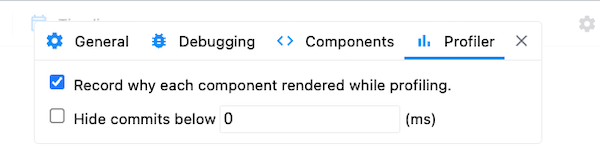
- Enable Record why each component rendered feature to capture how and which components are re-rendered.
- Start, stop, and capture the bad behavior in the recording.
- Analyze the flamegraphs.
- The example image shows the
SDLDemo.SimpleFormre-rendering 12 times and around 90ms per render.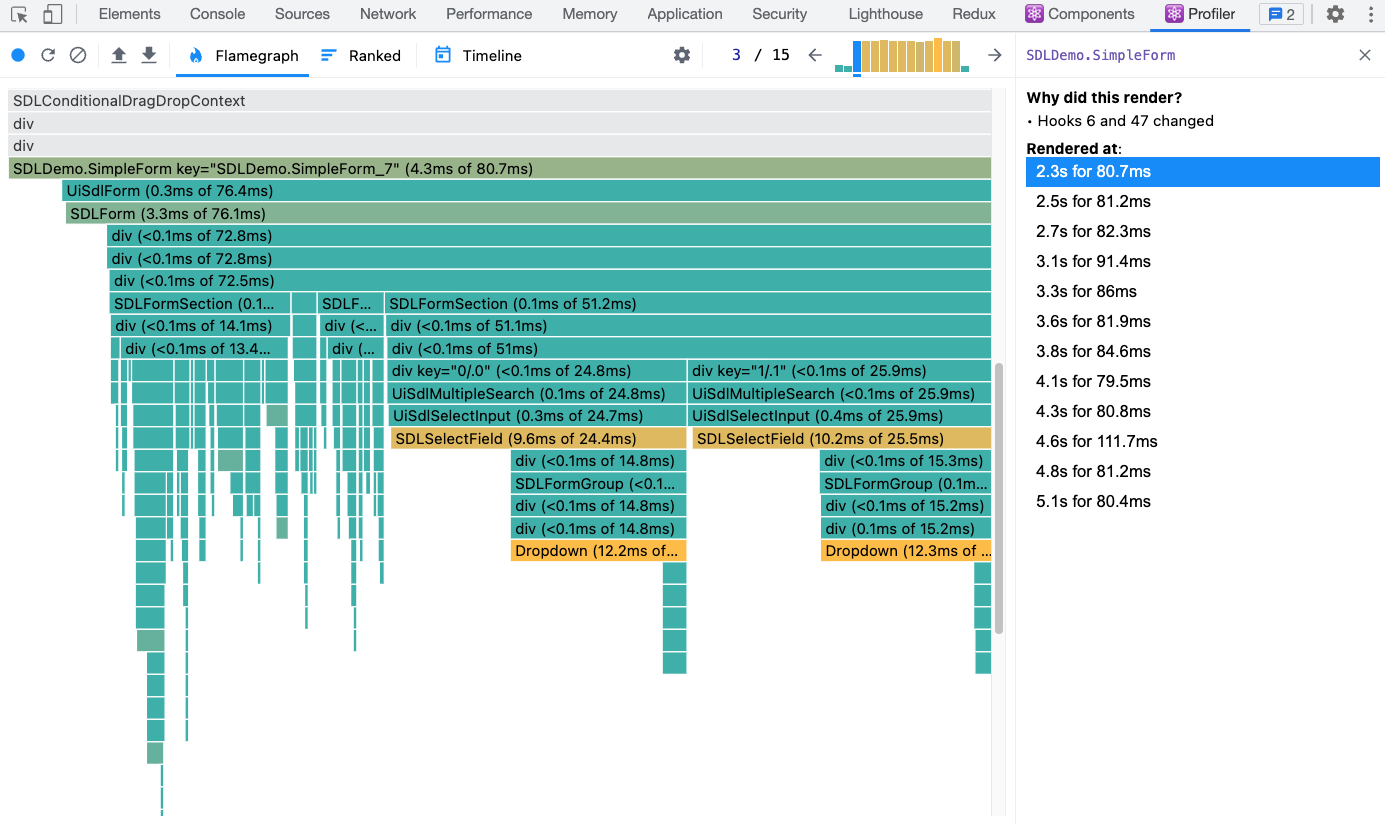
- The example image shows the
- Compare each of the renders.
- It might be that a part of a component is re-rendered again and again. In severe cases, the component might unmount and remount again.
In our example, two React hooks change each time the component renders. If this is a component you authored, find which hooks were changed by searching for the component in the Components React DevTool tab and locate the hooks by number.