Agent Evaluation - Getting Started
This tutorial walks you through an end to end agent evaluation: from setting up your data, to analyzing results and comparing runs in the UI. After completing this tutorial, you will know how to create datasets, run experiments against an agent, inspect per-test-case metric results, and use the Compare Runs view to identify regressions.
Prerequisites
Before you start:
- Access to a C3 environment (SNE, MNE, or shared environment).
- At least one
GenaiCore.Agentexists in the tenant, or you have a valid agent ID. If you need to create an agent, see Creating an Agent from a Template or Creating an Agent from Scratch. - The
py-deepevalruntime is available in your environment (required for dataset loading from content). - Access to C3 JupyterLab or a similar Python notebook environment connected to your C3 app.
1. Set up data using Python
Experiments, metrics, and runs are created using Python. Datasets can be created either from Python or directly in the UI (see Create Dataset from UI below). Before you open the UI, use a Python notebook or script to call the Agent Evaluation API and set up the data you want to evaluate. For a complete working reference, open the hydrate_agent_eval_test_data.py notebook in your C3 JupyterLab environment.
Your setup needs to:
Create one or more datasets. A dataset is a versioned collection of test cases. Structured test cases require an
inputfield (the question or prompt); all other fields such asexpectedOutputare optional. Unstructured test cases are flexible JSON with no required fields. You upload these from a CSV or JSON file usingGenaiCore.Eval.Dataset.load().Define metrics. A metric is a quantitative measure used to evaluate agent performance, outputting a score (and reasoning) to determine whether the output meets a specific quality threshold. You can use built-in DeepEval metrics (
GenaiCore.Eval.Metric.DeepEval), built-in rubric metrics (GenaiCore.Eval.Metric.Rubric), or write a custom Python function usingGenaiCore.Eval.Metric.NativePy.Create an experiment. An experiment is a high-level grouping for evaluating how well an agent performs for a use case. It is composed of datasets (made up of test cases for that use case) and metrics to evaluate the performance. Create one using
GenaiCore.Eval.Experimentand run it multiple times to track changes over time.Run the experiment against your agent. Once the experiment is set up with its datasets and metrics, call
experiment.run()to execute it, specifying the agent to evaluate. This sends each test-case input to your agent, captures the output, scores it with the experiment's metrics, and stores the results. One run is created per dataset, giving you a snapshot of agent quality at that point in time.
For a complete working reference, open the hydrate_agent_eval_test_data.py notebook in your C3 JupyterLab environment. It walks through all four steps using the GenaiCore.Eval API.
2. Open Agent Evaluation UI
- Open C3 AI Studio in your browser.
- In the left sidebar, expand Agents.
- Select Evaluation.
The Experiments page opens by default.
3. Explore datasets
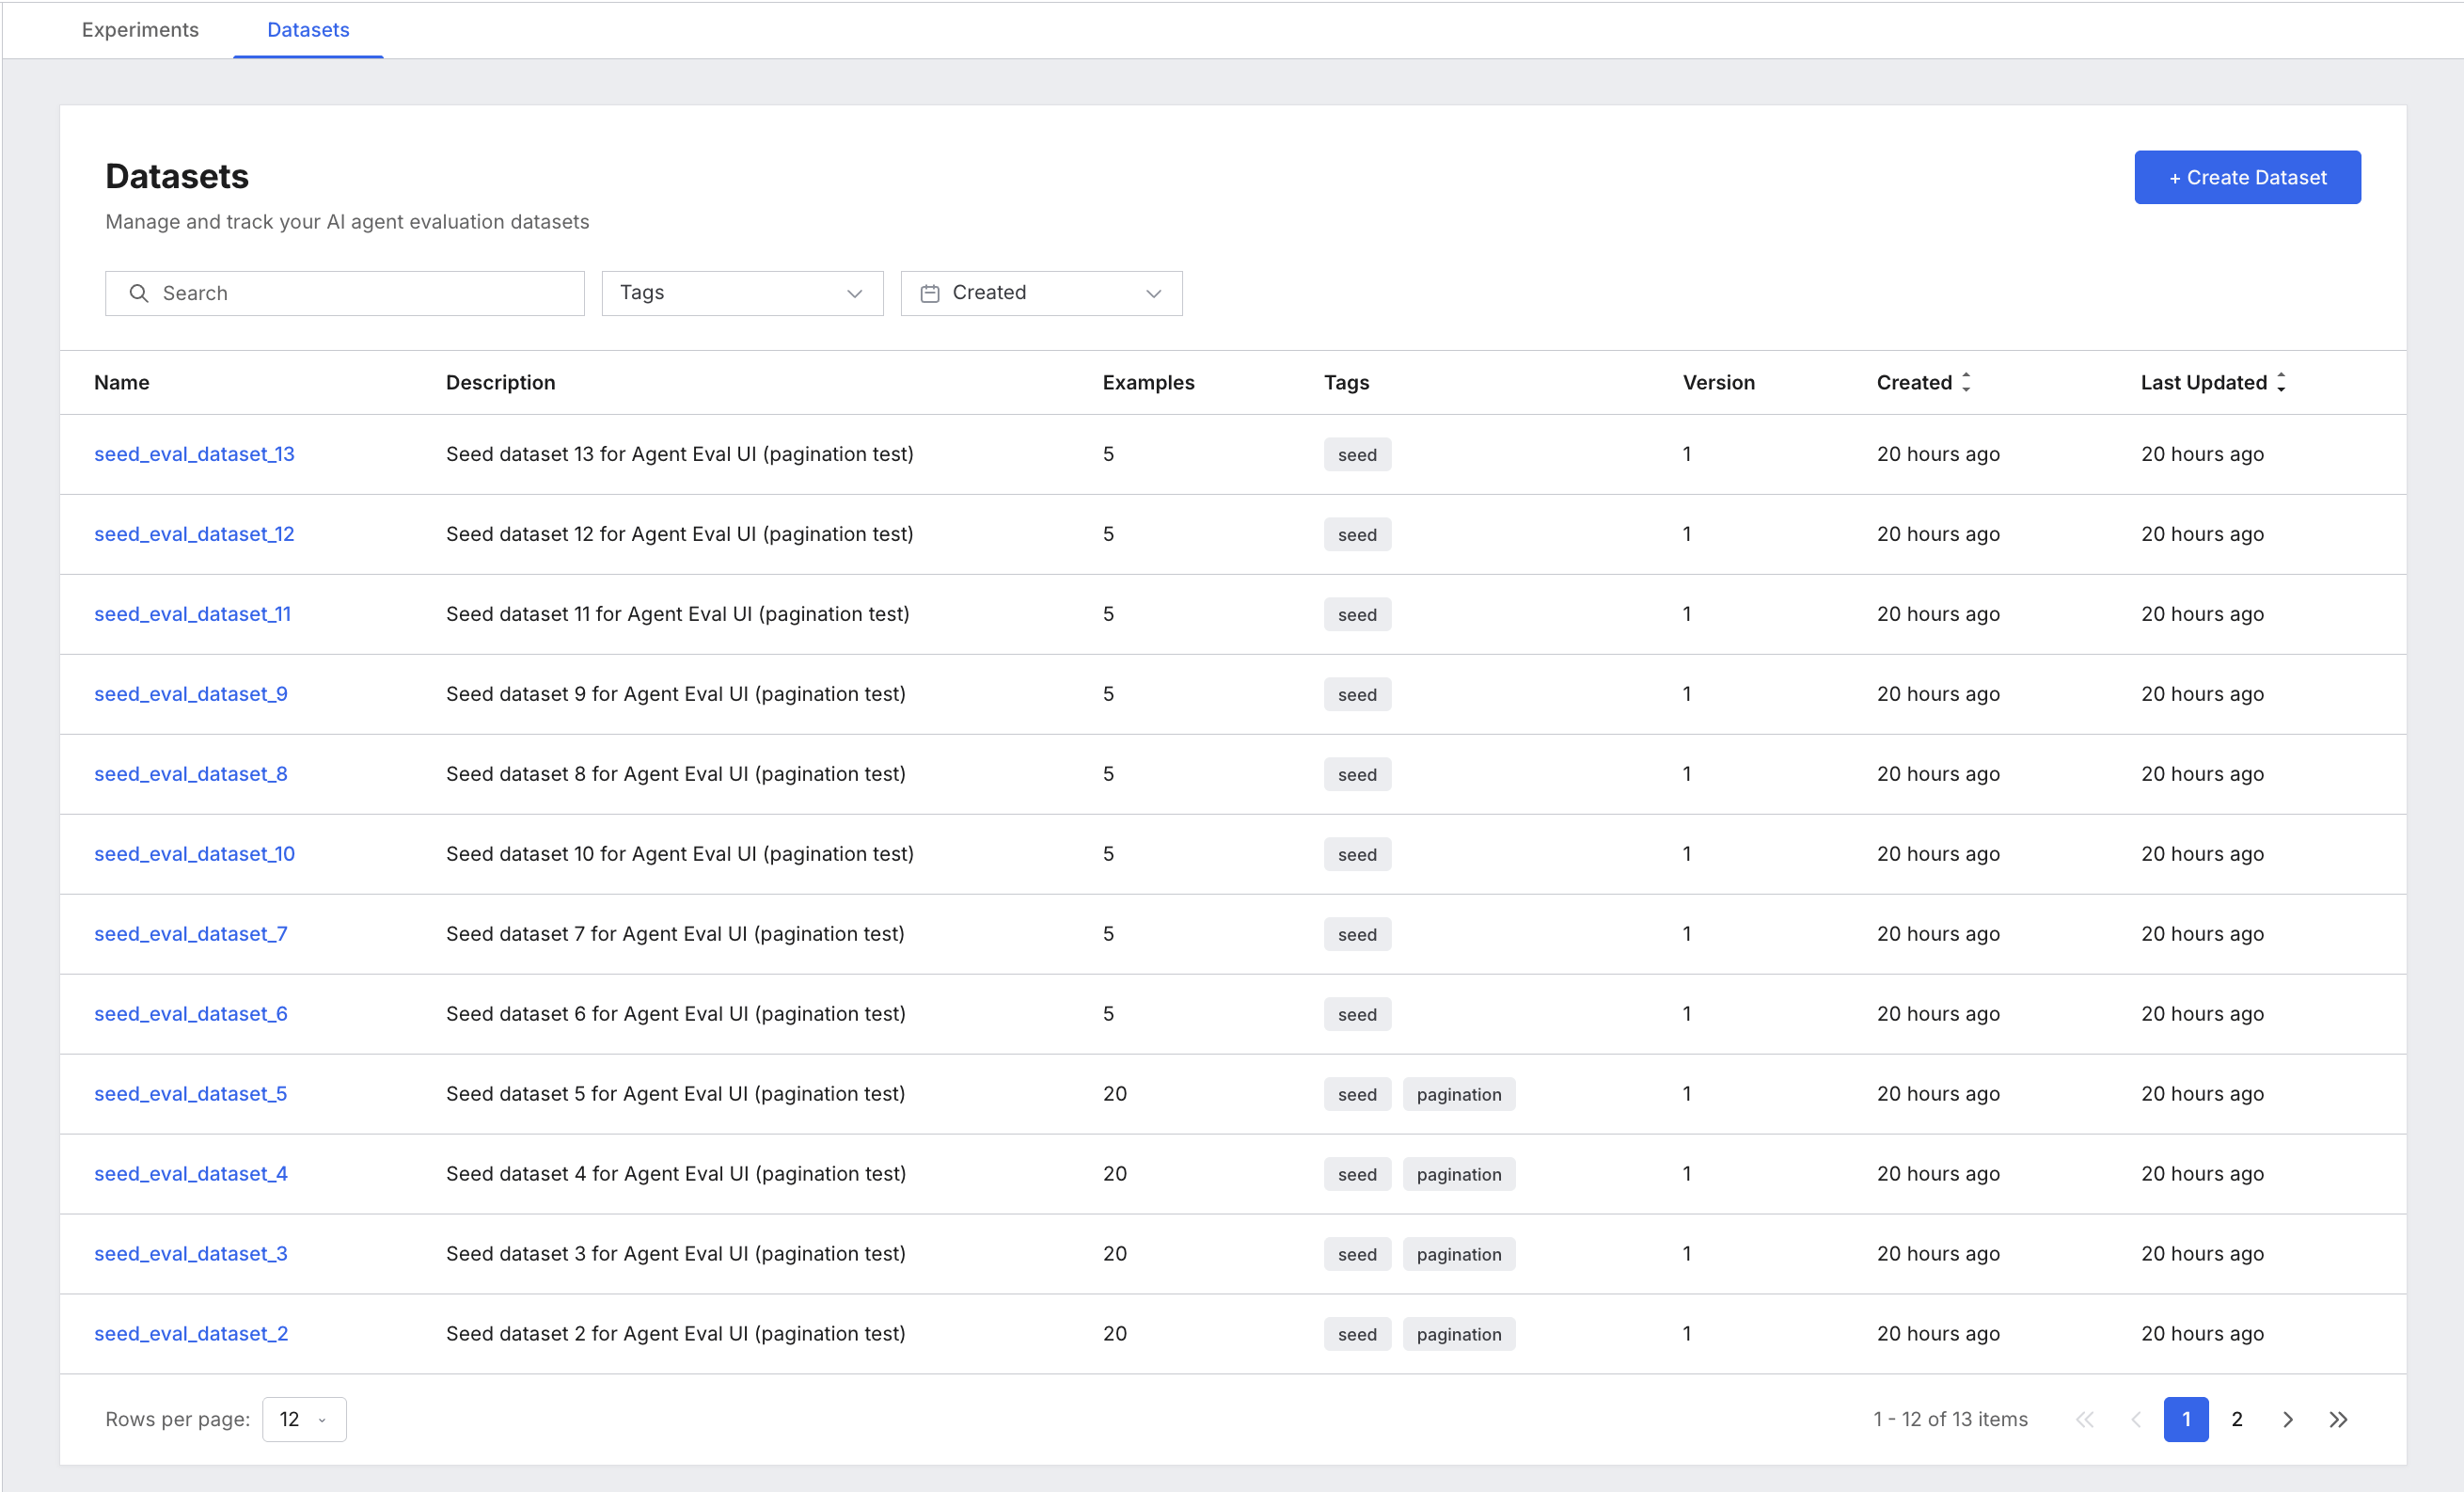
Select the Datasets tab to see all available datasets. Each row is a dataset your script created.
| Column | What it shows |
|---|---|
| Name | Dataset name. Stable across versions. |
| Description | Human-readable description. |
| Examples | Number of test cases in this version. |
| Tags | Any tags you assigned when creating the dataset. |
| Version | Version number (starts at 1, increments on each update). |
| Created / Last Updated | Relative timestamps. |
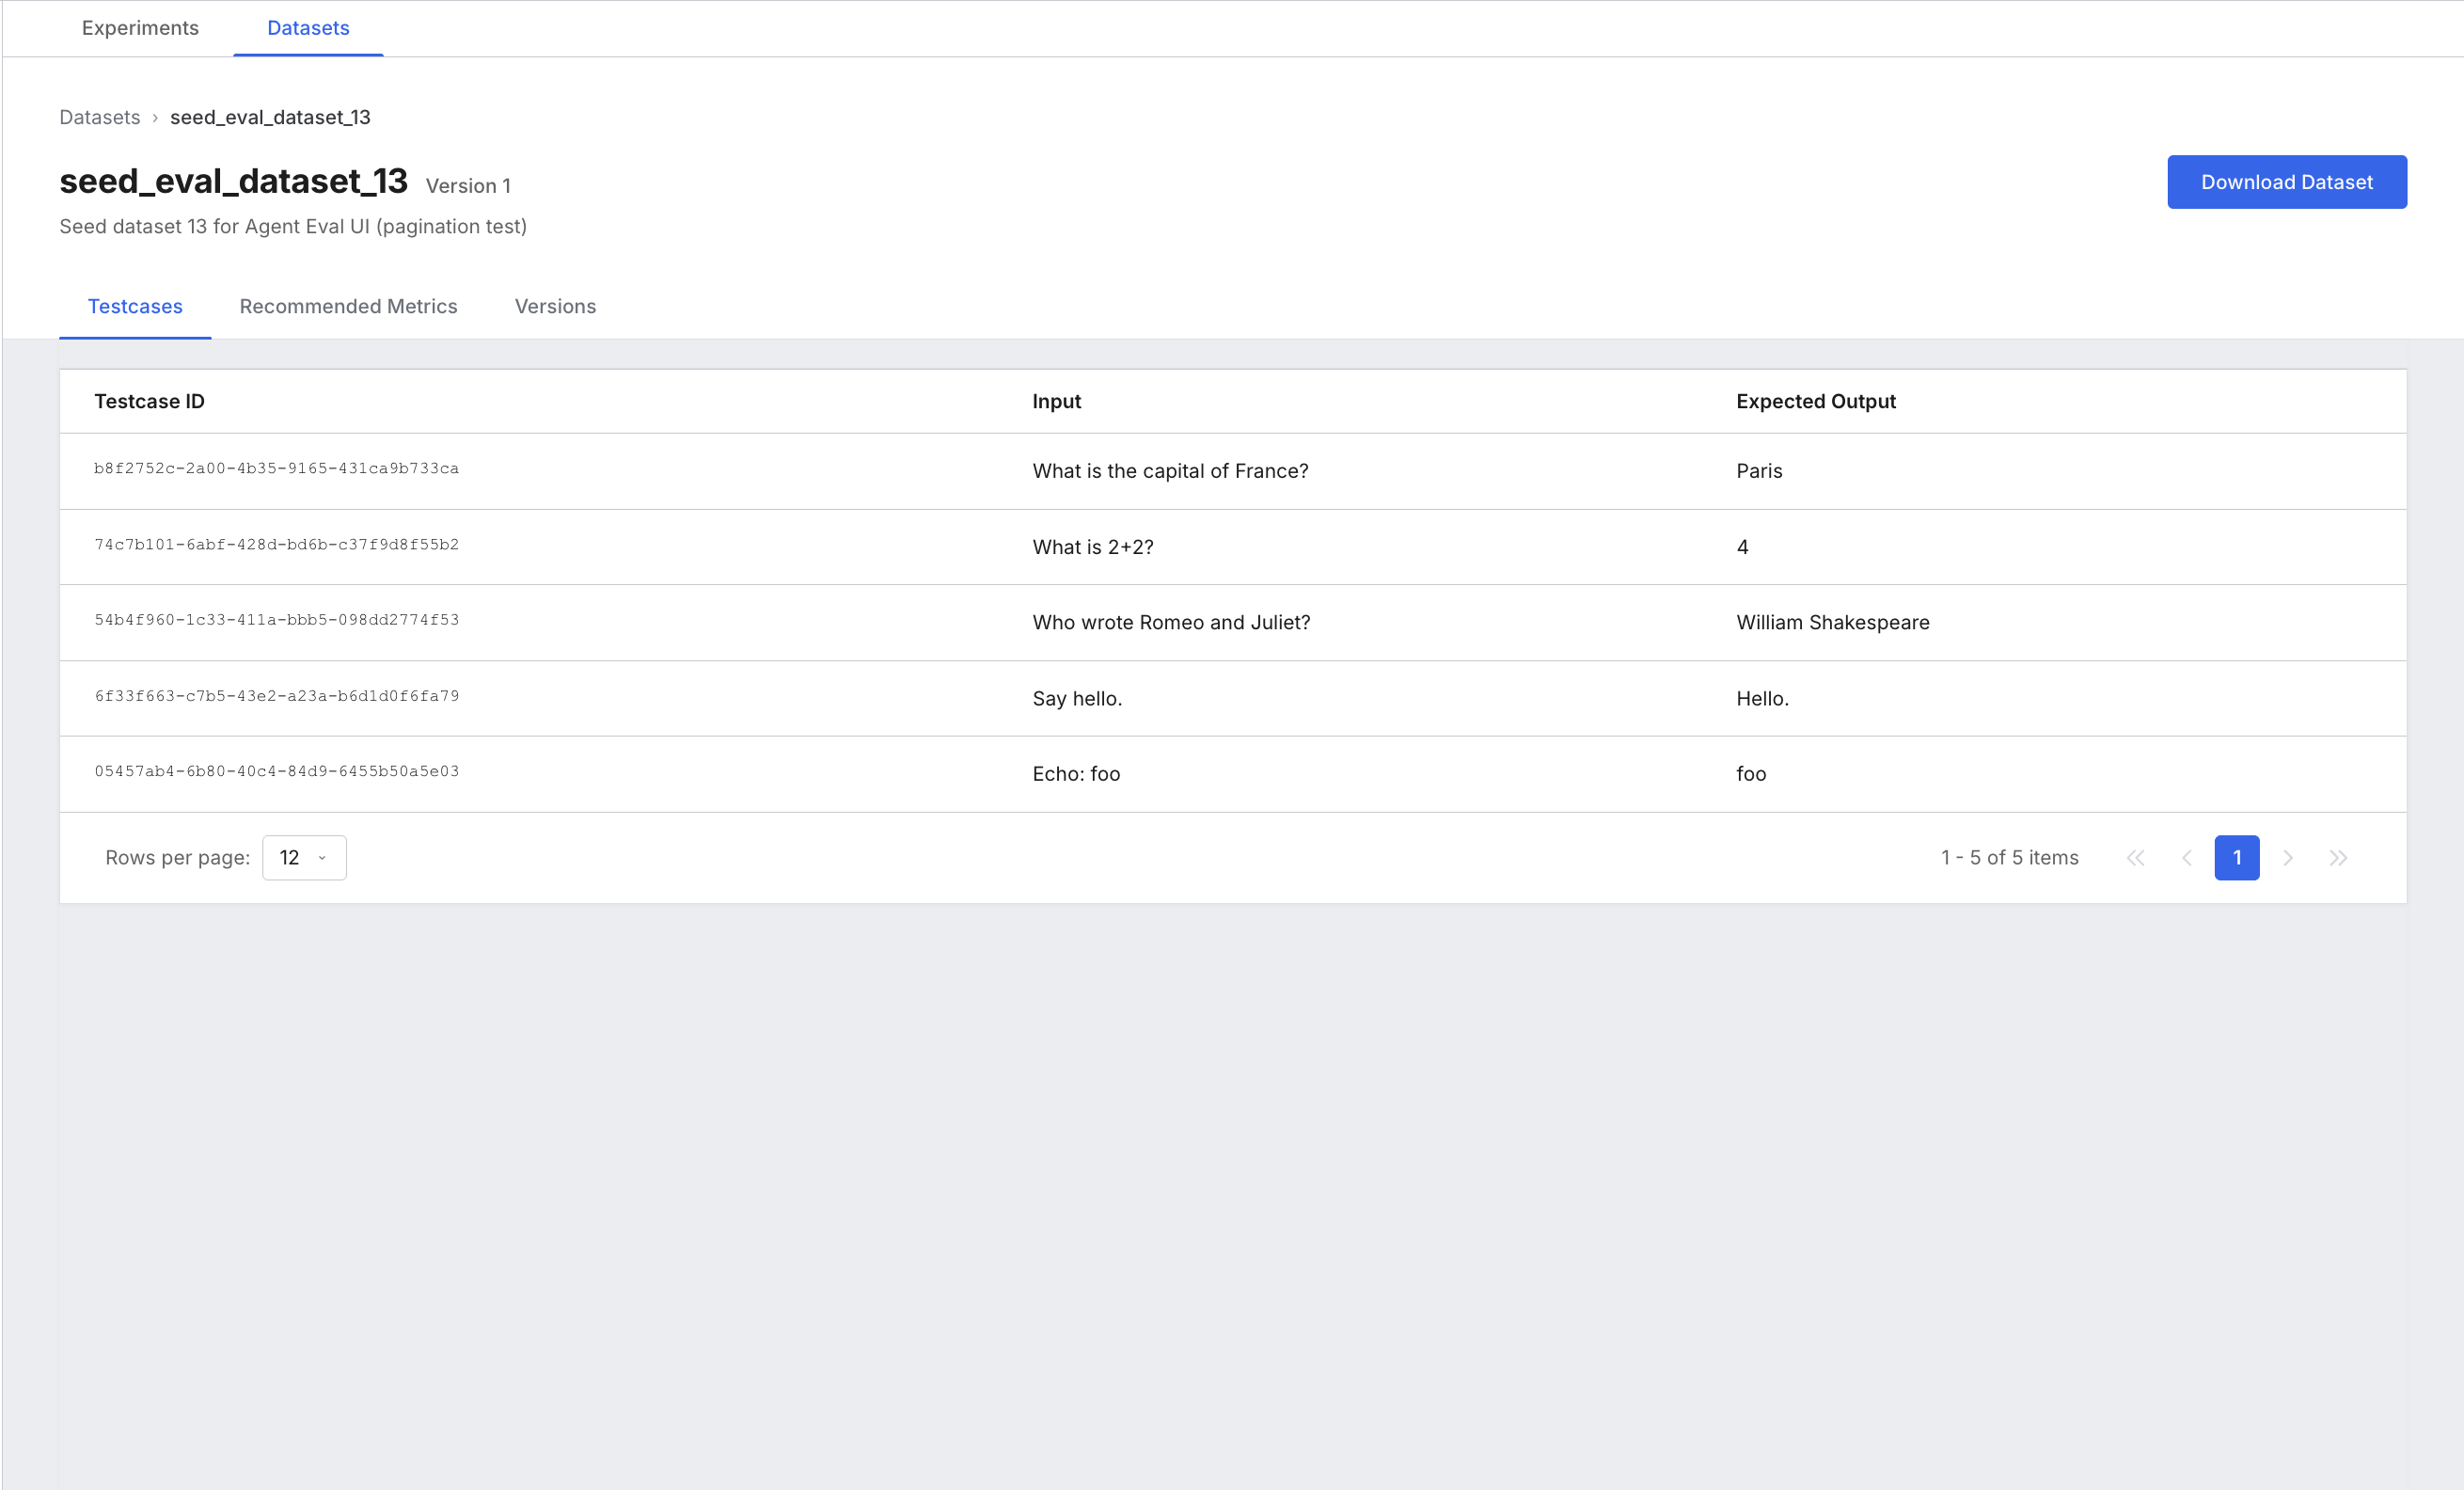
Inspect a dataset
Select any dataset row to open its detail page. The detail page has three tabs.
Testcases tab: Lists every test case in the dataset. The table displays whatever fields the test case contains — for structured test cases this can be any combination of fields (such as input, expectedOutput, context, expectedTools), and for unstructured test cases it displays the JSON data. Select any row to open a side panel showing all fields of the test case along with any additional metadata.
Recommended Metrics tab: Shows which metrics are recommended for this dataset. This reflects the metrics you associated with the dataset when you created it.
Versions tab: Lists all historical versions of the dataset. Each row shows the version number, who created it, and when. Use this when you need to confirm whether a dataset change contributed to a run regression.
Download Dataset: The button in the top right exports the current version as JSON. Use this for external review or audit workflows.
Create Dataset from UI
You can also create a dataset directly from the UI. Select + Create Dataset and upload a CSV or JSON file.
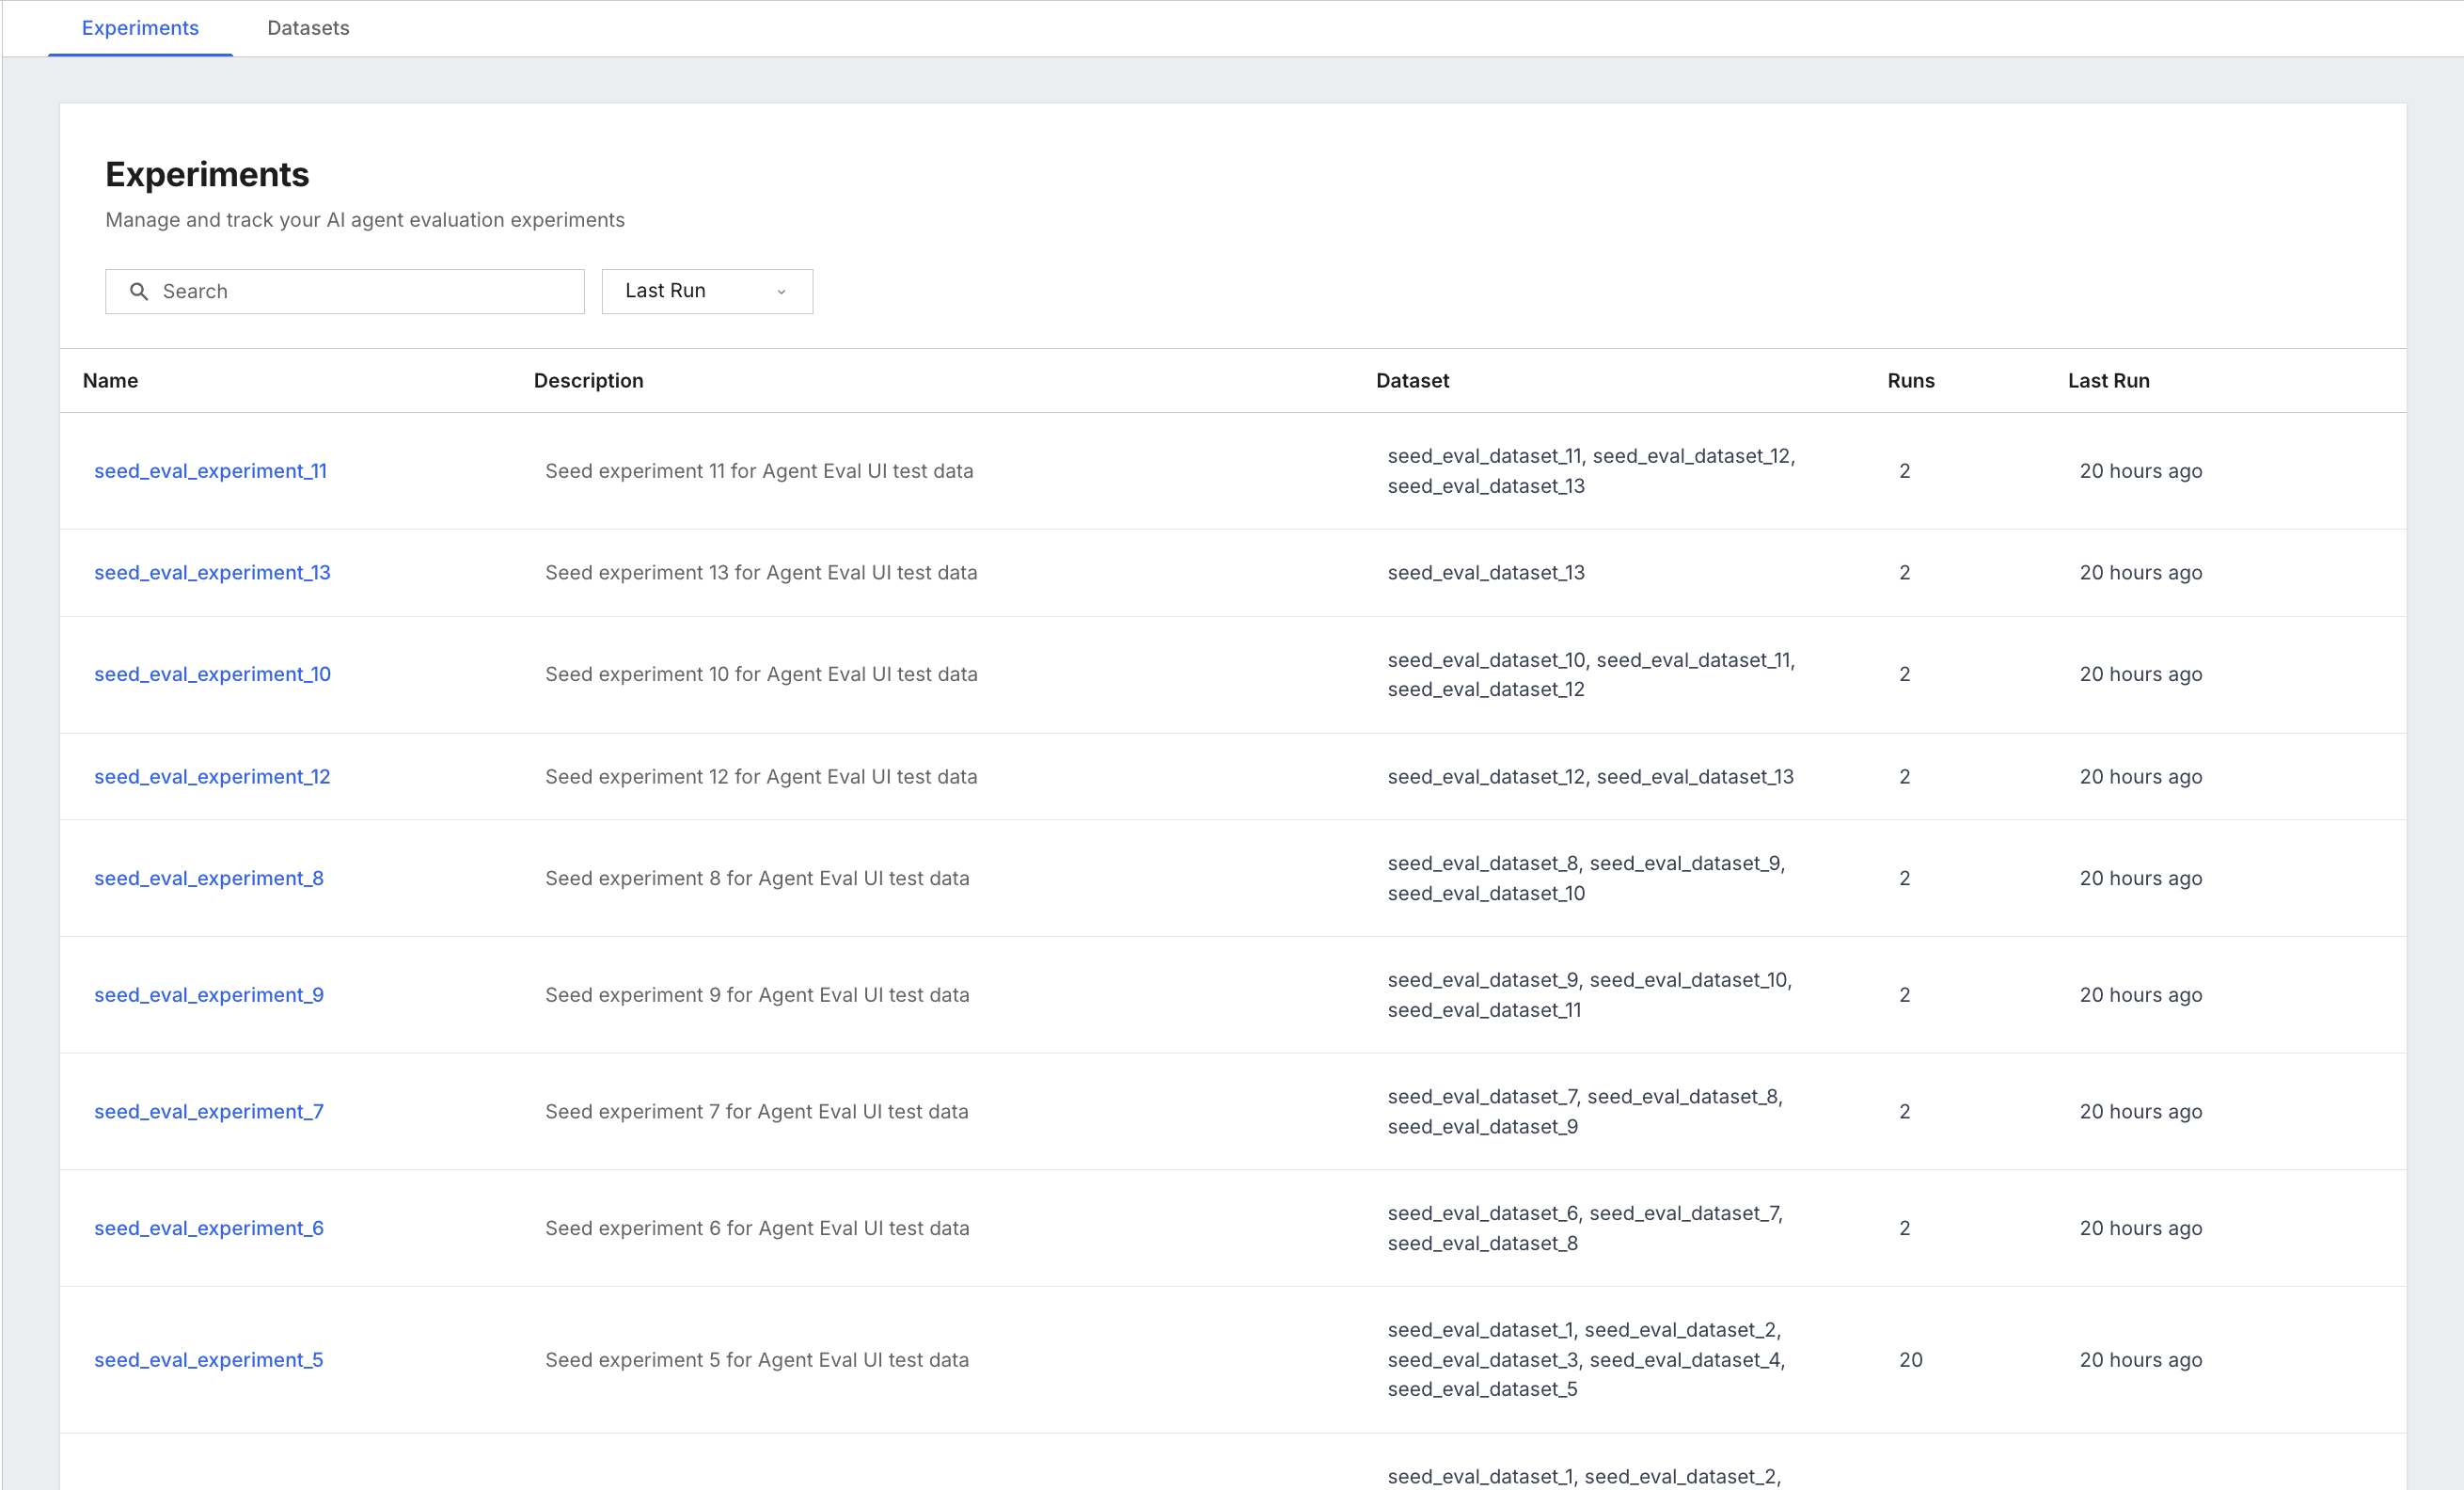
4. Explore experiments and runs
Select the Experiments tab. You see a list of all experiments, with columns for Name, Experiment Description, Associated Datasets, Number of Experiment Runs, and Time of Last Run.
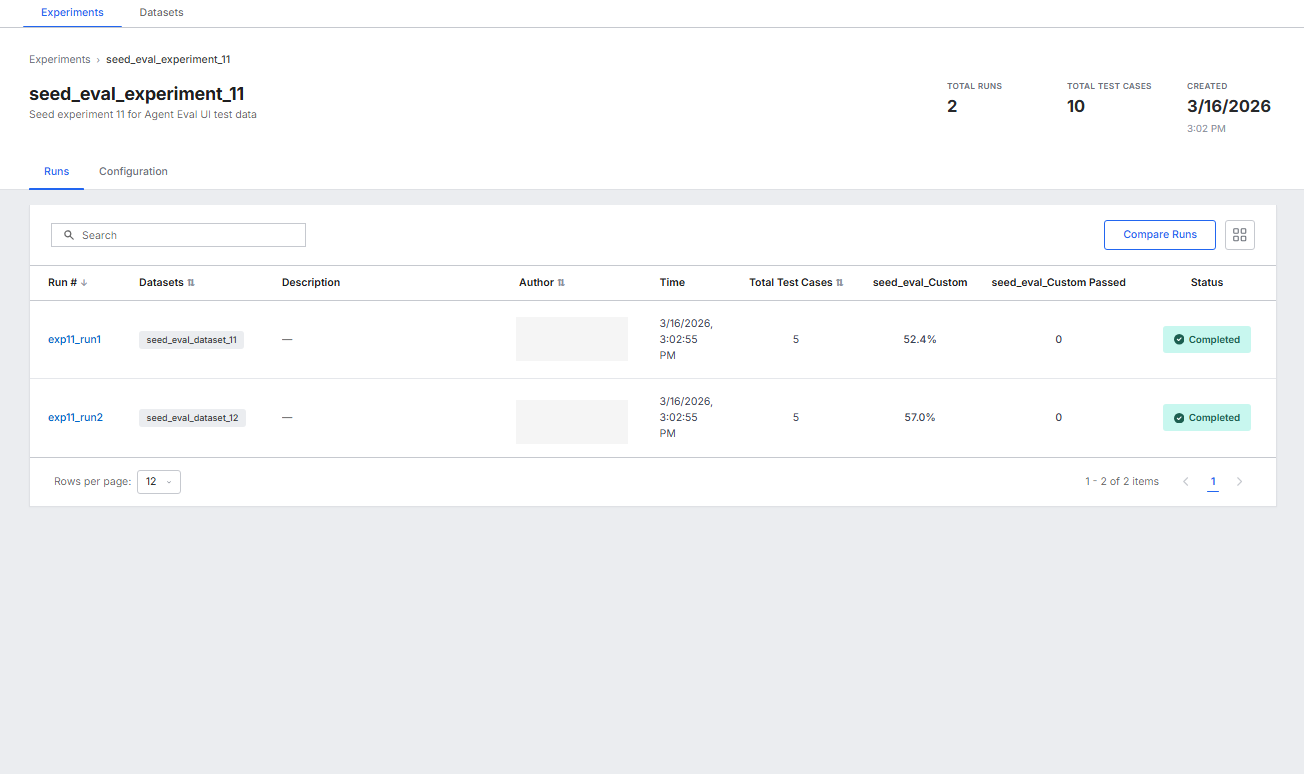
Open an experiment
Select any experiment row to open its detail page. The detail page has two tabs.
Runs tab: The main workspace for analyzing experiment health.
The runs table includes:
| Column | What it shows |
|---|---|
| Run # | Auto-generated run identifier. |
| Datasets | Which dataset this run executed against. |
| Description | Optional description added by the user at time of creation to provide context about the run. |
| Author | The user who triggered the run. |
| Time | Execution timestamp. |
| Total Test Cases | Number of test cases evaluated in this run. |
| Your metric name | Average metric score for the run, shown as a percentage. One column appears per metric. |
| Your metric name Passed | Count of test cases that scored 1.0 for that metric. |
| Status | Completed, Running, Stopped, or Error. |
You can customize which columns are displayed in the runs table. Use the column picker to add, remove, or reorder columns to match your workflow.
What to do here:
- Sort by the metric column to surface the lowest-scoring runs.
- Sort by Run # to see runs in execution order.
- Use search to find a specific run by name.
Configuration tab: Read-only summary of the experiment's datasets and metrics. Check this before comparing runs to confirm both runs used the same metric set and dataset versions.
Drill into a run
Select any Run # link to open Run Detail. This page shows one row per test-case result. The table displays all fields from the test case (such as Input, Output, Expected, and any other fields present), along with a Status column (OK or ERROR) and per-metric score columns.
Sort by the metric column (lowest first) to find the worst-performing test cases. Then select a Test Case ID to open the detail page with metric reasons and the execution trace.
Inspect a test case
Selecting a test case opens two tabs.
Evaluation Overview: A table of metric results for this test case. Each row shows the metric name, score, and the reason text explaining why the metric scored the way it did. This is where you understand why a metric scored low.
Analysis: Trace-based debugging view. If tracing is enabled for the agent, you see a Span Tree and a Span Table. Select any span to inspect its inputs, outputs, duration, tokens, and attributes. This is where you identify which step in the agent's reasoning chain caused a quality issue. For more details on tracing configuration, see Observability and Monitoring Overview.
If the Analysis tab appears empty, confirm that tracing was enabled for the agent when the run was created. See Observability and Monitoring Overview for tracing setup.
5. Compare two runs
Compare Runs lets you do an in-depth side-by-side analysis of two runs. Use it after you make a change to your agent (prompt, model, tool, or retrieval strategy) to understand exactly which test cases improved or regressed and by how much.
Select runs to compare
- From the Runs tab of an experiment, select Compare Runs.
- Check the checkboxes for exactly two runs.
- Select Compare.
For the most meaningful comparison, choose two runs that used the same dataset. The compare view works across different datasets, but the test-case overlap will be partial.
Read the comparison results
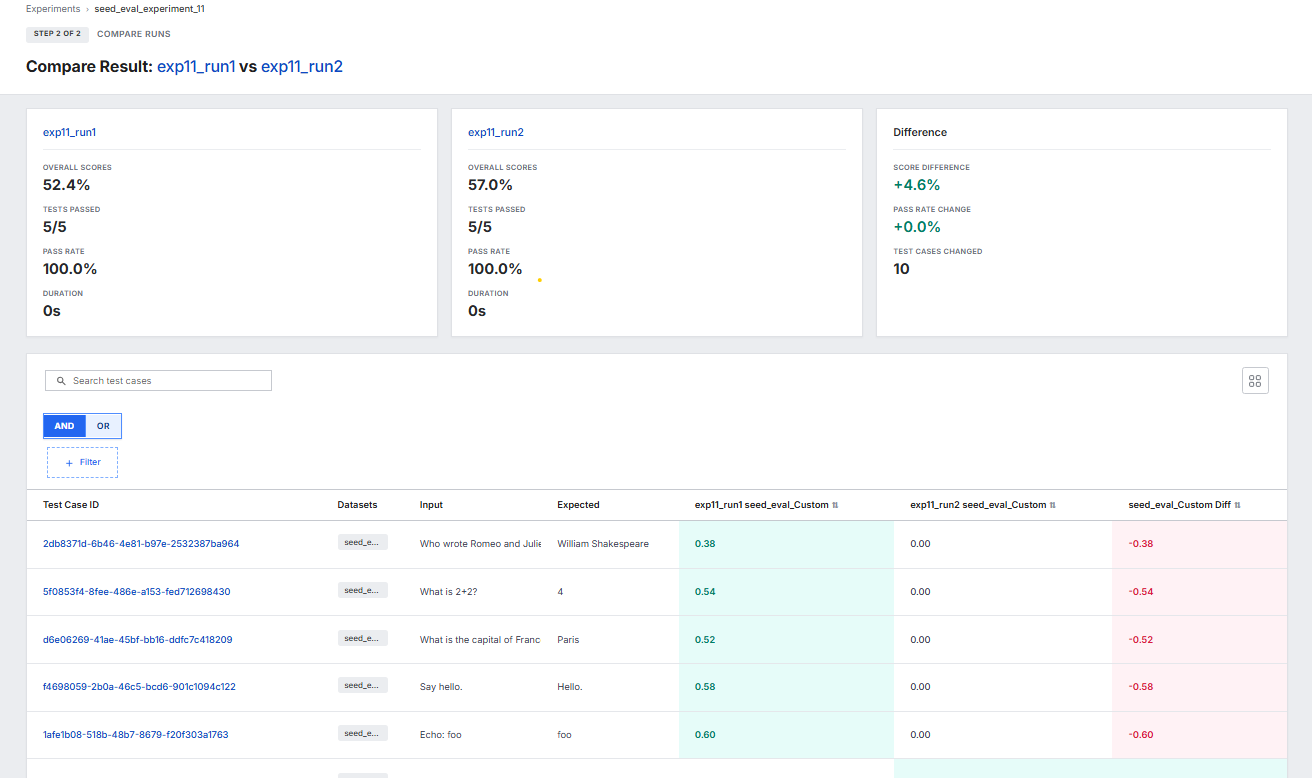
The comparison page shows three summary cards at the top:
- Run A card: overall score, tests passed, pass rate, duration.
- Run B card: the same metrics for the second run.
- Difference card: score difference (positive values indicate improvement), pass rate change, and total test cases changed.
Below the cards, a test-case table lists every test case that appeared in either run. Columns include Test Case ID, Datasets, Input, Expected, a score column per metric for each run, and a diff column per metric.
What to do here:
- Filter by changed status first. Select + Filter, set Status is Changed, and apply. This removes unchanged test cases from view so you focus on cases that actually moved.
- Sort by the diff column. The diff column for your metric lets you rank test cases by the magnitude of change. Sort descending to see the biggest improvements; sort ascending to see the biggest regressions.
- Select a changed row. Select a test-case row to open a comparison modal with per-metric deltas and direct links to the test-case detail page for each run. Use these links to open the Analysis tab and compare the execution traces.
Change or exit compare mode
- Change Run Selection: returns to the run selection step so you can pick different runs.
- Cancel: returns to the Runs tab.