My Usage and Cost
The My Usage and Cost page shows what you have spent and how much of each quota you have used. A quota is your limit for applications, workspaces, deployments, and a monthly LLM budget. Open your profile menu and select My Usage and Cost.
The page leads with your total spend and your resource quotas. Three sections then break down where the cost comes from: token cost and usage, compute runtime and cost, and a per-workspace total. When you reach a limit, you request more from this page, and the My Requests page tracks each request until a decision arrives.
Read your total spend
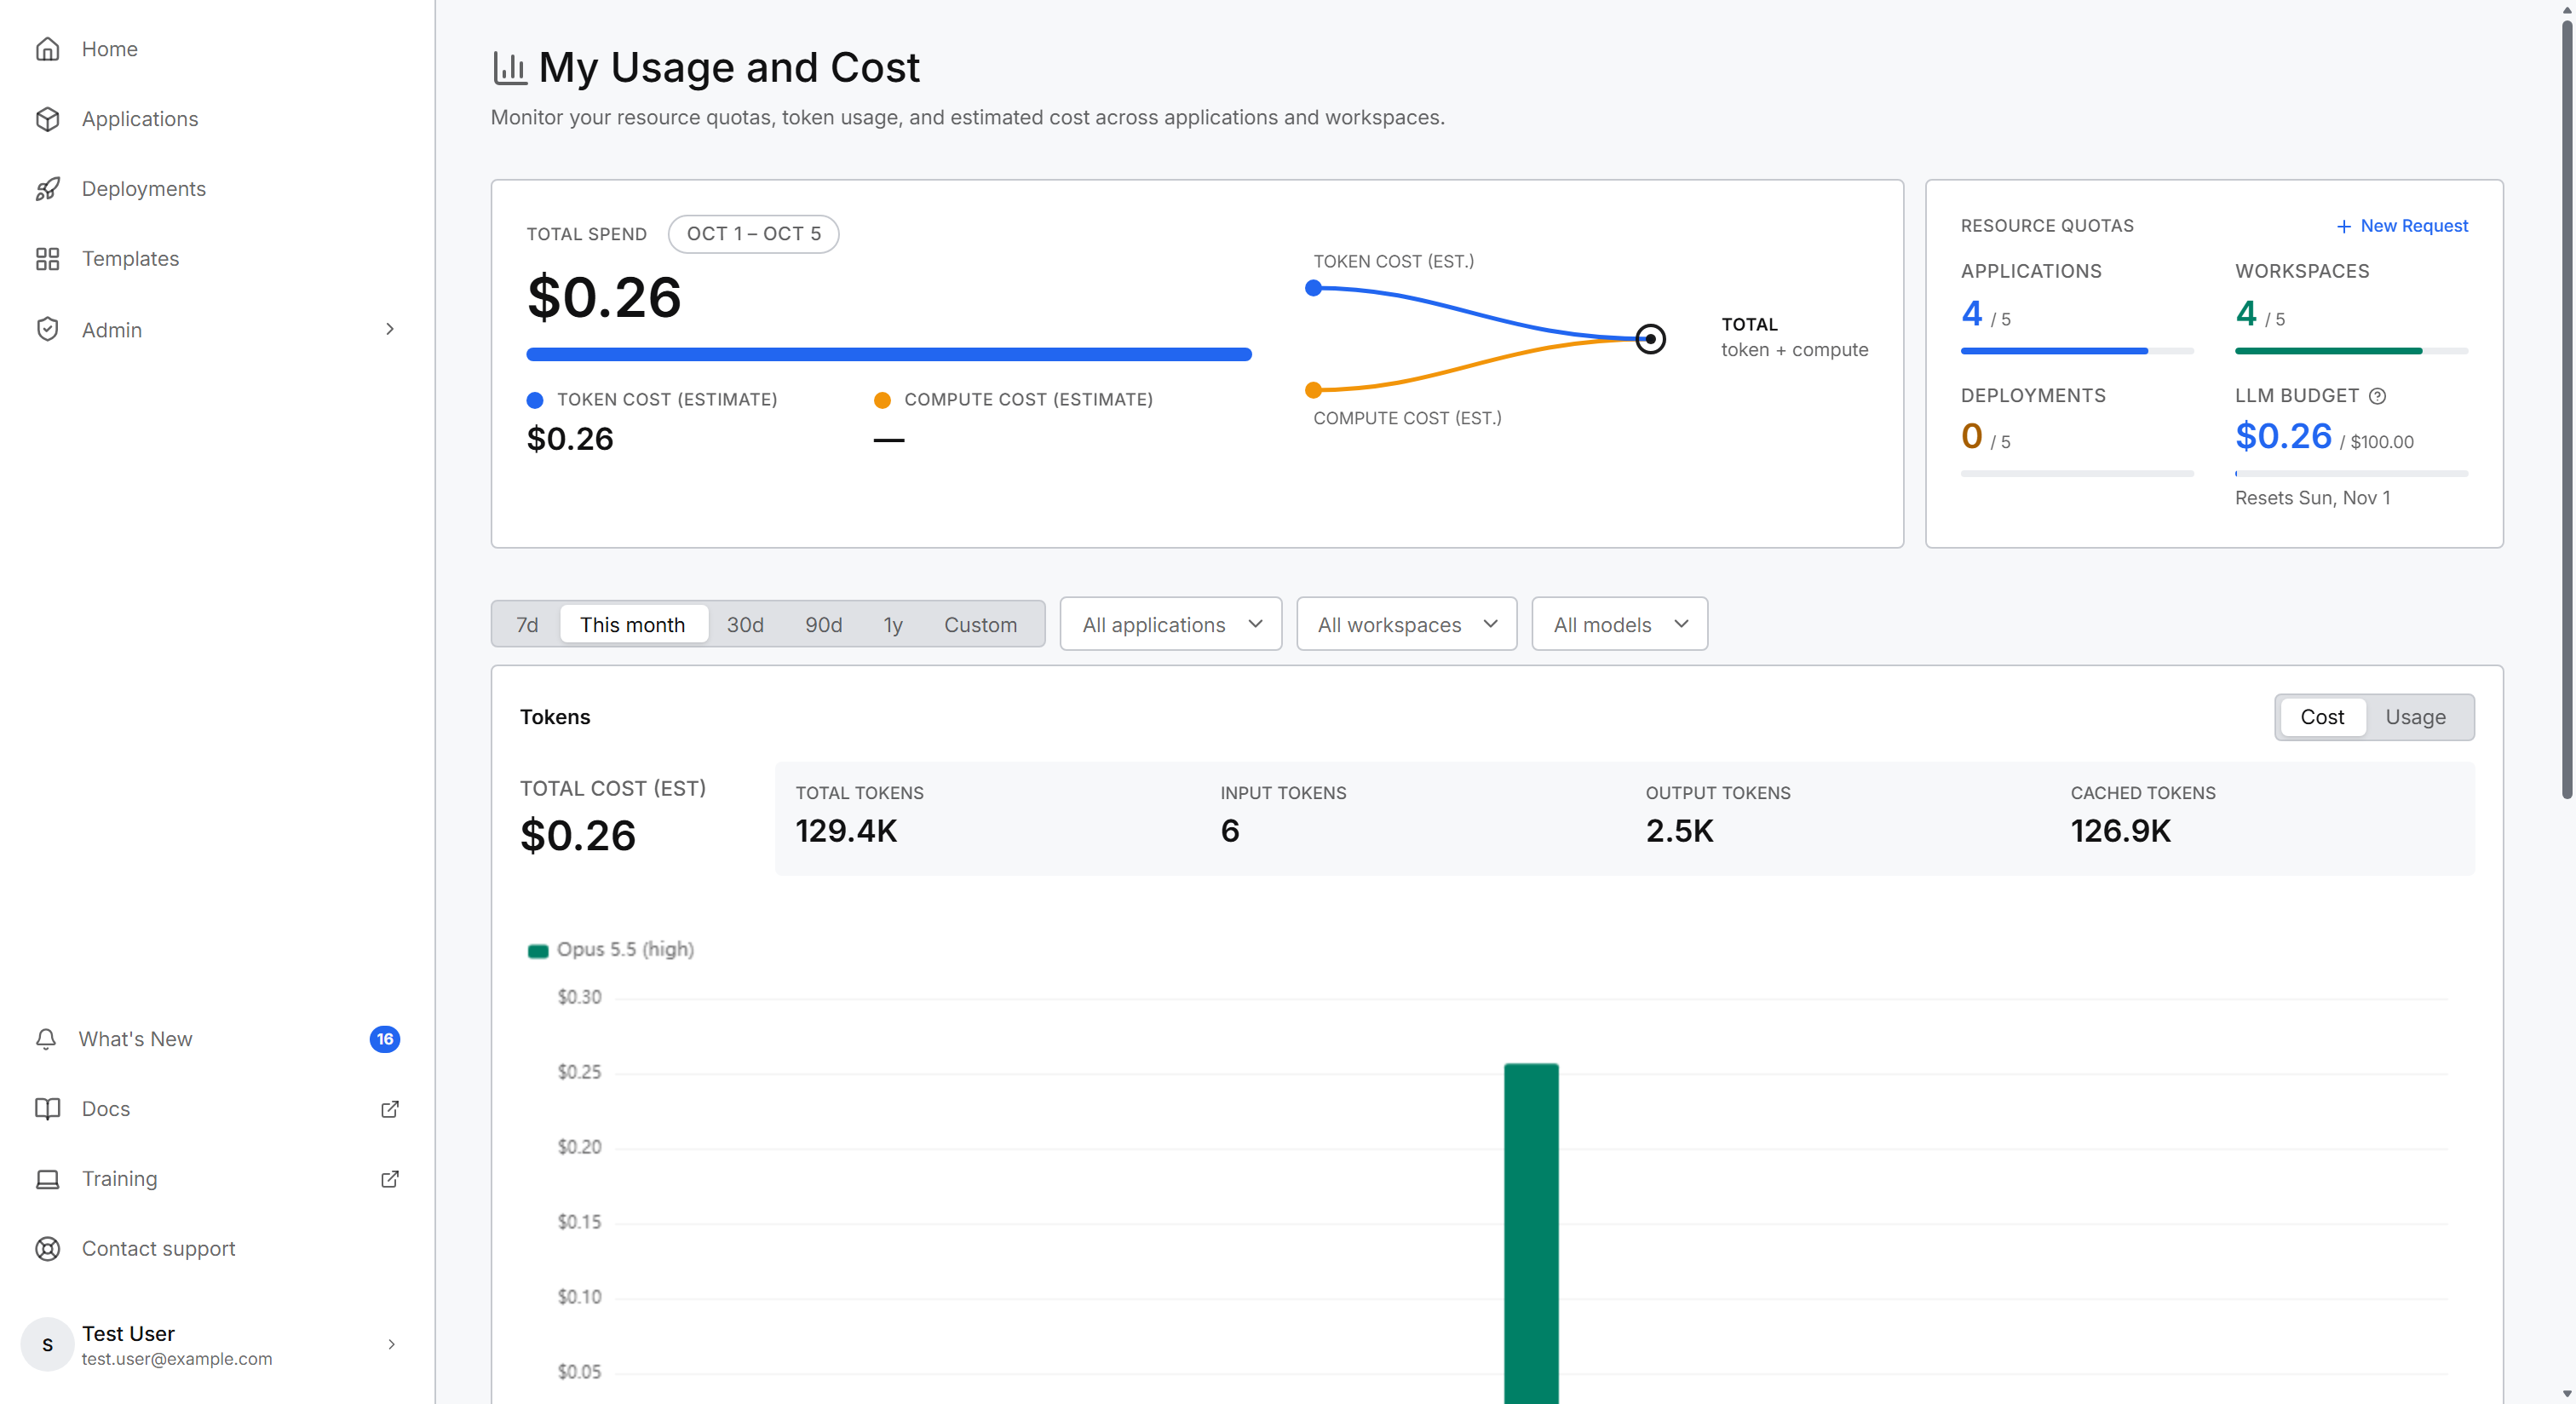
The Total Spend card shows your cost for the current month, combining token cost and compute cost into one figure. The date chip names the month-to-date range the figure covers, and a progress bar tracks it.
Two readings split the total:
- Token Cost (estimate): what your token usage costs.
- Compute Cost (estimate): what the vCPU and vGPU runtime behind your workspaces costs.
The period buttons lower on the page change the breakdown sections, not this card. Total spend always covers the current month.
Check your resource quotas
The Resource Quotas card holds a tile for each of four resources, and each tile shows your usage against its limit:
- Applications: applications you own.
- Workspaces: workspaces you own.
- Deployments: deployments you own.
- LLM Budget: your estimated LLM spend for the current month, shown in dollars against a monthly budget that resets on the date the card names.
To see exactly what counts against a quota, select the count on the Applications, Workspaces, or Deployments tile. A list opens with your current quota and every item that counts, and each item links to the place where it lives:
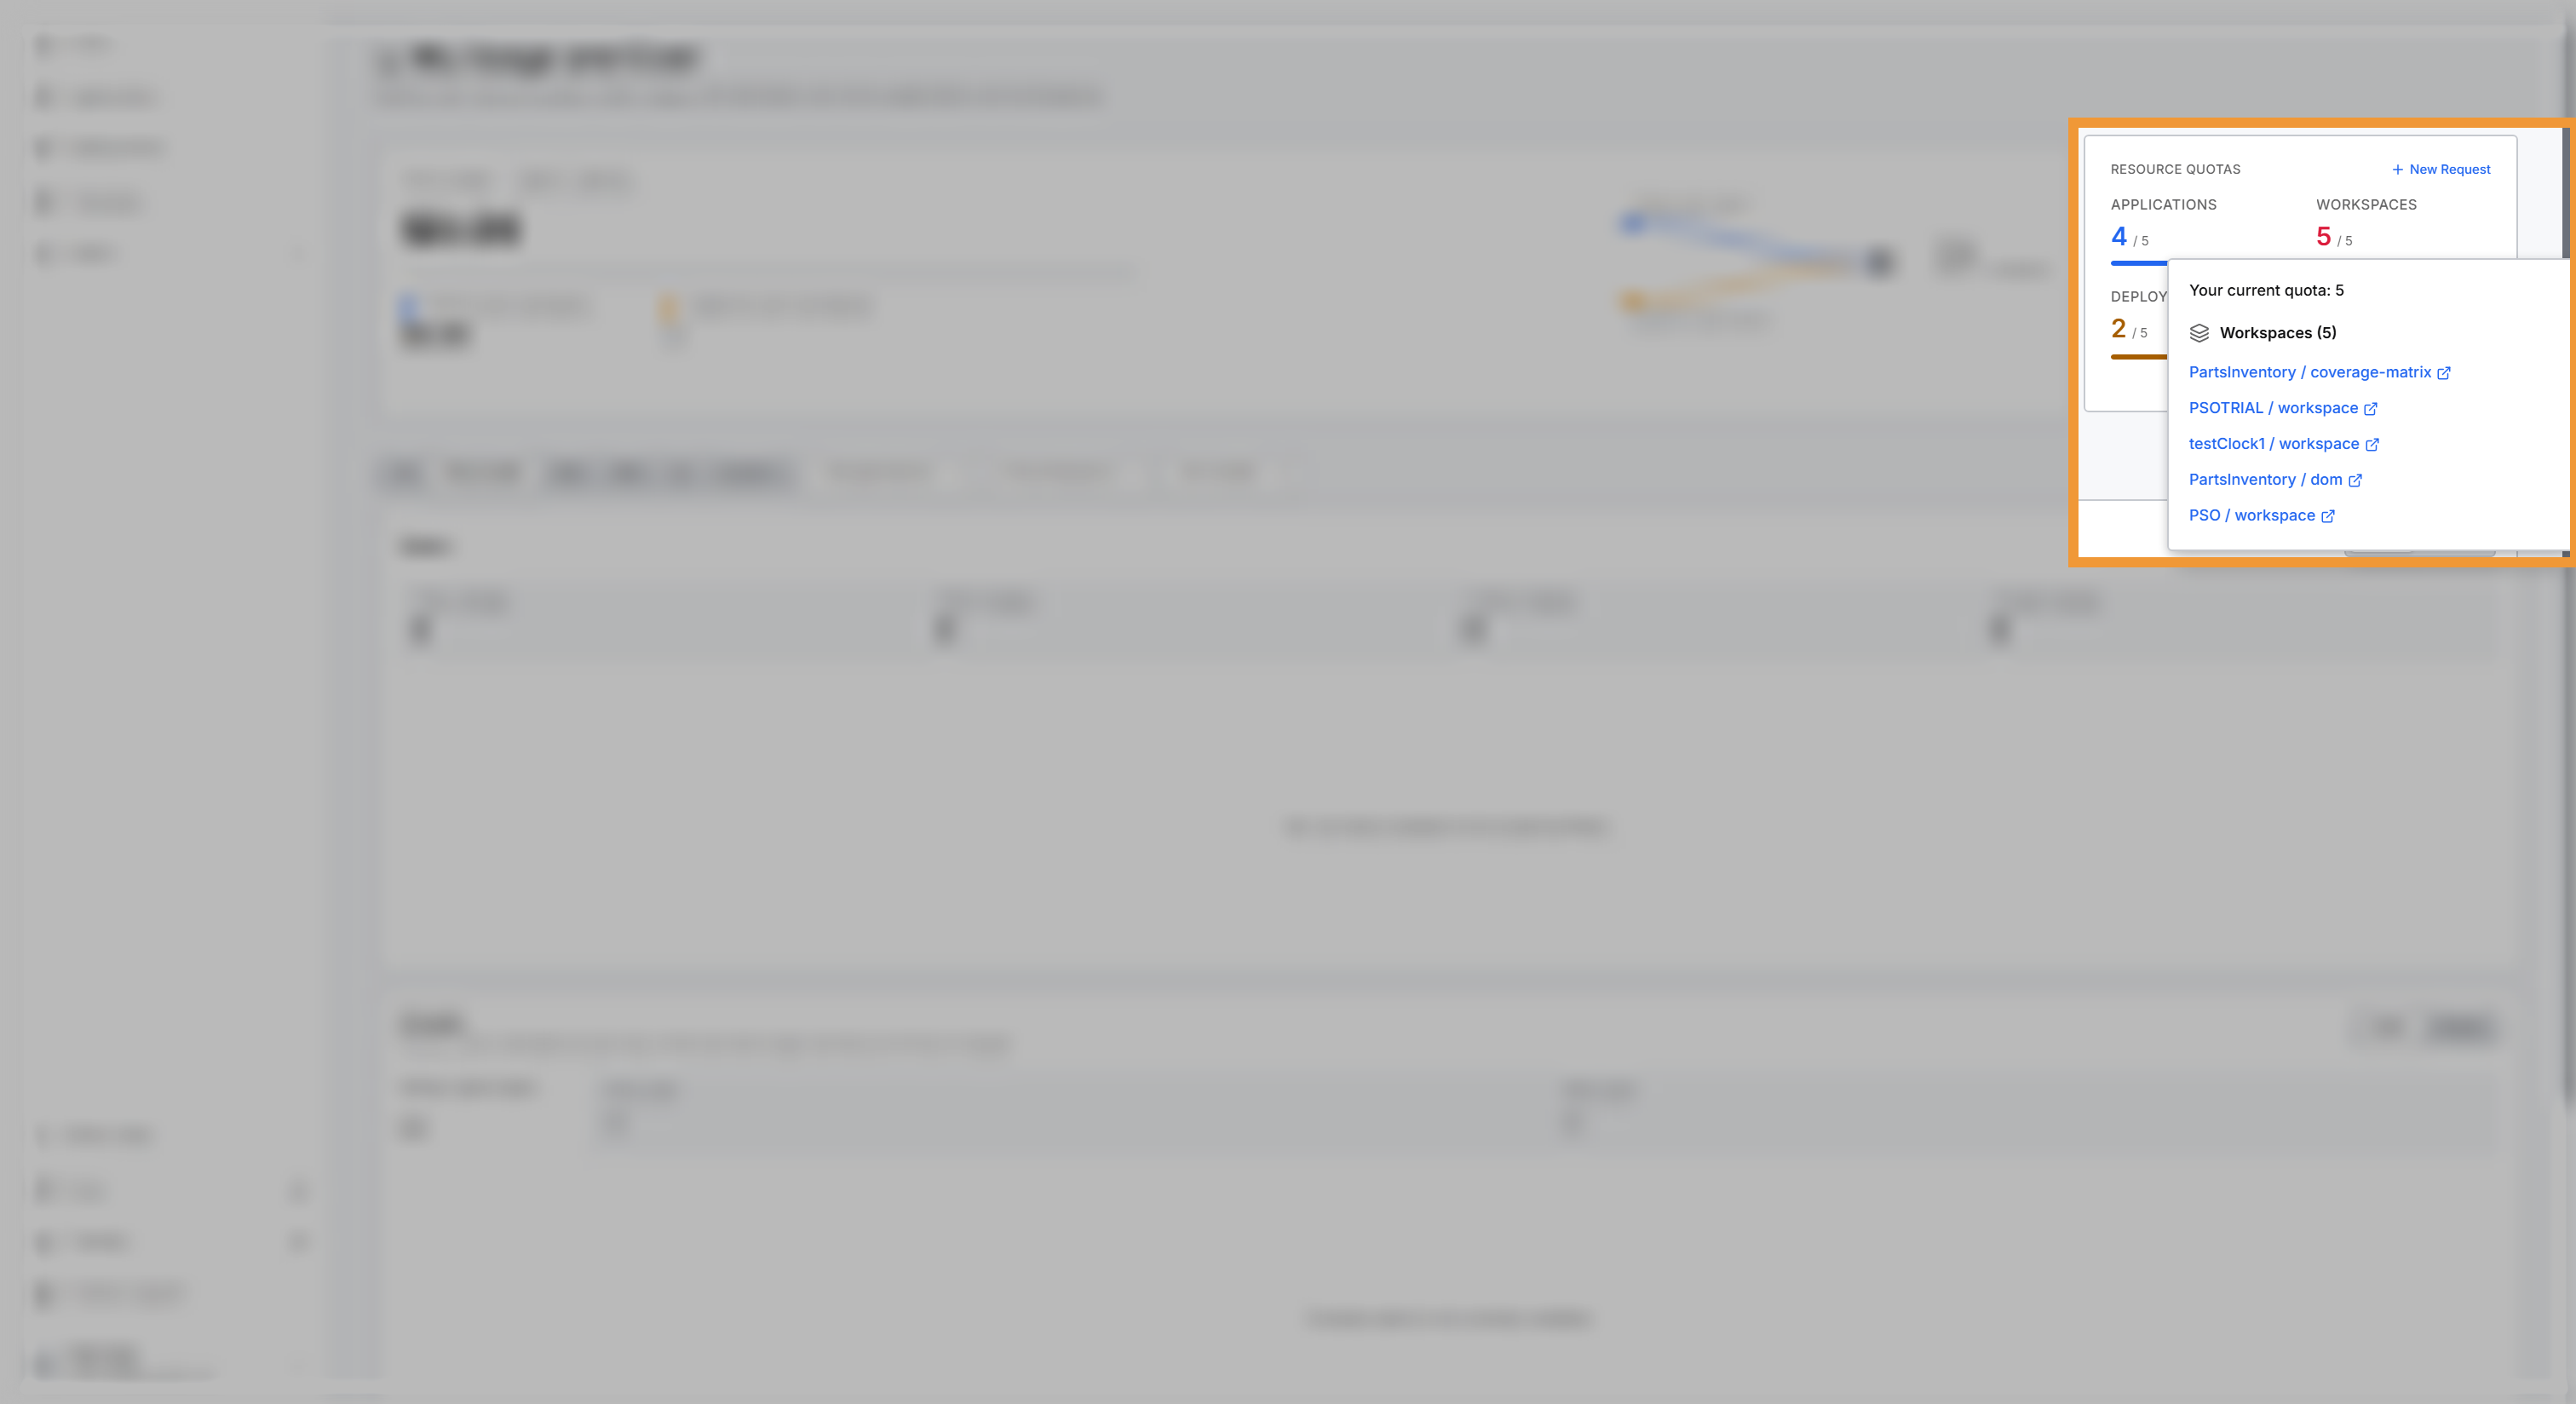
Reaching a limit stops the matching action, and C3 Code names the quota you reached. Select New Request on this card to ask an administrator for more.
C3 Code warns you in the chat before you reach your LLM Budget. A banner appears in the chat panel when your spend this month reaches 75% of the budget, and again at 90%. The banner shows the percentage you have used and the dollar amounts, and suggests a lower-cost model to make the rest of the budget last. C3 Code updates the figures as you send messages.
The banner links to this page so you can request an increase. Dismiss hides the banner for that threshold until the next month, or until your budget changes. Once you reach the budget, a message that the budget is exceeded replaces the banner.
Each workspace runs in a single-node environment (SNE), and each deployment runs in a multi-node environment (MNE). Environments you created outside C3 Code, such as in C3 AI Studio, also count against these limits. When you have any, the tile title reads Workspaces + SNEs or Deployments + MNEs. The tile's list shows those environments in a group of their own. Remove an environment you no longer need, or ask an administrator to raise your limit.
Look for a workspace or a deployment you no longer need before requesting more. Removing one frees the space immediately, whereas a request waits for review.
Workspaces are the quota people reach first. Add a second workspace when two people build at the same time, or when one large change should not disturb what already works.
For working in more than one workspace, see Use Multiple Workspaces for One App.
Filter the cost and usage views
Four controls narrow the breakdown sections below the quotas: token cost and usage, compute, and the per-workspace total. The Compute card has no model filter, so All models narrows only the other two sections. The controls leave the total spend and the quotas unchanged.
- Time range: 7 days, This month, 30 days, 90 days, 1 year, or a range you set. The page opens on This month, so the breakdown sections match the total spend.
- All applications: narrows to the applications you pick.
- All workspaces: narrows to the workspaces you pick.
- All models: narrows to the models you pick.
Token cost and usage
The Tokens card shows five figures for the range you selected, and a chart with one color for each model. The Cost and Usage toggle changes only the chart: Cost plots the estimated dollar cost, and Usage plots the token counts.
The card leads with Total Cost (Est), followed by four token figures:
- Total Tokens: every token in the range.
- Input Tokens: tokens sent to the model.
- Output Tokens: tokens the model produced.
- Cached Tokens: everything else, which is reasoning together with cache reads and writes.
How usage counts toward your LLM Budget
Your LLM Budget is a dollar limit, not a token count. The estimated cost of your token usage counts toward it. The Total Cost (Est) on the Tokens card therefore tracks the amount spent against your LLM Budget.
Total Tokens counts every token, including the cached-token group that reasoning and cache traffic dominate, so it runs into the millions. The LLM Budget instead tracks what that usage costs in dollars at each model's own price, so a cheaper model spends less of your budget than a more expensive one for the same raw token count.
Use the model filter to see which models are spending your budget. Moving routine work to a cheaper model stretches the same budget.
Compute cost and runtime
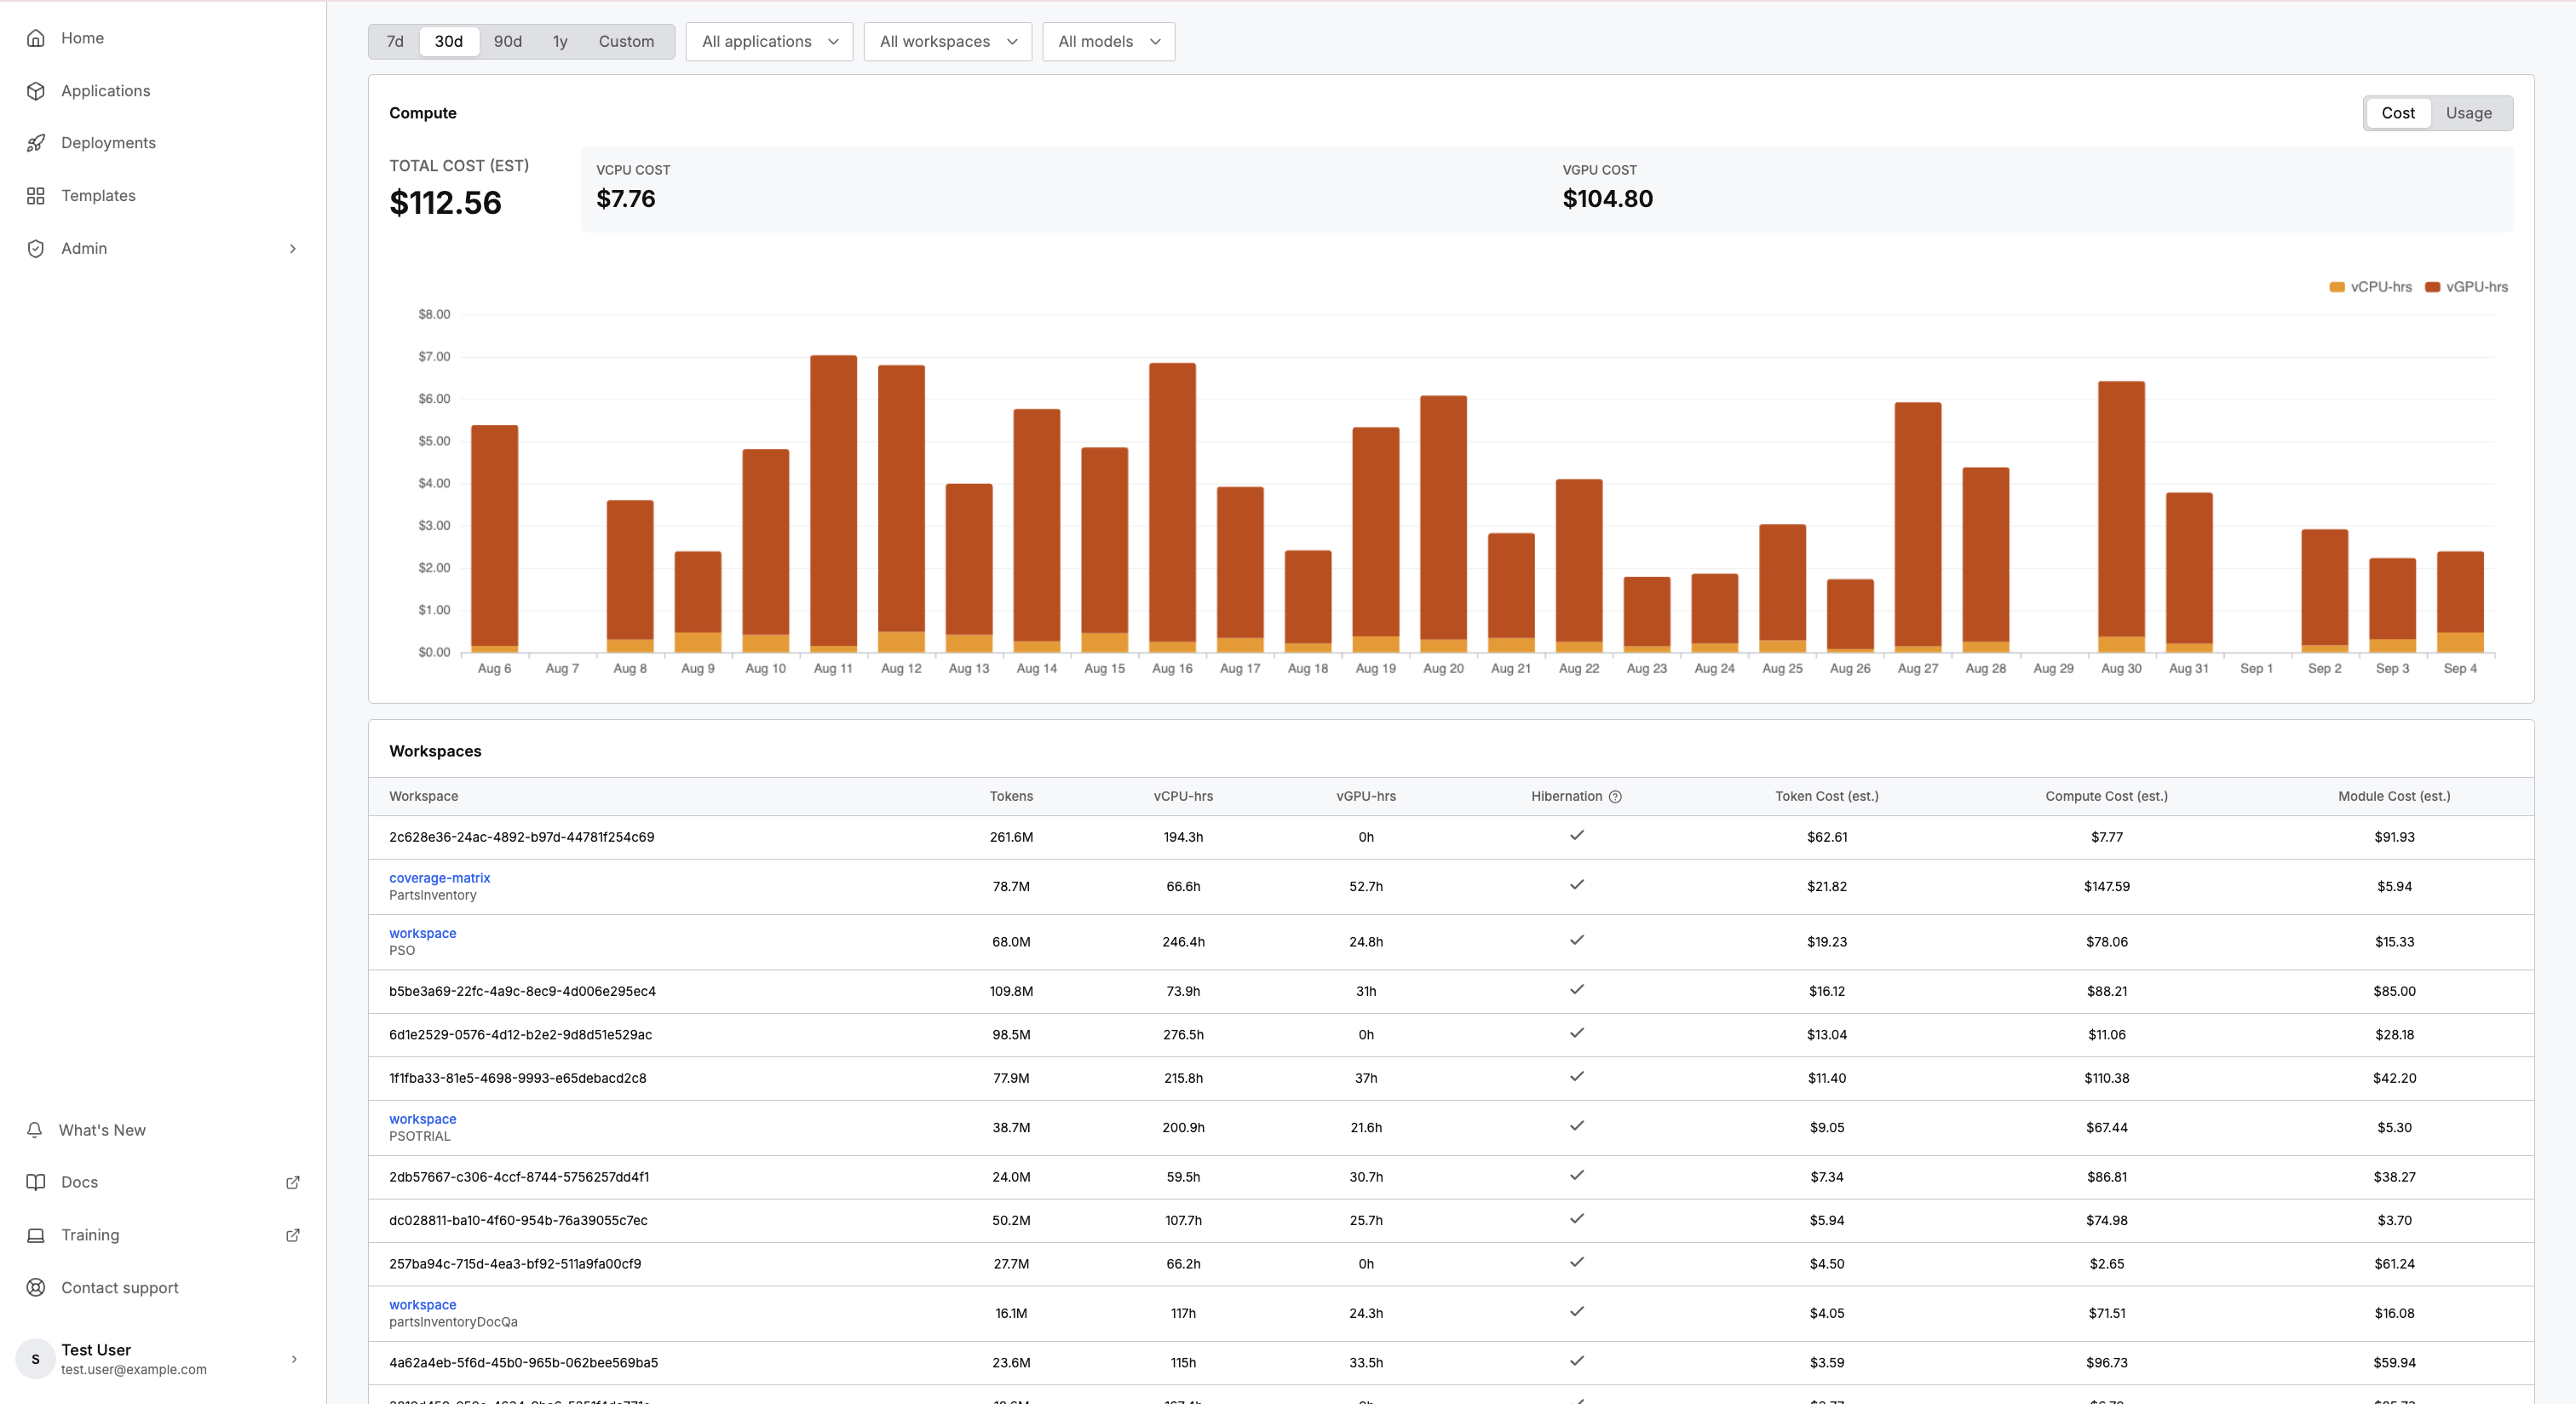
The Compute card reports the runtime behind your workspaces, with the same Cost and Usage toggle. Cost shows vCPU Cost and vGPU Cost, and Usage shows vCPU Hours and vGPU Hours. A chart plots the range you selected.
vCPU is the processor time your workspaces use, and vGPU is the graphics-processor time. Together they make up the compute cost that feeds your total spend.
C3 Code calculates compute cost once per day, so your most recent usage can take up to 24 hours to appear on this card.
Cost by workspace
The Workspaces table breaks the cost down by workspace, so you can find the workspace that drives your cost. Each row carries:
- Tokens, vCPU-hrs, and vGPU-hrs: what the workspace used.
- Hibernation: whether the workspace hibernates when no one is using it.
- Token Cost (est.): the estimated cost of the workspace's token usage.
- Compute Cost (est.): the estimated cost of the workspace's vCPU and vGPU time.
- Module Cost (est.): the estimated cost of the platform modules the workspace runs.
A total row sums each column for the workspaces that match your search.
To find a workspace quickly, search by workspace or application name. Select a column heading to sort by that column, and select it again to reverse the order. A table with more than 10 workspaces splits into pages of 10, 25, or 50 rows.
A workspace you deleted still appears while it has usage in the range you selected. Its row shows the workspace's last name, marked Removed, so its cost still counts toward your total.
Request more resources
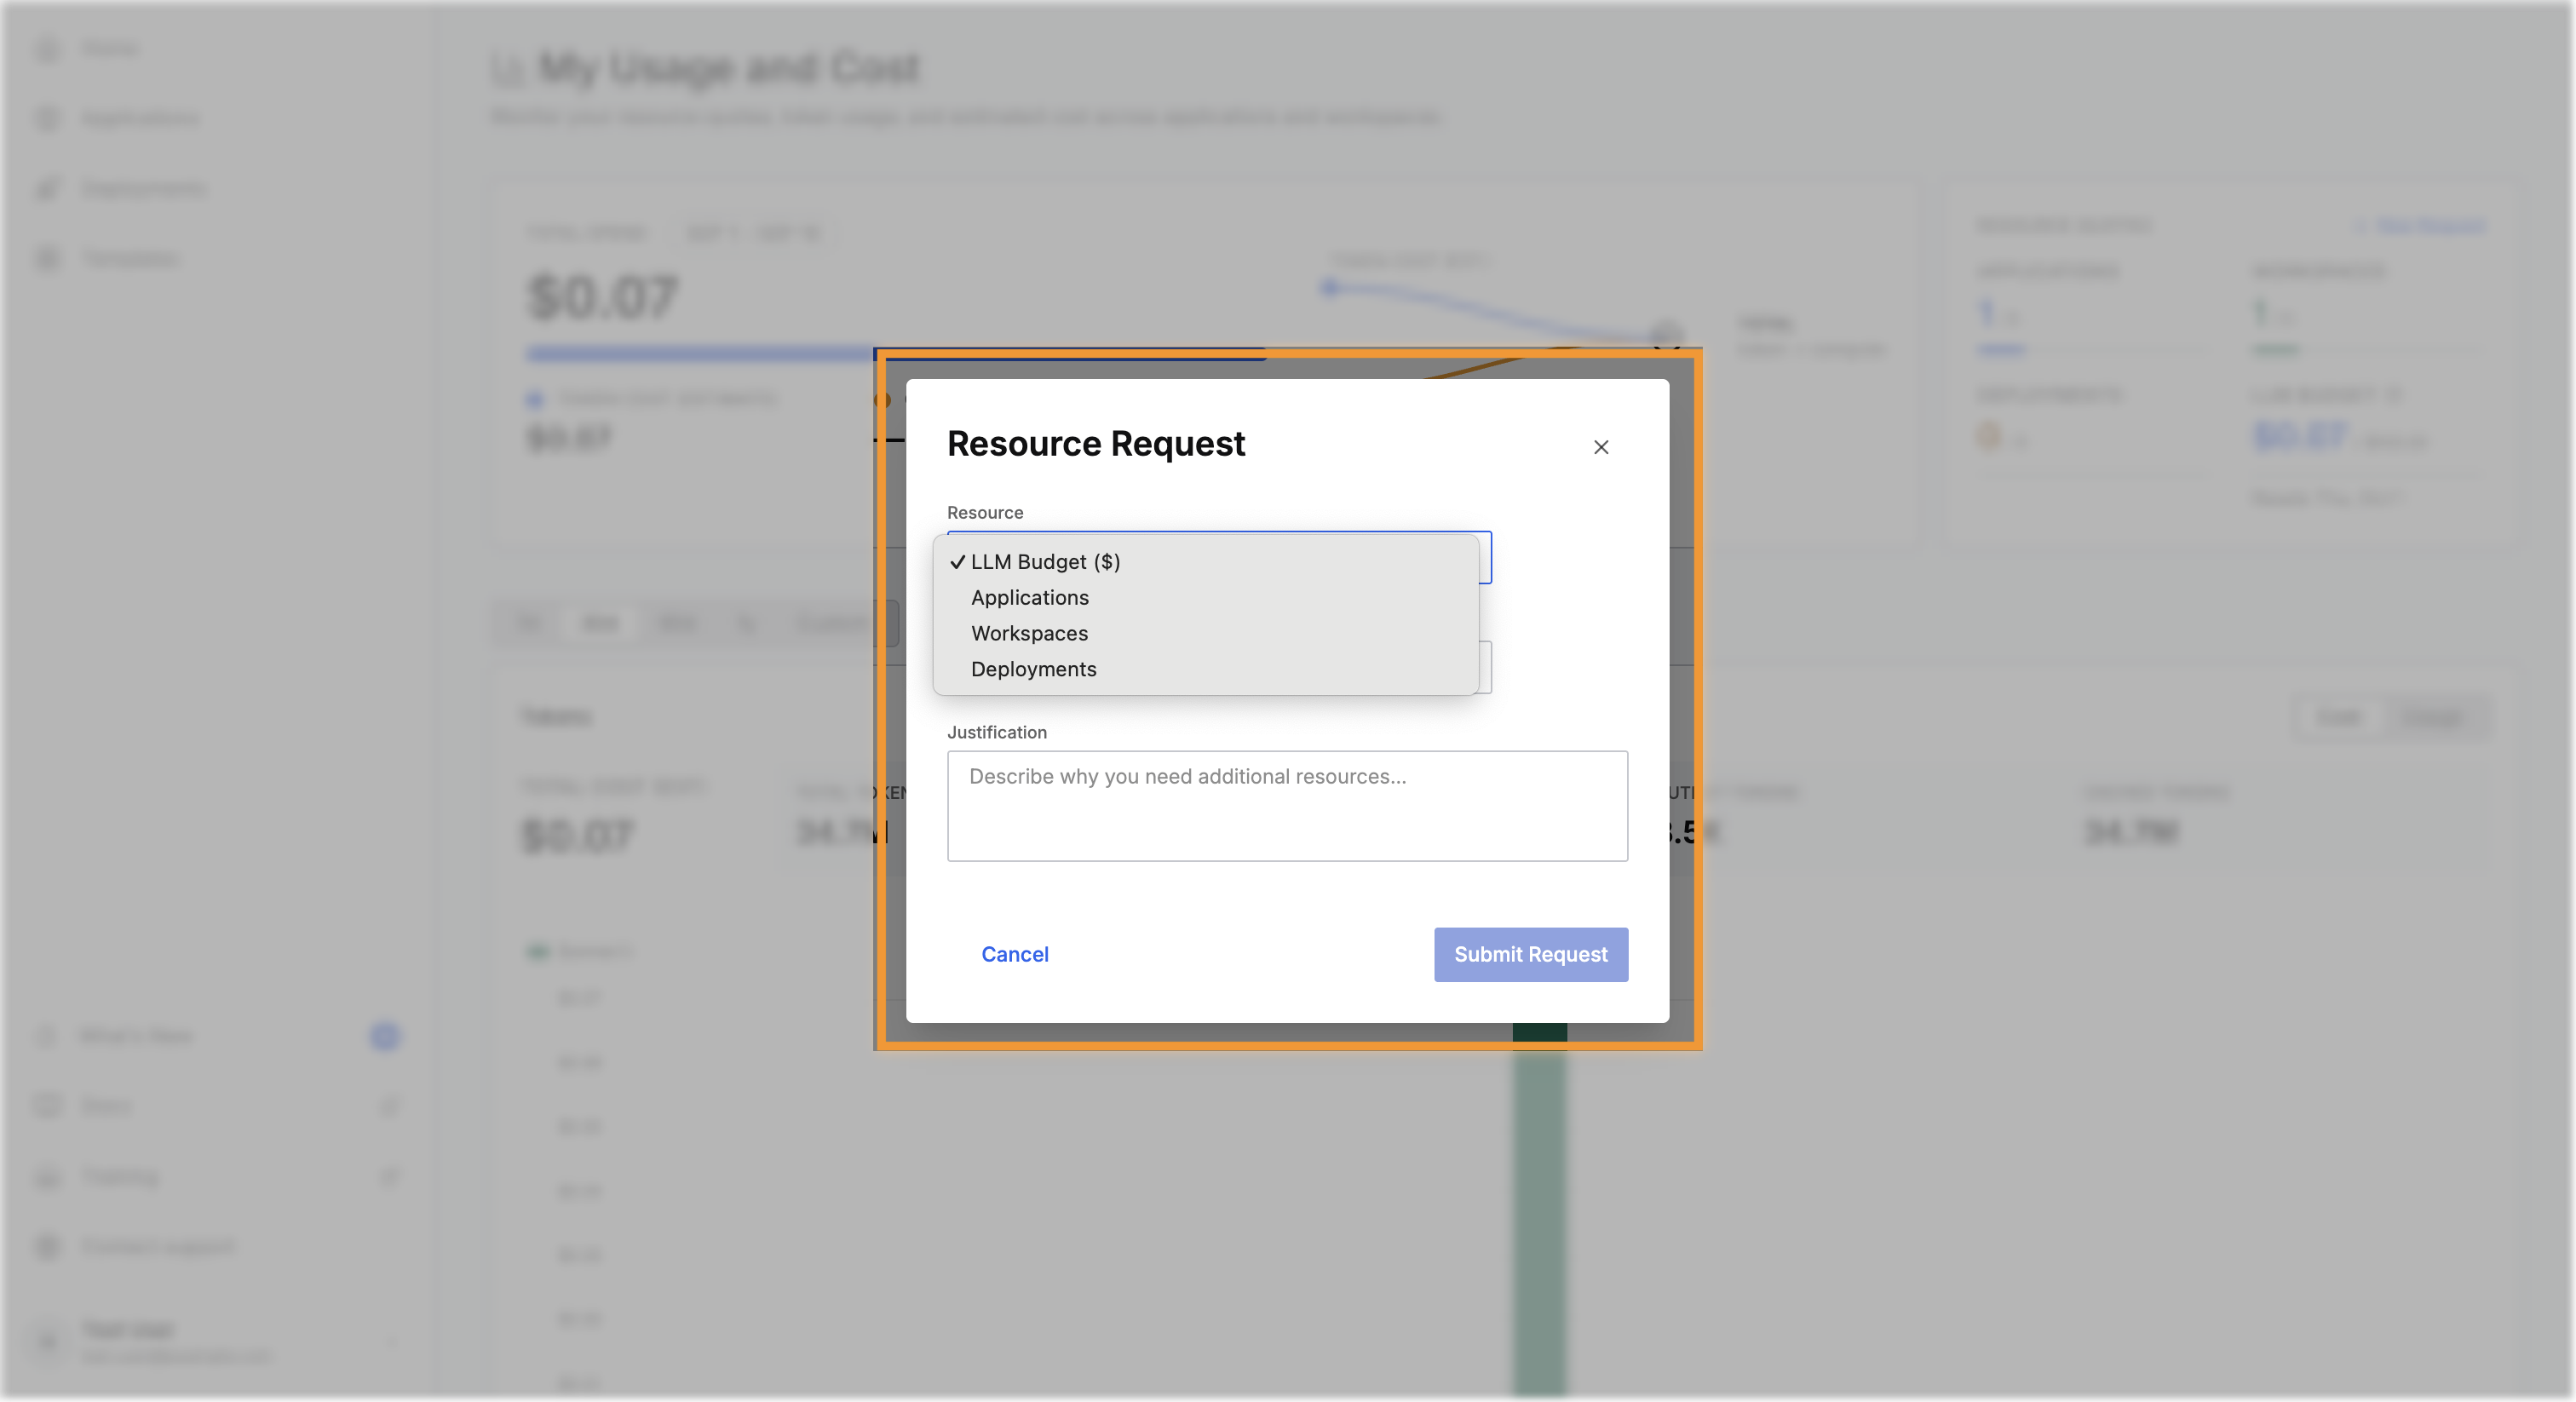
Submit a request from this page when you reach a limit:
- Select New Request.
- Choose the Resource: LLM Budget ($), Applications, Workspaces, or Deployments.
- Enter the Additional Amount you need.
- Write a Justification. An administrator reads the justification and decides the outcome.
- Select Submit Request.
An administrator can approve a different amount than you requested, so state what you need and why, instead of inflating the number.
Track your requests
The My Requests page lists every request you have submitted, with the current status of each. Filter by All, Pending, Approved, or Rejected, or search by resource.
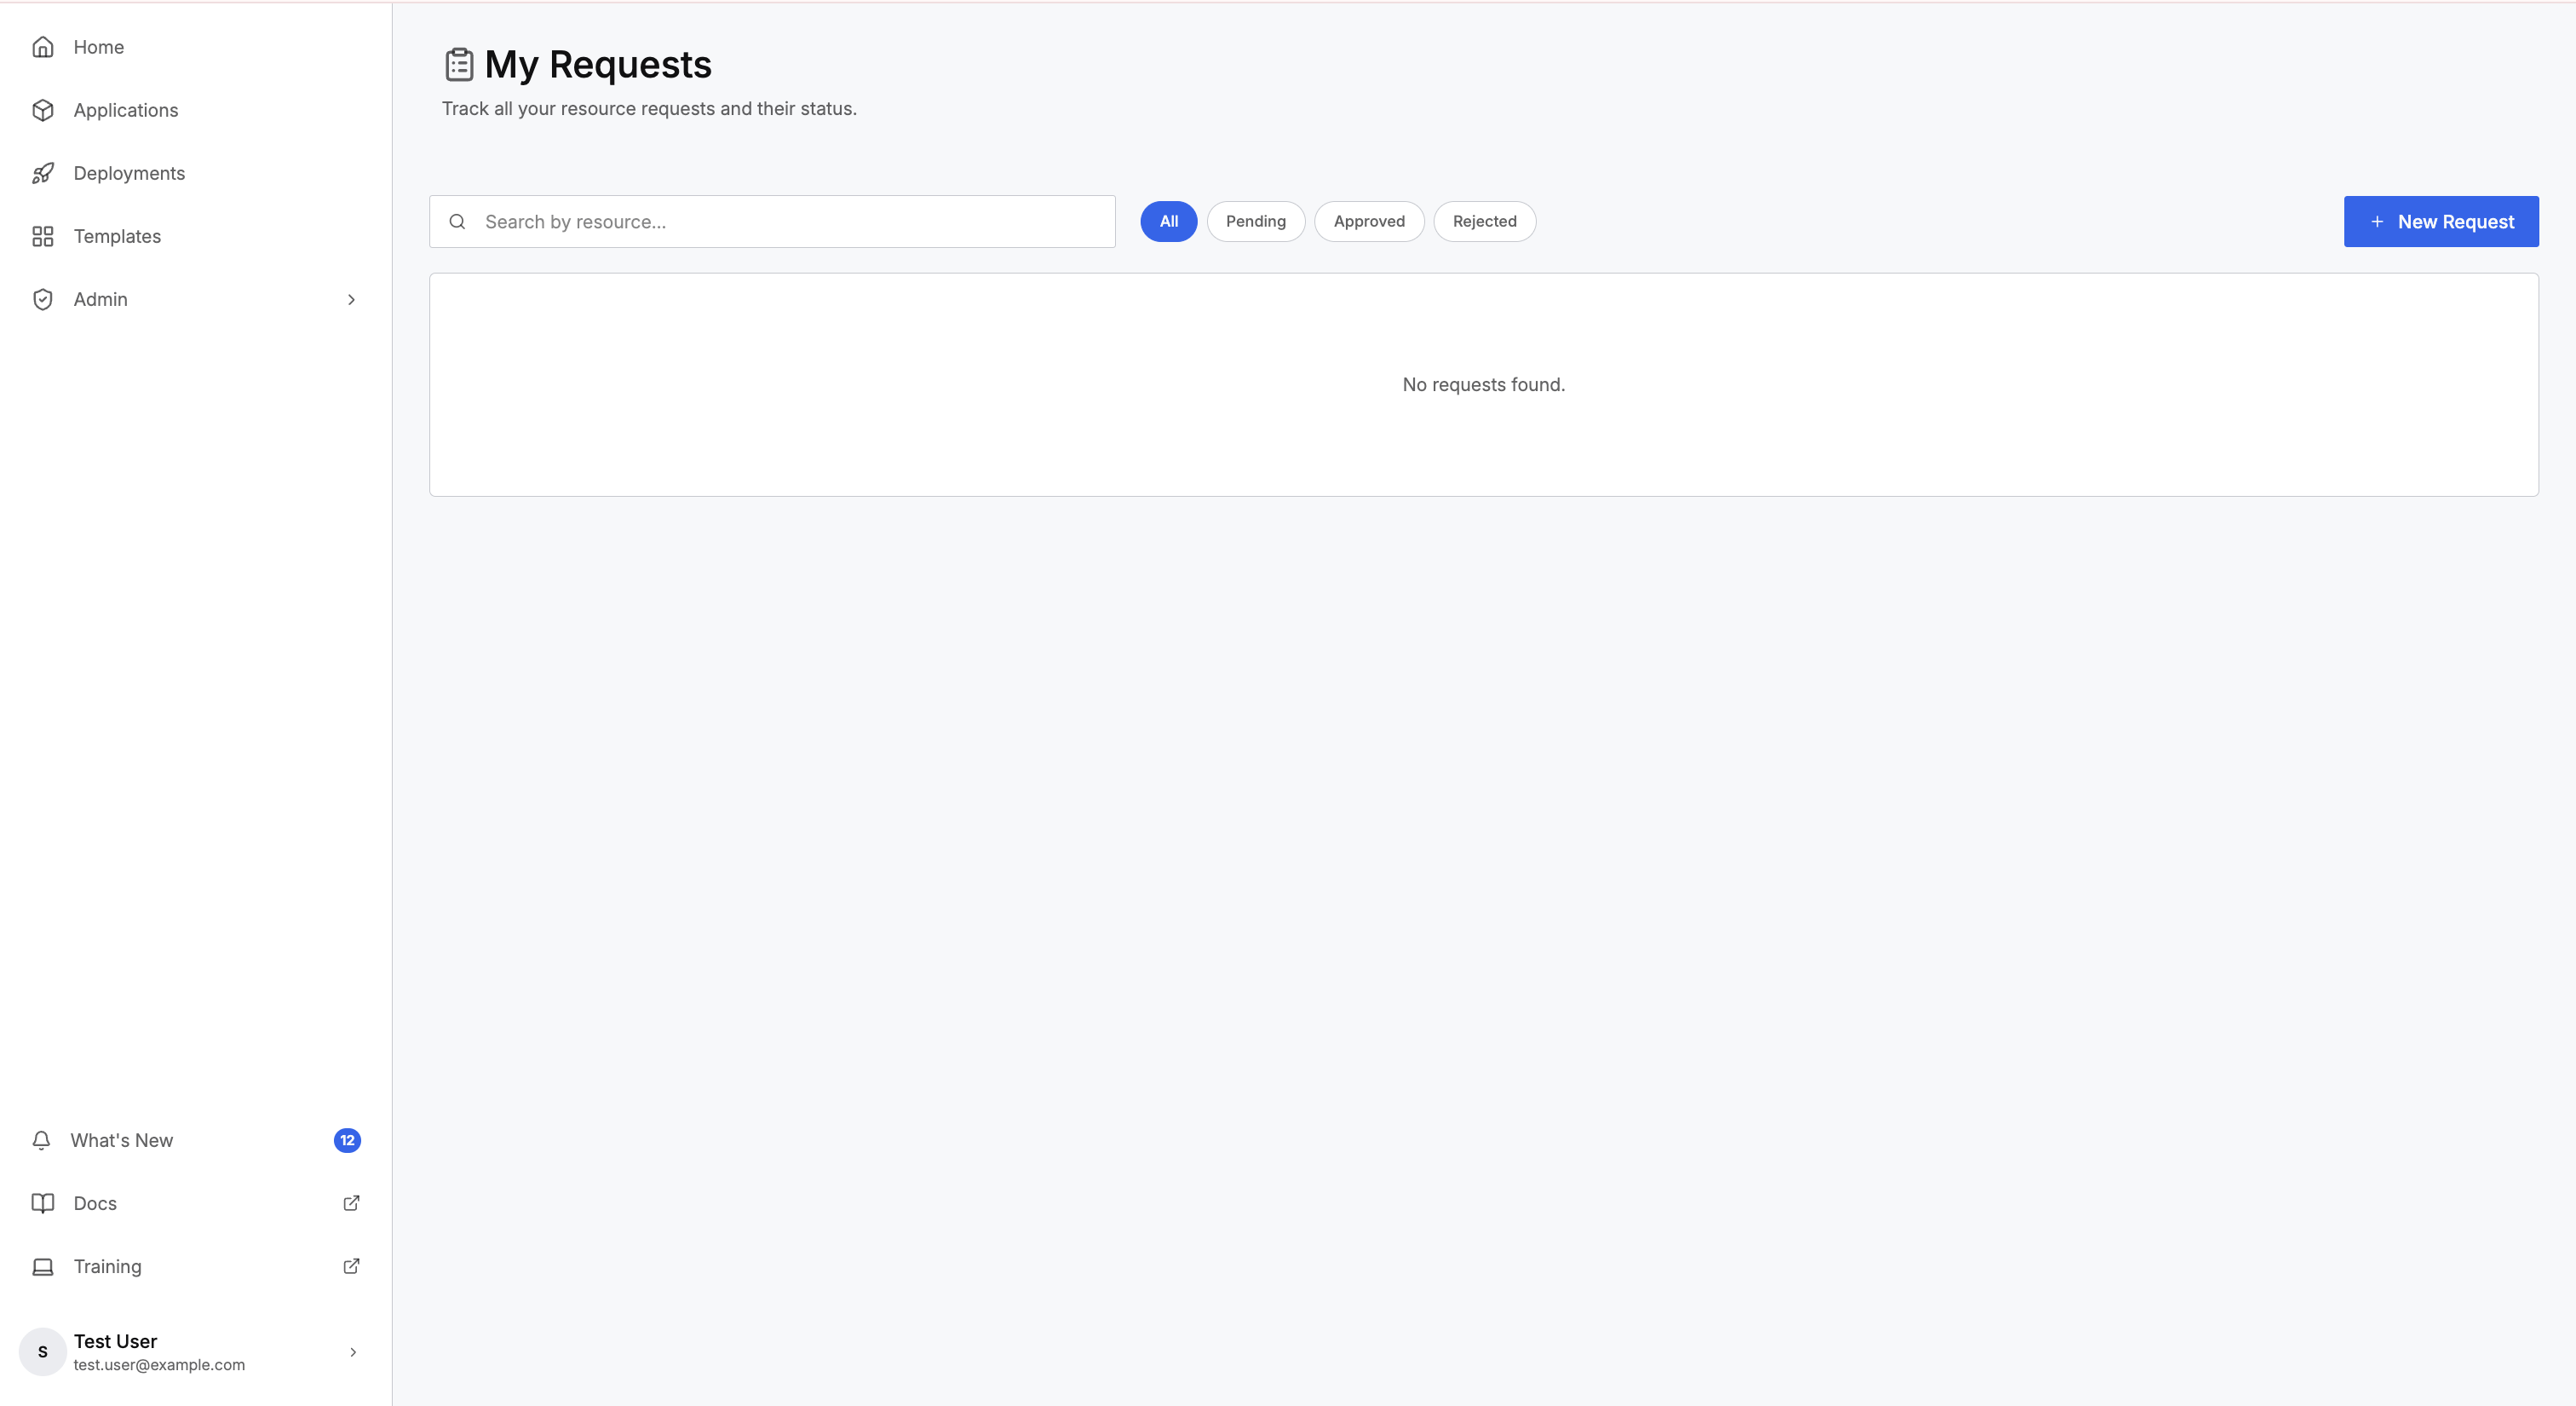
A request ends in one of four states:
- Pending: awaiting administrator review.
- Approved: granted. The approved amount appears on the request, and may differ from the amount you requested.
- Rejected: declined. An administrator can attach a comment explaining why.
- Cancelled: you withdrew the request before review.
Cancel a request you no longer need, instead of leaving the request pending.
Where to go next
These pages cover requesting more and freeing what you already have: