Compute Usage and Budgets in C3 AI Studio
The Compute Usage and Budgets pages in C3 AI Studio show how much CPU (central processing unit) and GPU (graphics processing unit) capacity your clusters, environments, and applications consume. You can set consumption limits that trigger email alerts before a limit is reached. Only users with the Studio Admin or Cluster Admin role can access these pages. Users with the Runtime Admin role can also access these pages, but only if they also have the Studio User role.
Navigate to compute usage and budgets
Complete the following steps to navigate to Compute Usage or Budgets.
- In C3 AI Studio, navigate to the Admin page.
- Select Compute Usage to view consumption data.
- Select Budgets to manage budgets.
<img src="img/computeusage-1.png" alt="Jobs Side Panel" height="400"/>
View compute usage
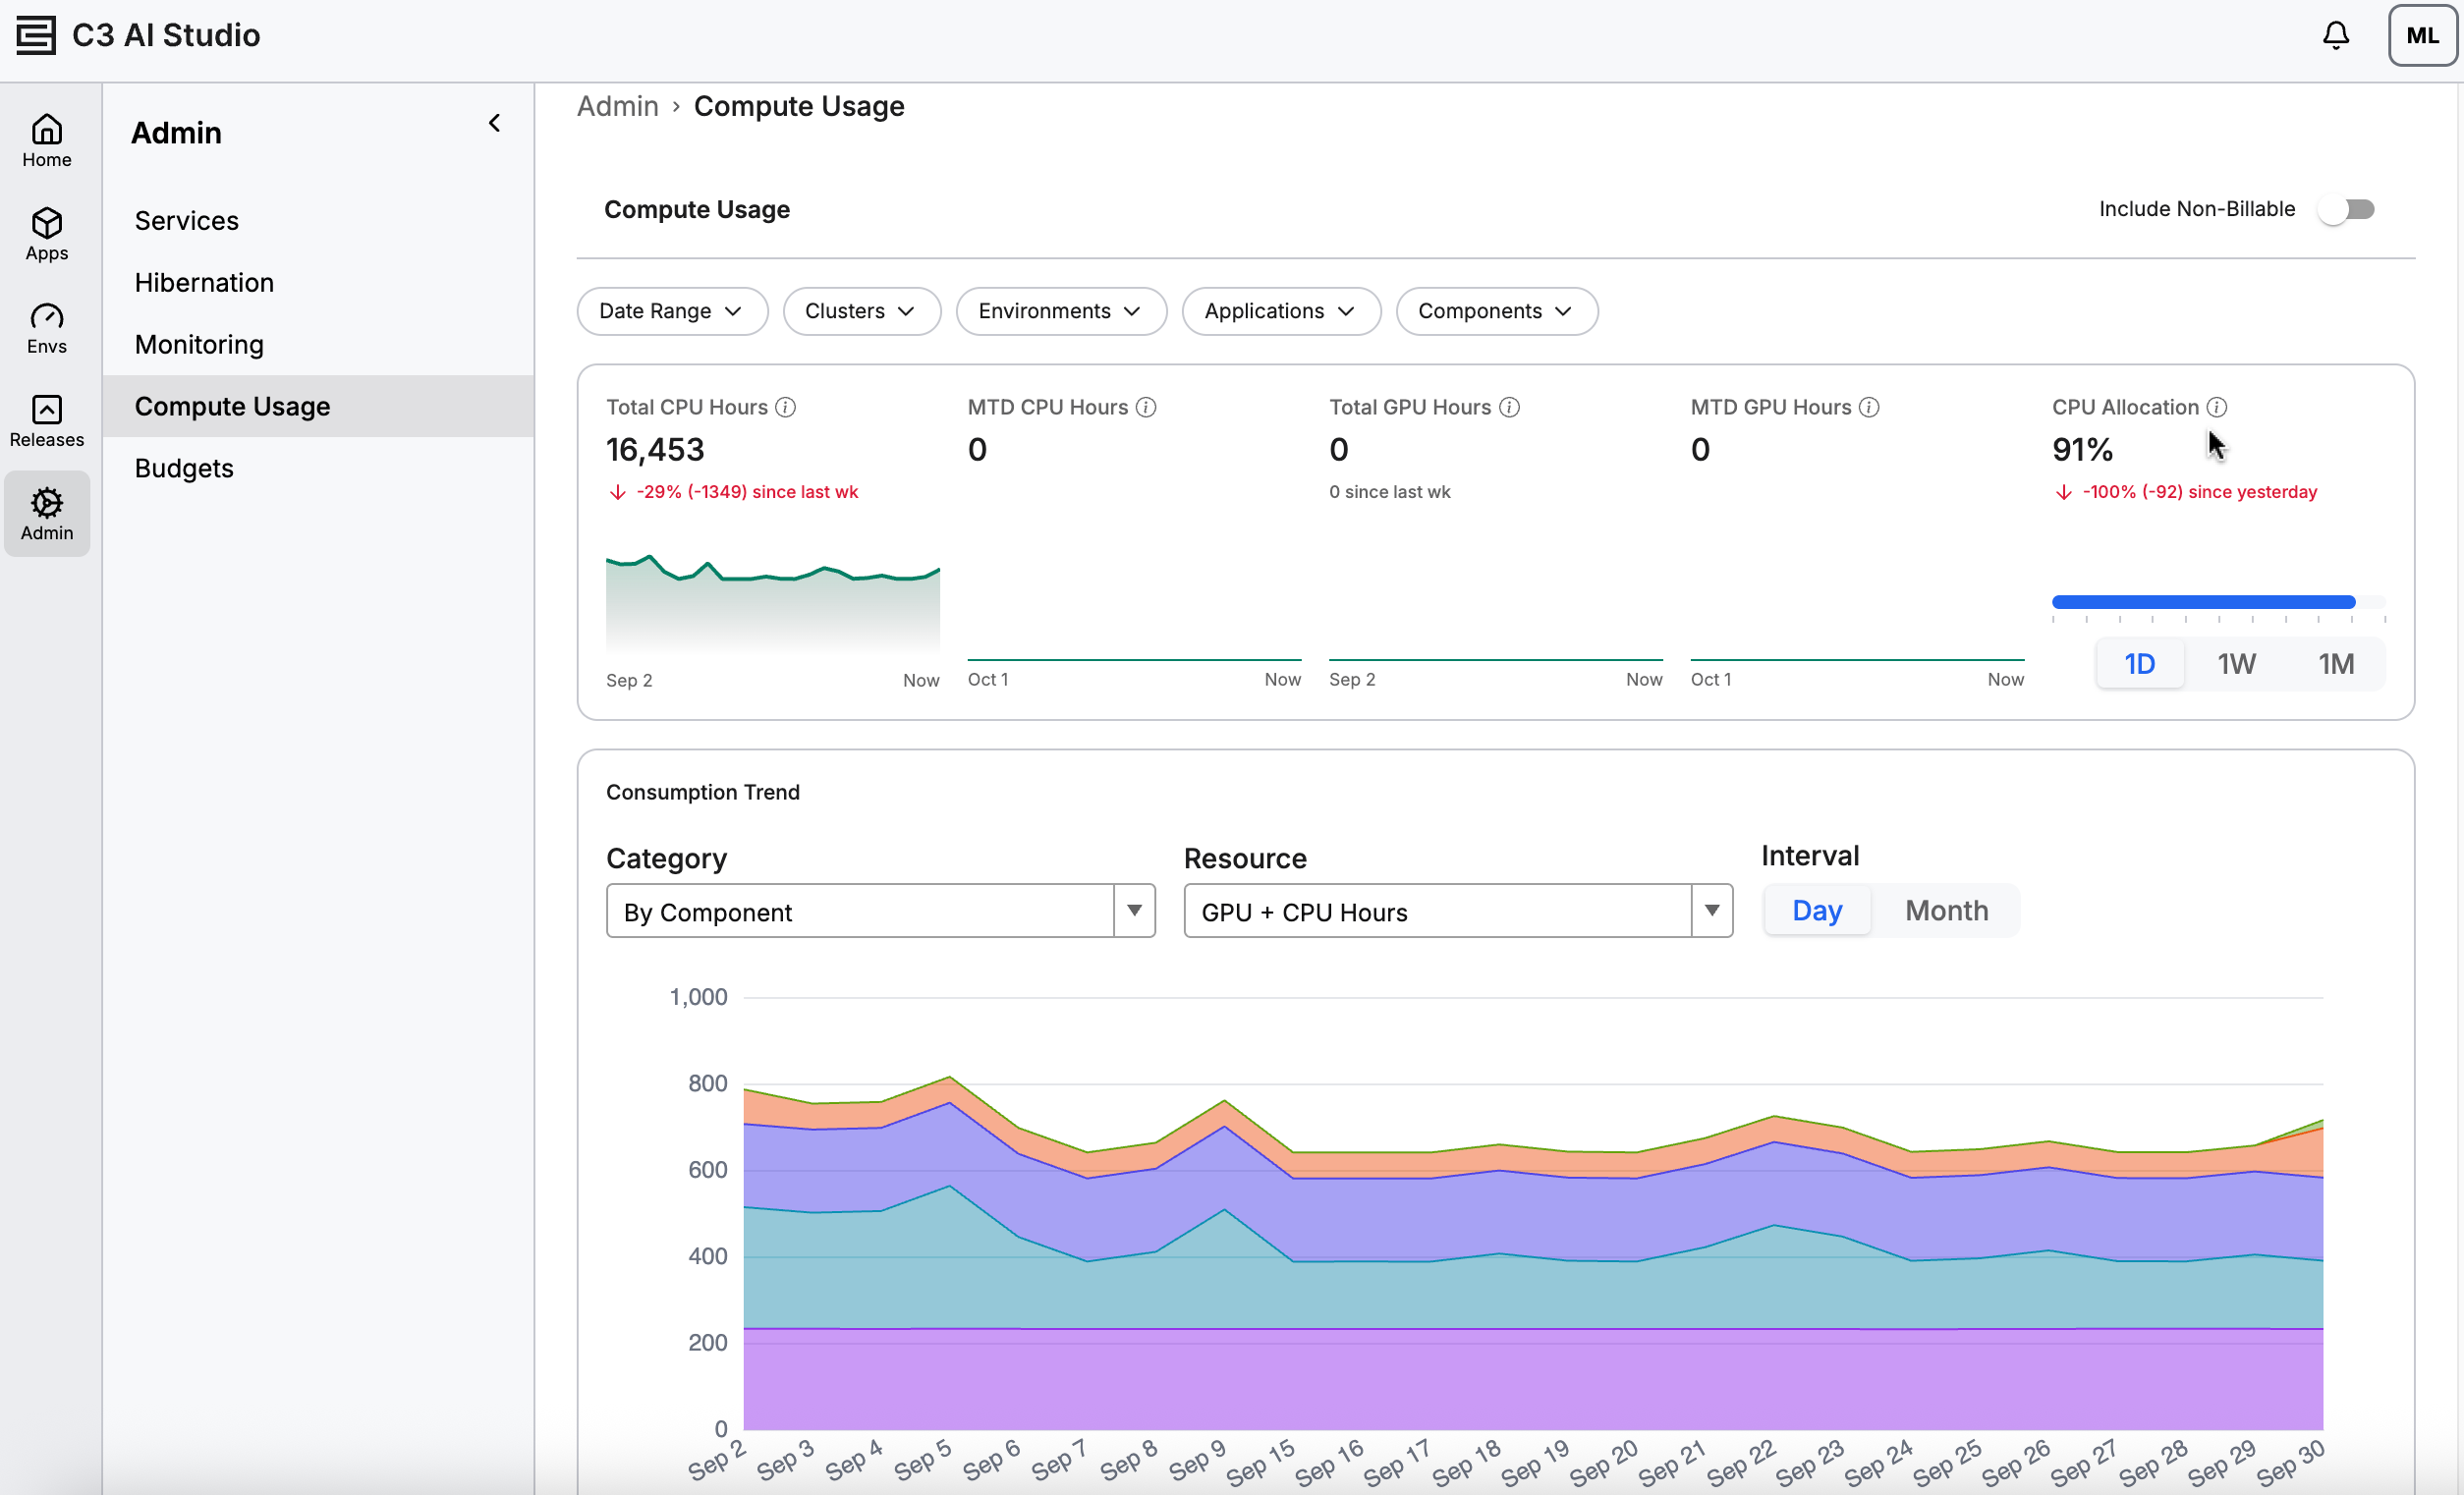
The Compute Usage page shows aggregated CPU and GPU consumption across your clusters. A filter bar, metric tiles, a consumption trend chart, and a summary table all scope to the same filters, so narrowing the date range or selecting a cluster updates every section on the page.
 |
| Compute Usage |
Filter compute usage data
The filter bar at the top of the page controls the data shown across the rest of the page:
- Date Range: The evaluation interval. Choose a preset range or a single month. Future dates are not selectable.
- Clusters: One or more clusters to include. If you do not select a cluster, all clusters you have access to are included.
- Environments: Environments to include, scoped to the selected clusters.
- Applications: Applications to include, scoped to the selected clusters and environments.
- Components: Specific compute components to include.
Turn on Include Non-Billable to include components that aren't billed in the totals shown on the page.
If you narrow the Clusters filter, the options offered in Environments, Applications, and Components update to match.
View metric tiles
The metric tiles summarize consumption for the current filters:
- Total CPU Hours and MTD CPU Hours (month-to-date)
- Total GPU Hours and MTD GPU Hours
- CPU Allocation: The share of a cluster's CPU capacity currently allocated. This tile is available only when a single cluster is selected.
Each tile shows a sparkline and the change over the past day, week, or month.
View the consumption trend
The Consumption Trend chart plots CPU and GPU hours over time as a stacked area chart. Use the chart controls to:
- Group the data by Component, Environment, or Application.
- Choose CPU Hours, GPU Hours, or combined GPU + CPU Hours.
- Set the chart interval to Day or Month.
View the summary table
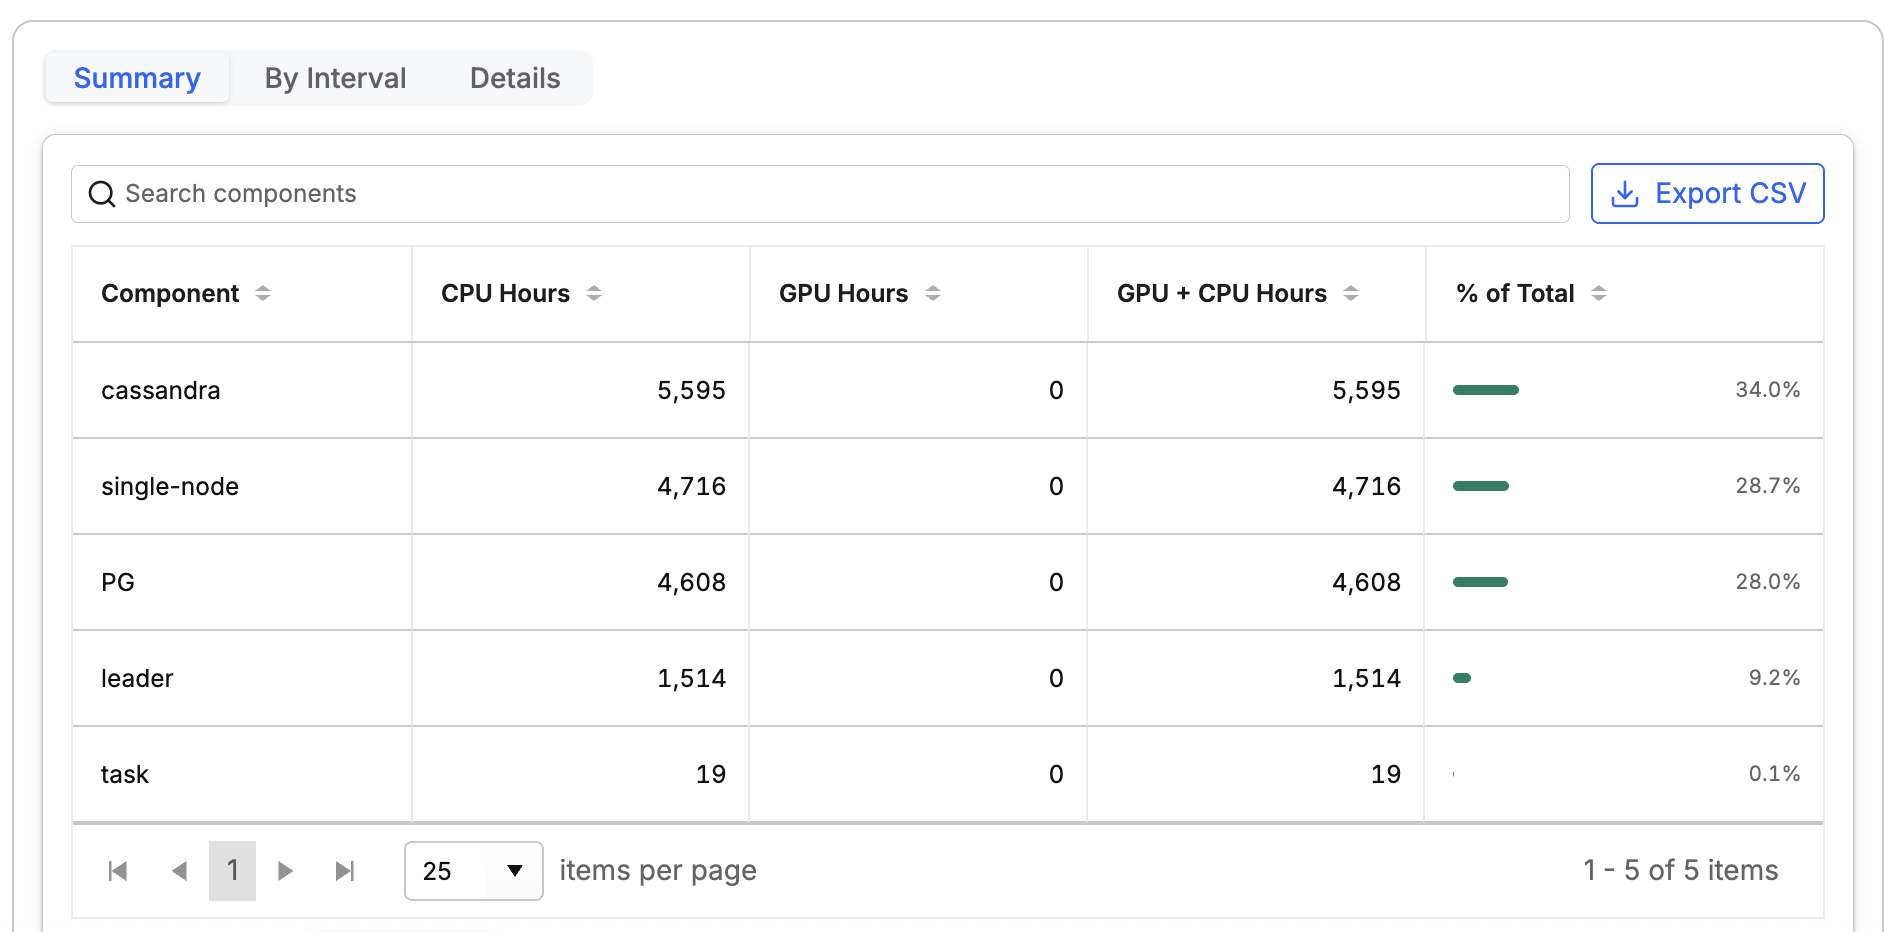
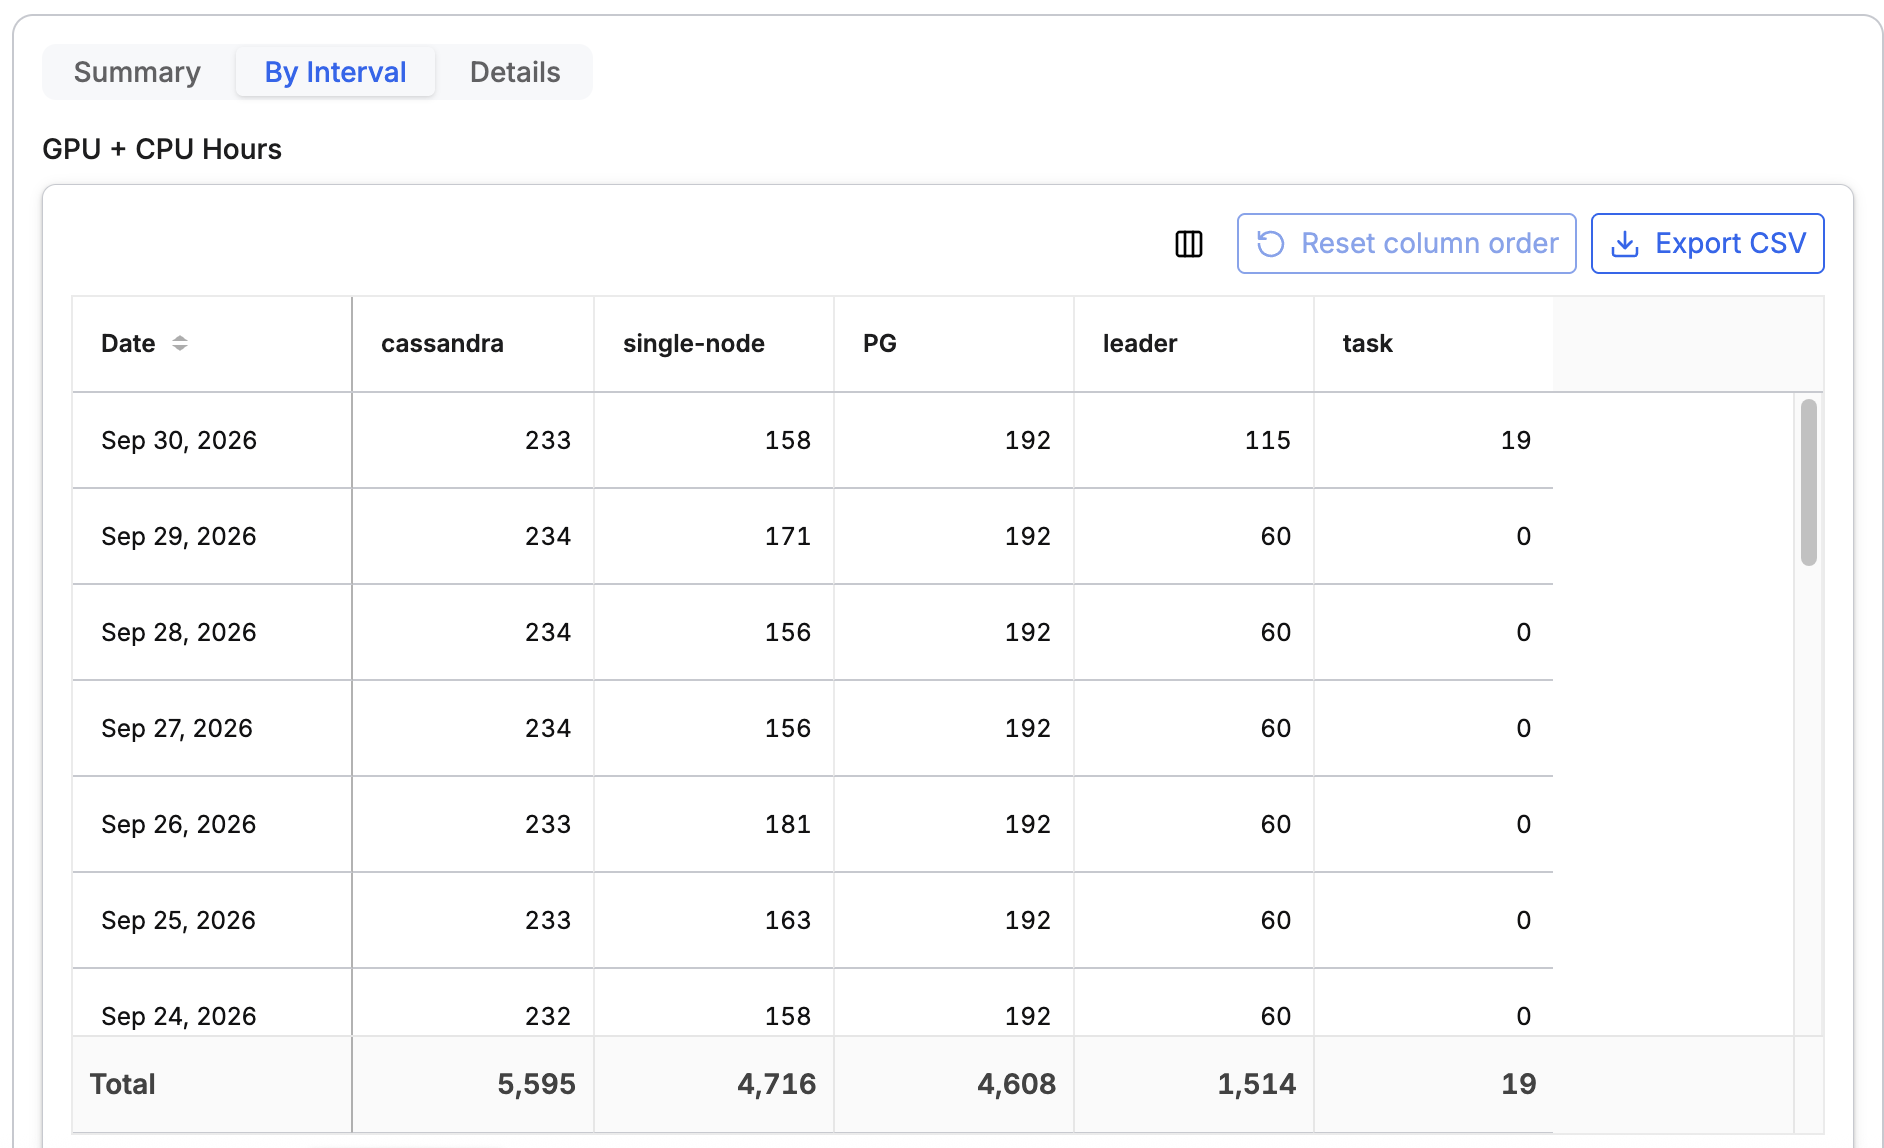
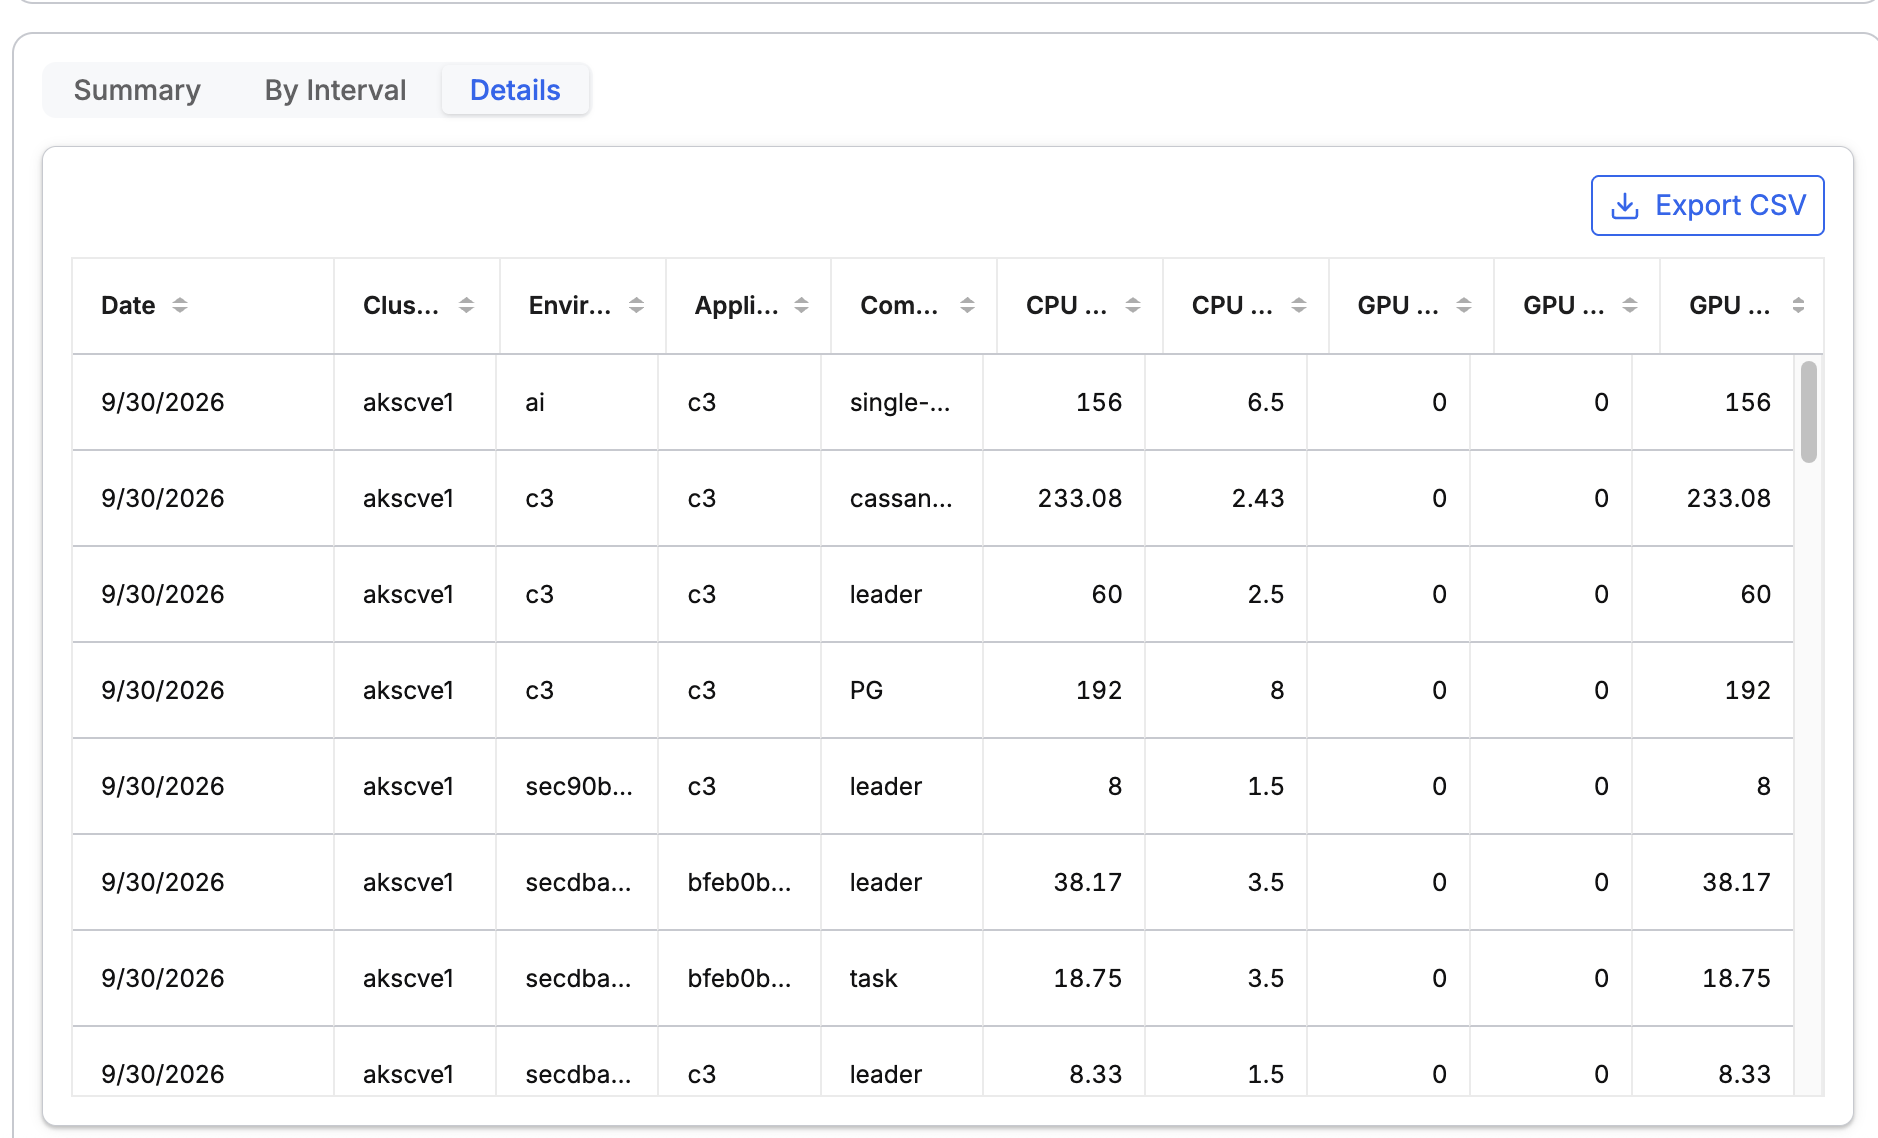
The summary table shows consumption data for the current filters in tabular form. Toggle between:
- Summary: One row per component, environment, or application, with each row's percentage of the total.
- By Interval: One row per date interval, for a detailed breakdown over time.
- Details: One row per individual usage record, for the most granular breakdown available.
Use Search to filter table rows, and select Export CSV to download the current table as a CSV (comma-separated values) file.
 |
| Summary Table |
 |
| Interval Table |
 |
| Details Table |
Manage budgets
A budget sets a consumption ceiling, in hours, for a cluster, environment, or application over a recurring period. When consumption crosses a warning or critical threshold, C3 AI Studio logs an alert and, if configured, emails the notification list.
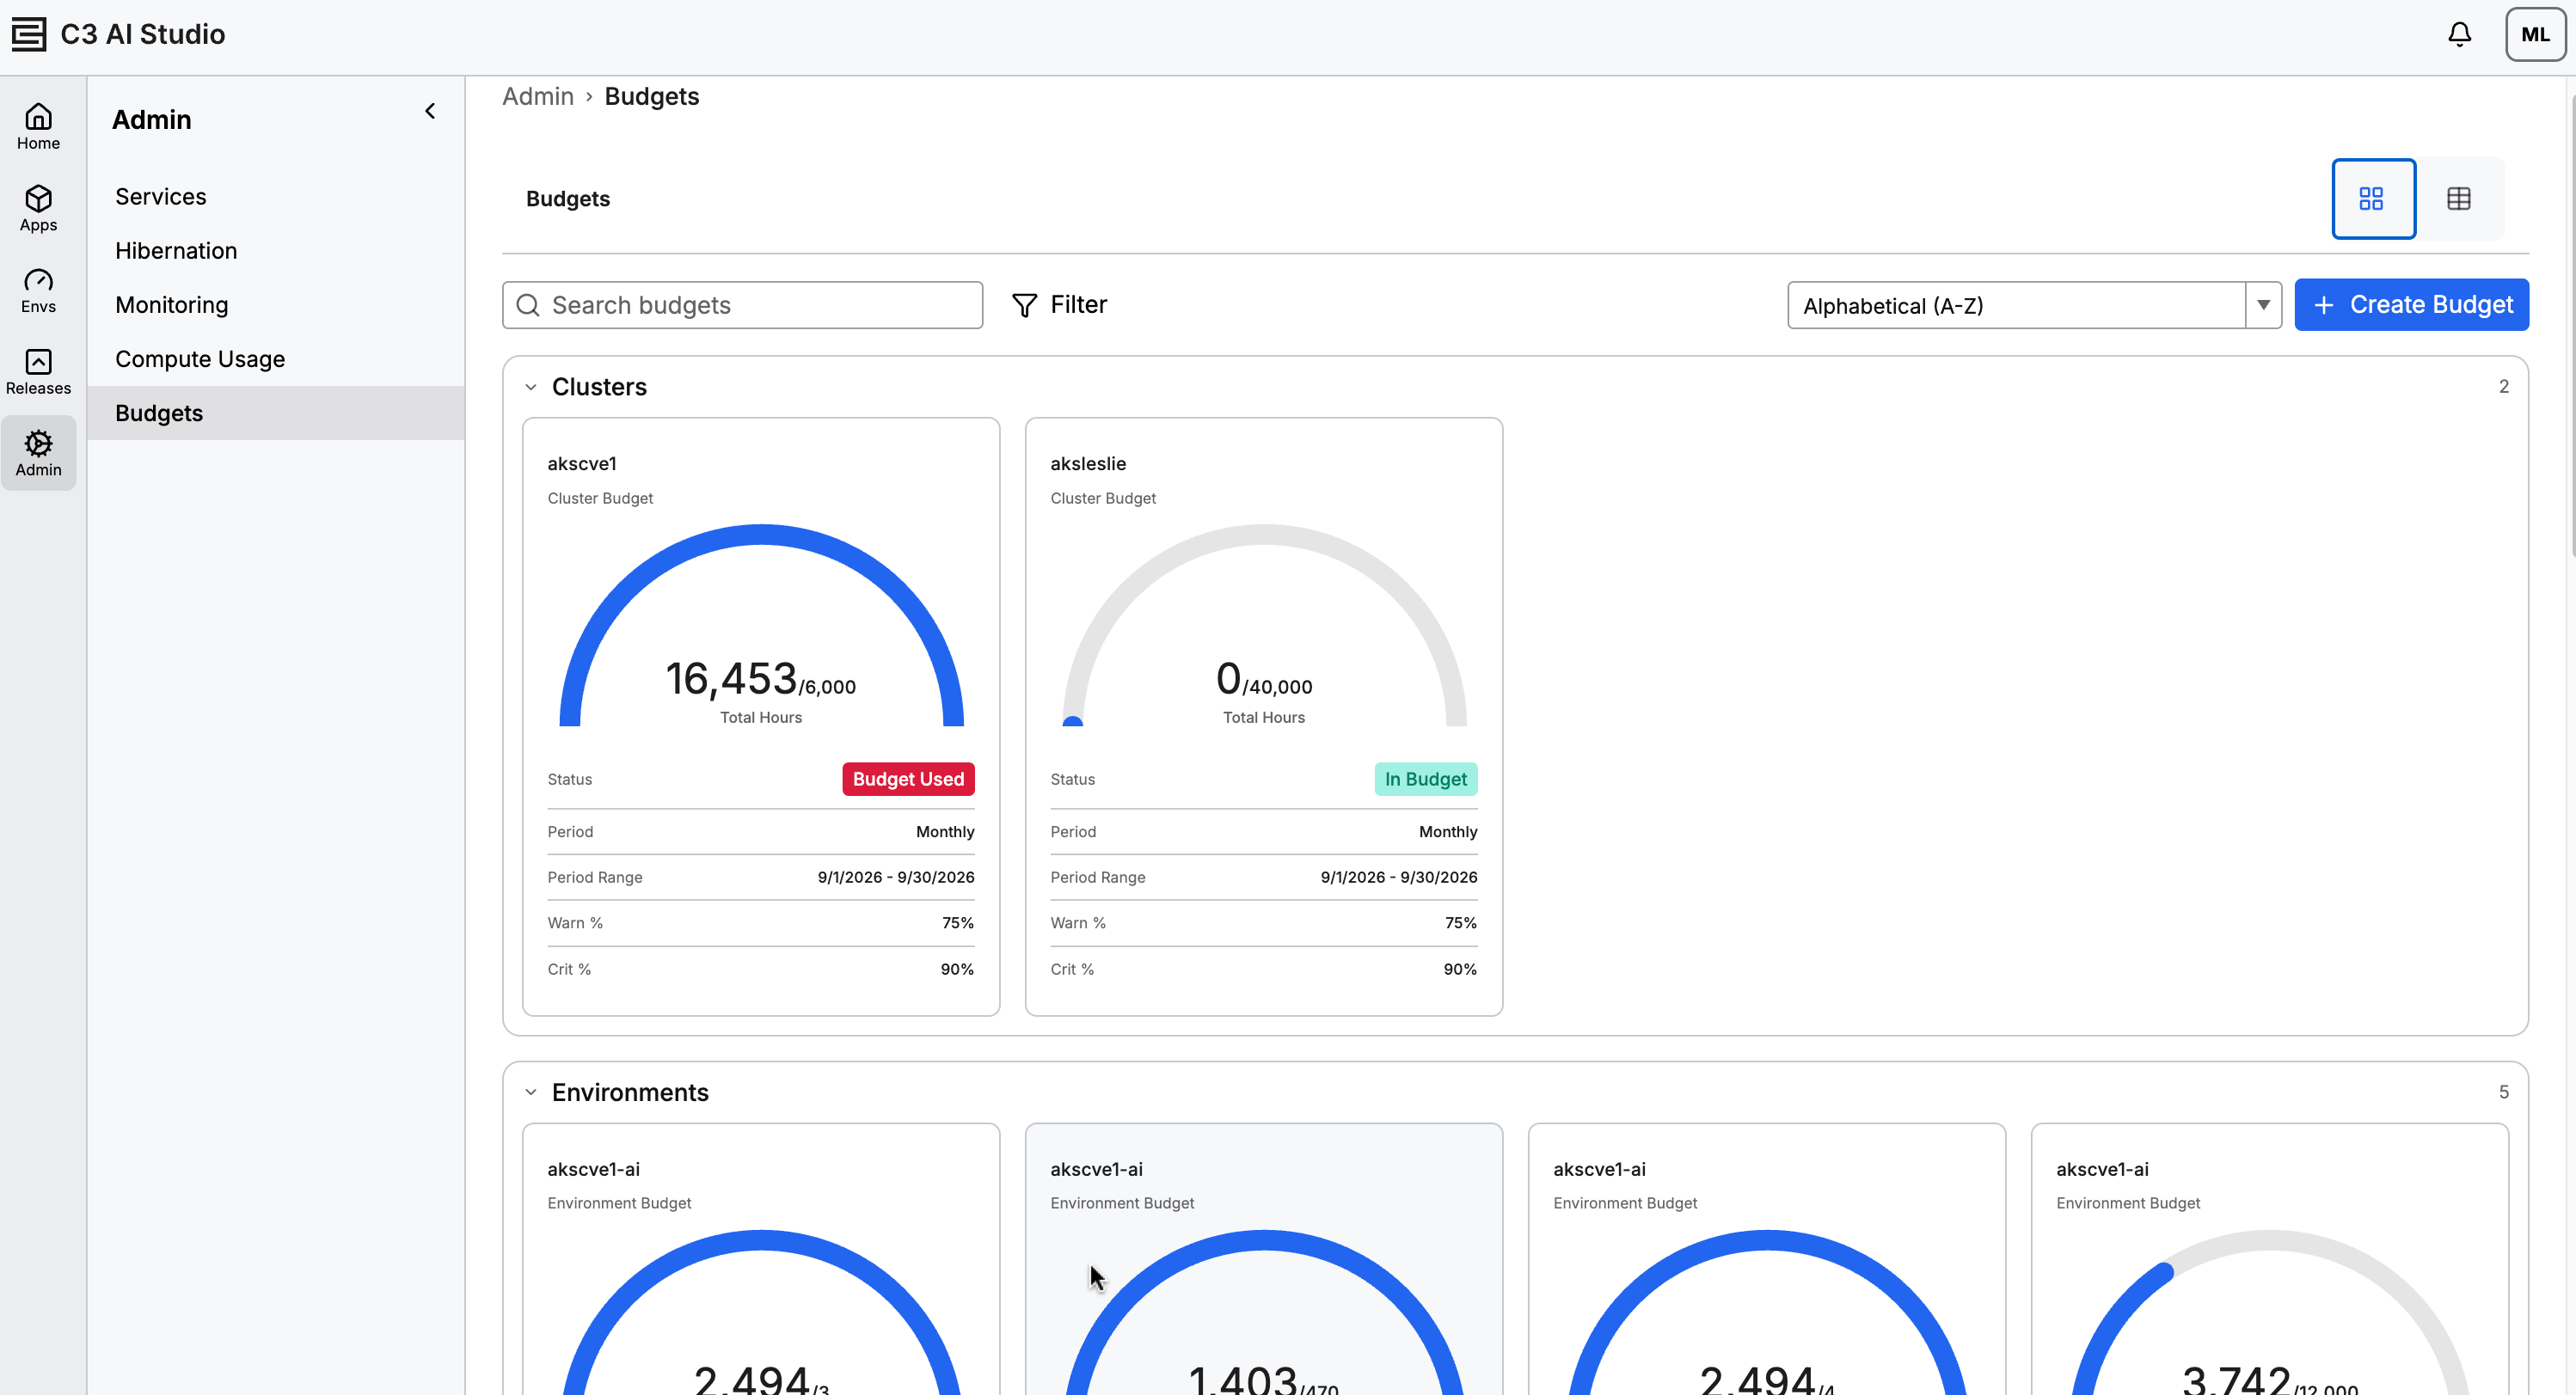 |
| Budgets |
Each budget has:
- Name: An optional display name. If you do not set one, the budget defaults to a name derived from its cluster, environment, and application identity fields.
- Scope (Cluster, Application, or Environment): The scope determines which identity fields (cluster, and optionally environment and application) apply to the budget.
- Period (Daily, Monthly, Quarterly, or Annual) : The recurring interval the ceiling applies to.
- Ceiling (Hours): The consumption limit for one period.
- Warning Threshold (%) and Critical Threshold (%): Percentages of the ceiling that trigger an alert. The critical threshold must be greater than or equal to the warning threshold.
- Notify: A comma-separated list of email addresses to notify when a threshold is crossed.
A budget's status badge reflects how its current consumption compares to its own thresholds:
| Status | Condition |
|---|---|
| In Budget | Consumption is below the warning threshold. |
| Approaching Budget | Consumption has reached the warning threshold. |
| Nearing Budget | Consumption has reached the critical threshold. |
| Budget Used | Consumption has reached 100% of the ceiling. |
Browse the budgets list
Go to Admin > Budgets to see all budgets you have access to. Switch between Table view (the default) and Grid view using the view toggle next to the page title. Grid view groups budgets into collapsible Clusters, Environments, and Applications sections. Table view lists all budgets together.
|
| Budgets - Grid View |
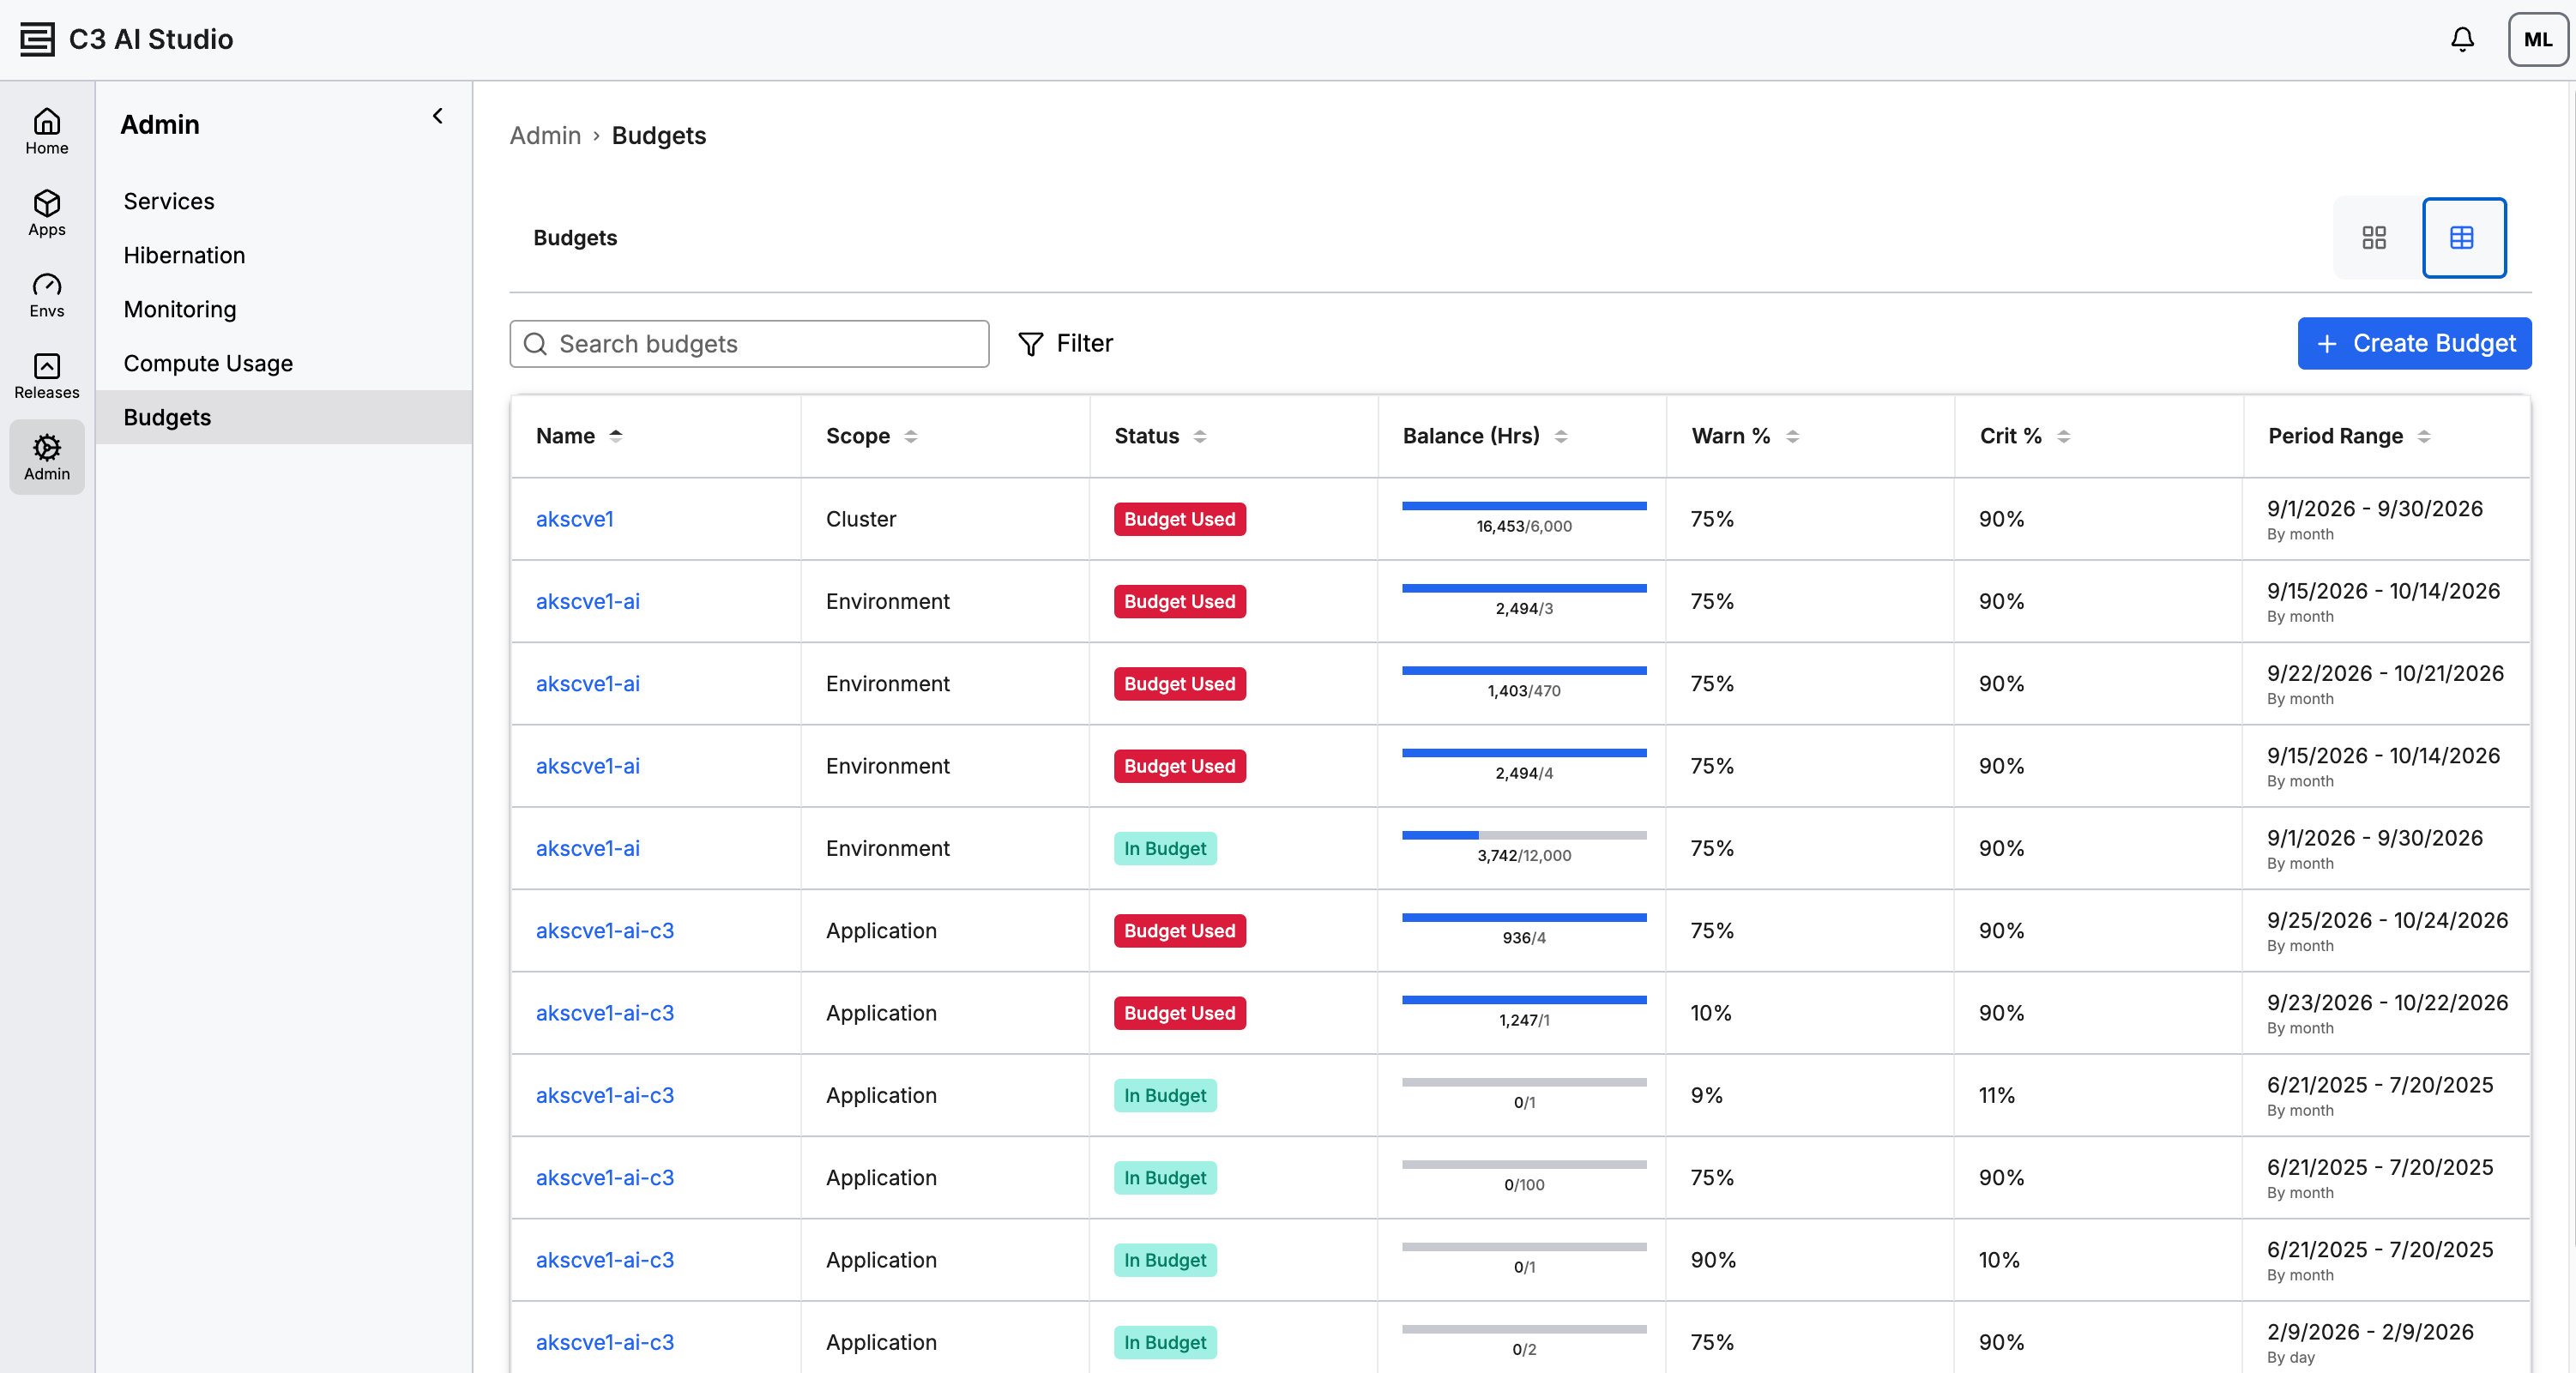 |
| Budgets - Table View |
Use Search to filter budgets by name. Select Filter to show quick filters for Status, Period, and Scope. In Grid view, use the sort dropdown to sort budgets alphabetically (A-Z or Z-A).
Create a budget
- Go to Admin > Budgets.
- Select Create Budget.
- Under Scope, select Cluster, Application, or Environment, and select the corresponding cluster, application, or environment.
- Under General, optionally enter a Budget Name (if you leave it blank, C3 AI Studio derives a name from the cluster, environment, and application identity fields), and enter a Budget Description, a Ceiling (Hours), a Period Frequency, and a Start Date.
- Under Thresholds and Notifications, set the Warning Threshold (%) and Critical Threshold (%), and optionally enter one or more email addresses to Notify.
- Select Create.
You cannot change a budget's scope, identity fields (cluster, environment, or application), or start date after you create it.
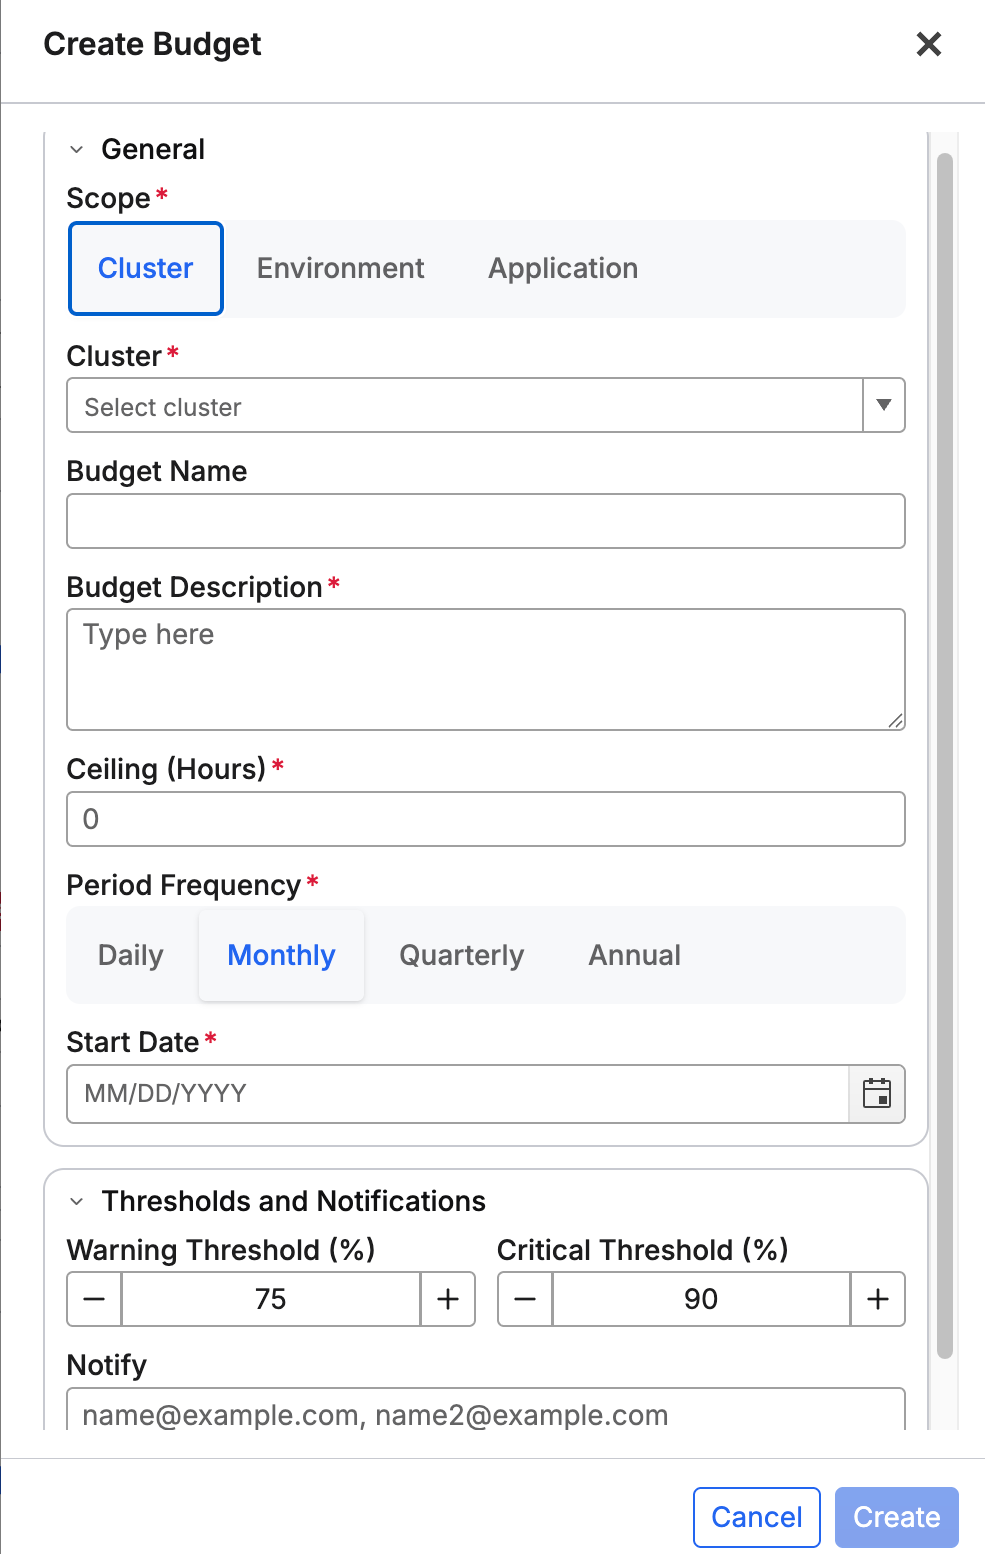 |
| Create a Budget |
View budget details
Select a budget from the Budgets list to open its detail page. The detail page shows:
- A gauge comparing current consumption to the ceiling, warning threshold, and critical threshold.
- A cumulative usage chart for a selectable date range and interval (Day or Month).
- An activity timeline showing when the budget was created and when it crossed a threshold.
- The list of email addresses configured to receive notifications.
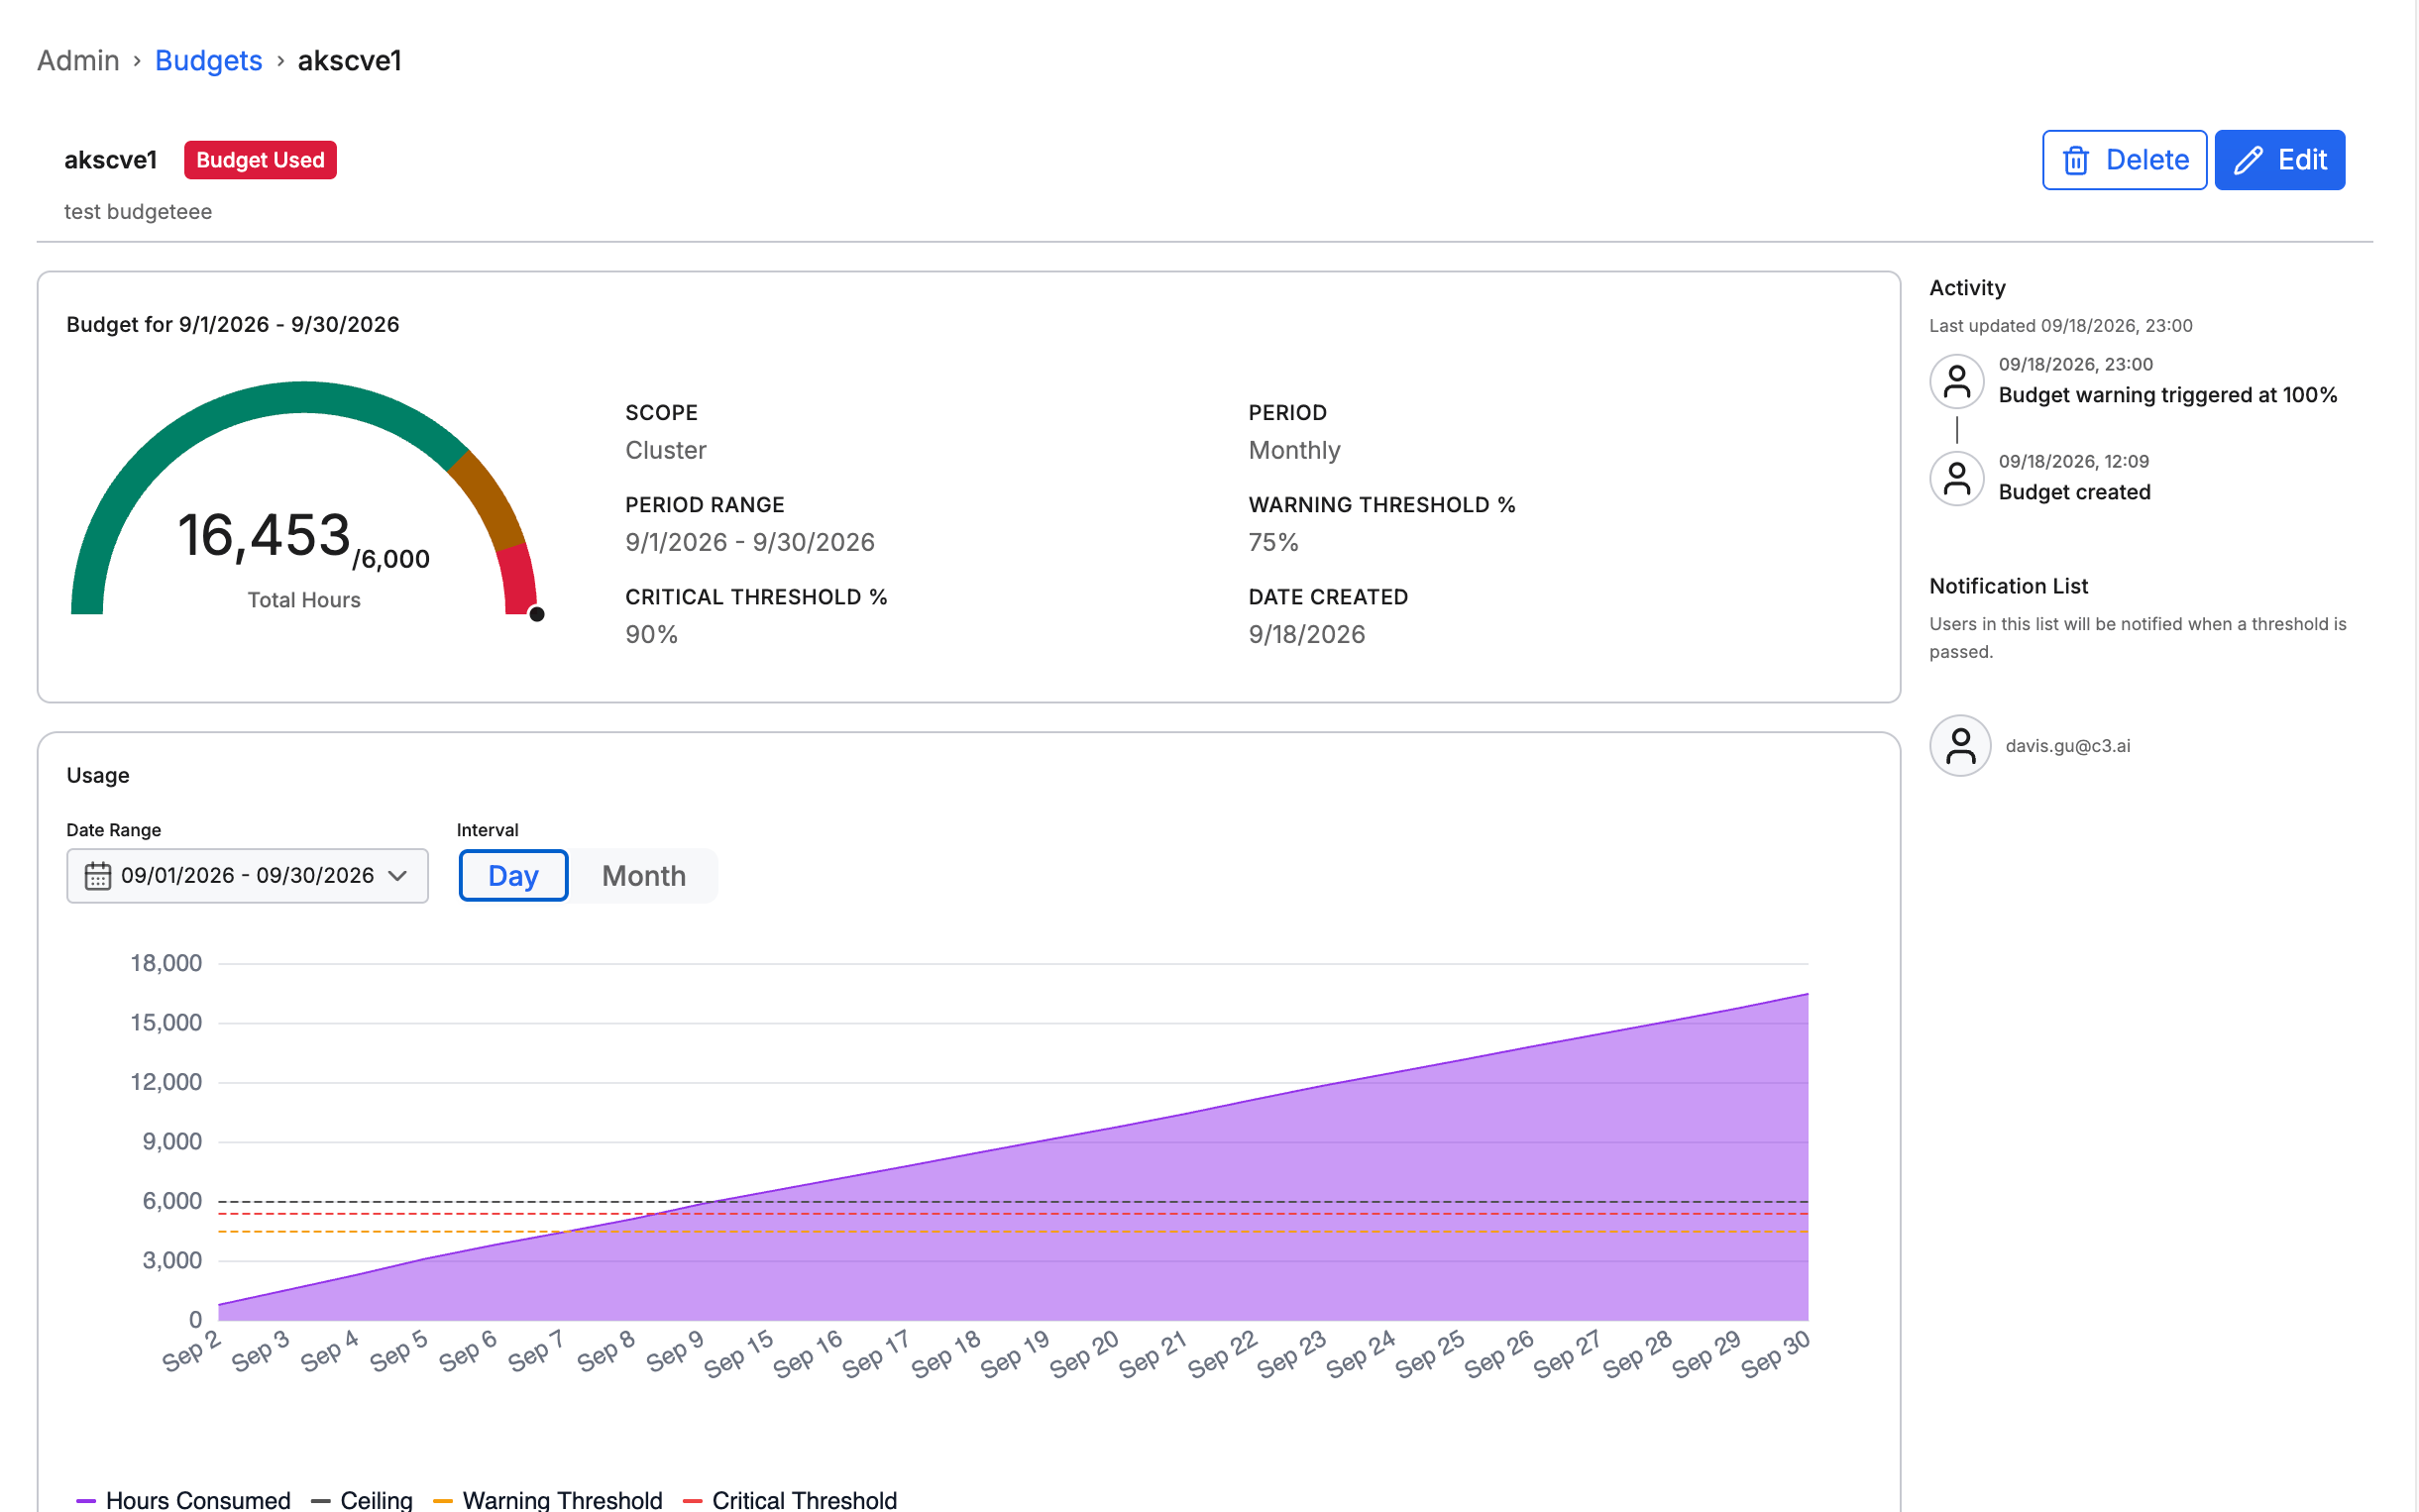 |
| Budget Details |
Edit a budget
- Open the budget's detail page.
- Select Edit.
- Update the name, description, period, ceiling, thresholds, notification list, or Active status.
- Select Save.
Turn off Active to stop threshold evaluation and notifications for a budget without deleting it.
Delete a budget
- Open the budget's detail page.
- Select Delete.
- Enter the budget name to confirm.
Deleting a budget permanently removes it and stops its threshold notifications. This action cannot be undone.
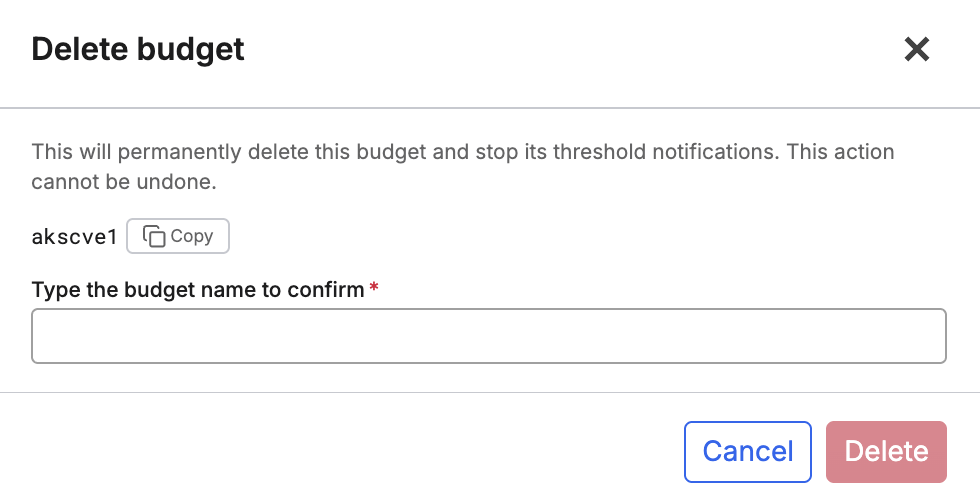 |
| Delete Budget Dialog Box |