Workload Management
The C3 Agentic AI Platform uses queues to parallelize work and run asynchronous logic in the background. C3 AI Studio provides you with a robust workload management tool you can use to monitor and manage your application.
For more information on types of queues how to manage queues in console, see the Monitor and Manage Queues topic in the Platform Administration Guide.
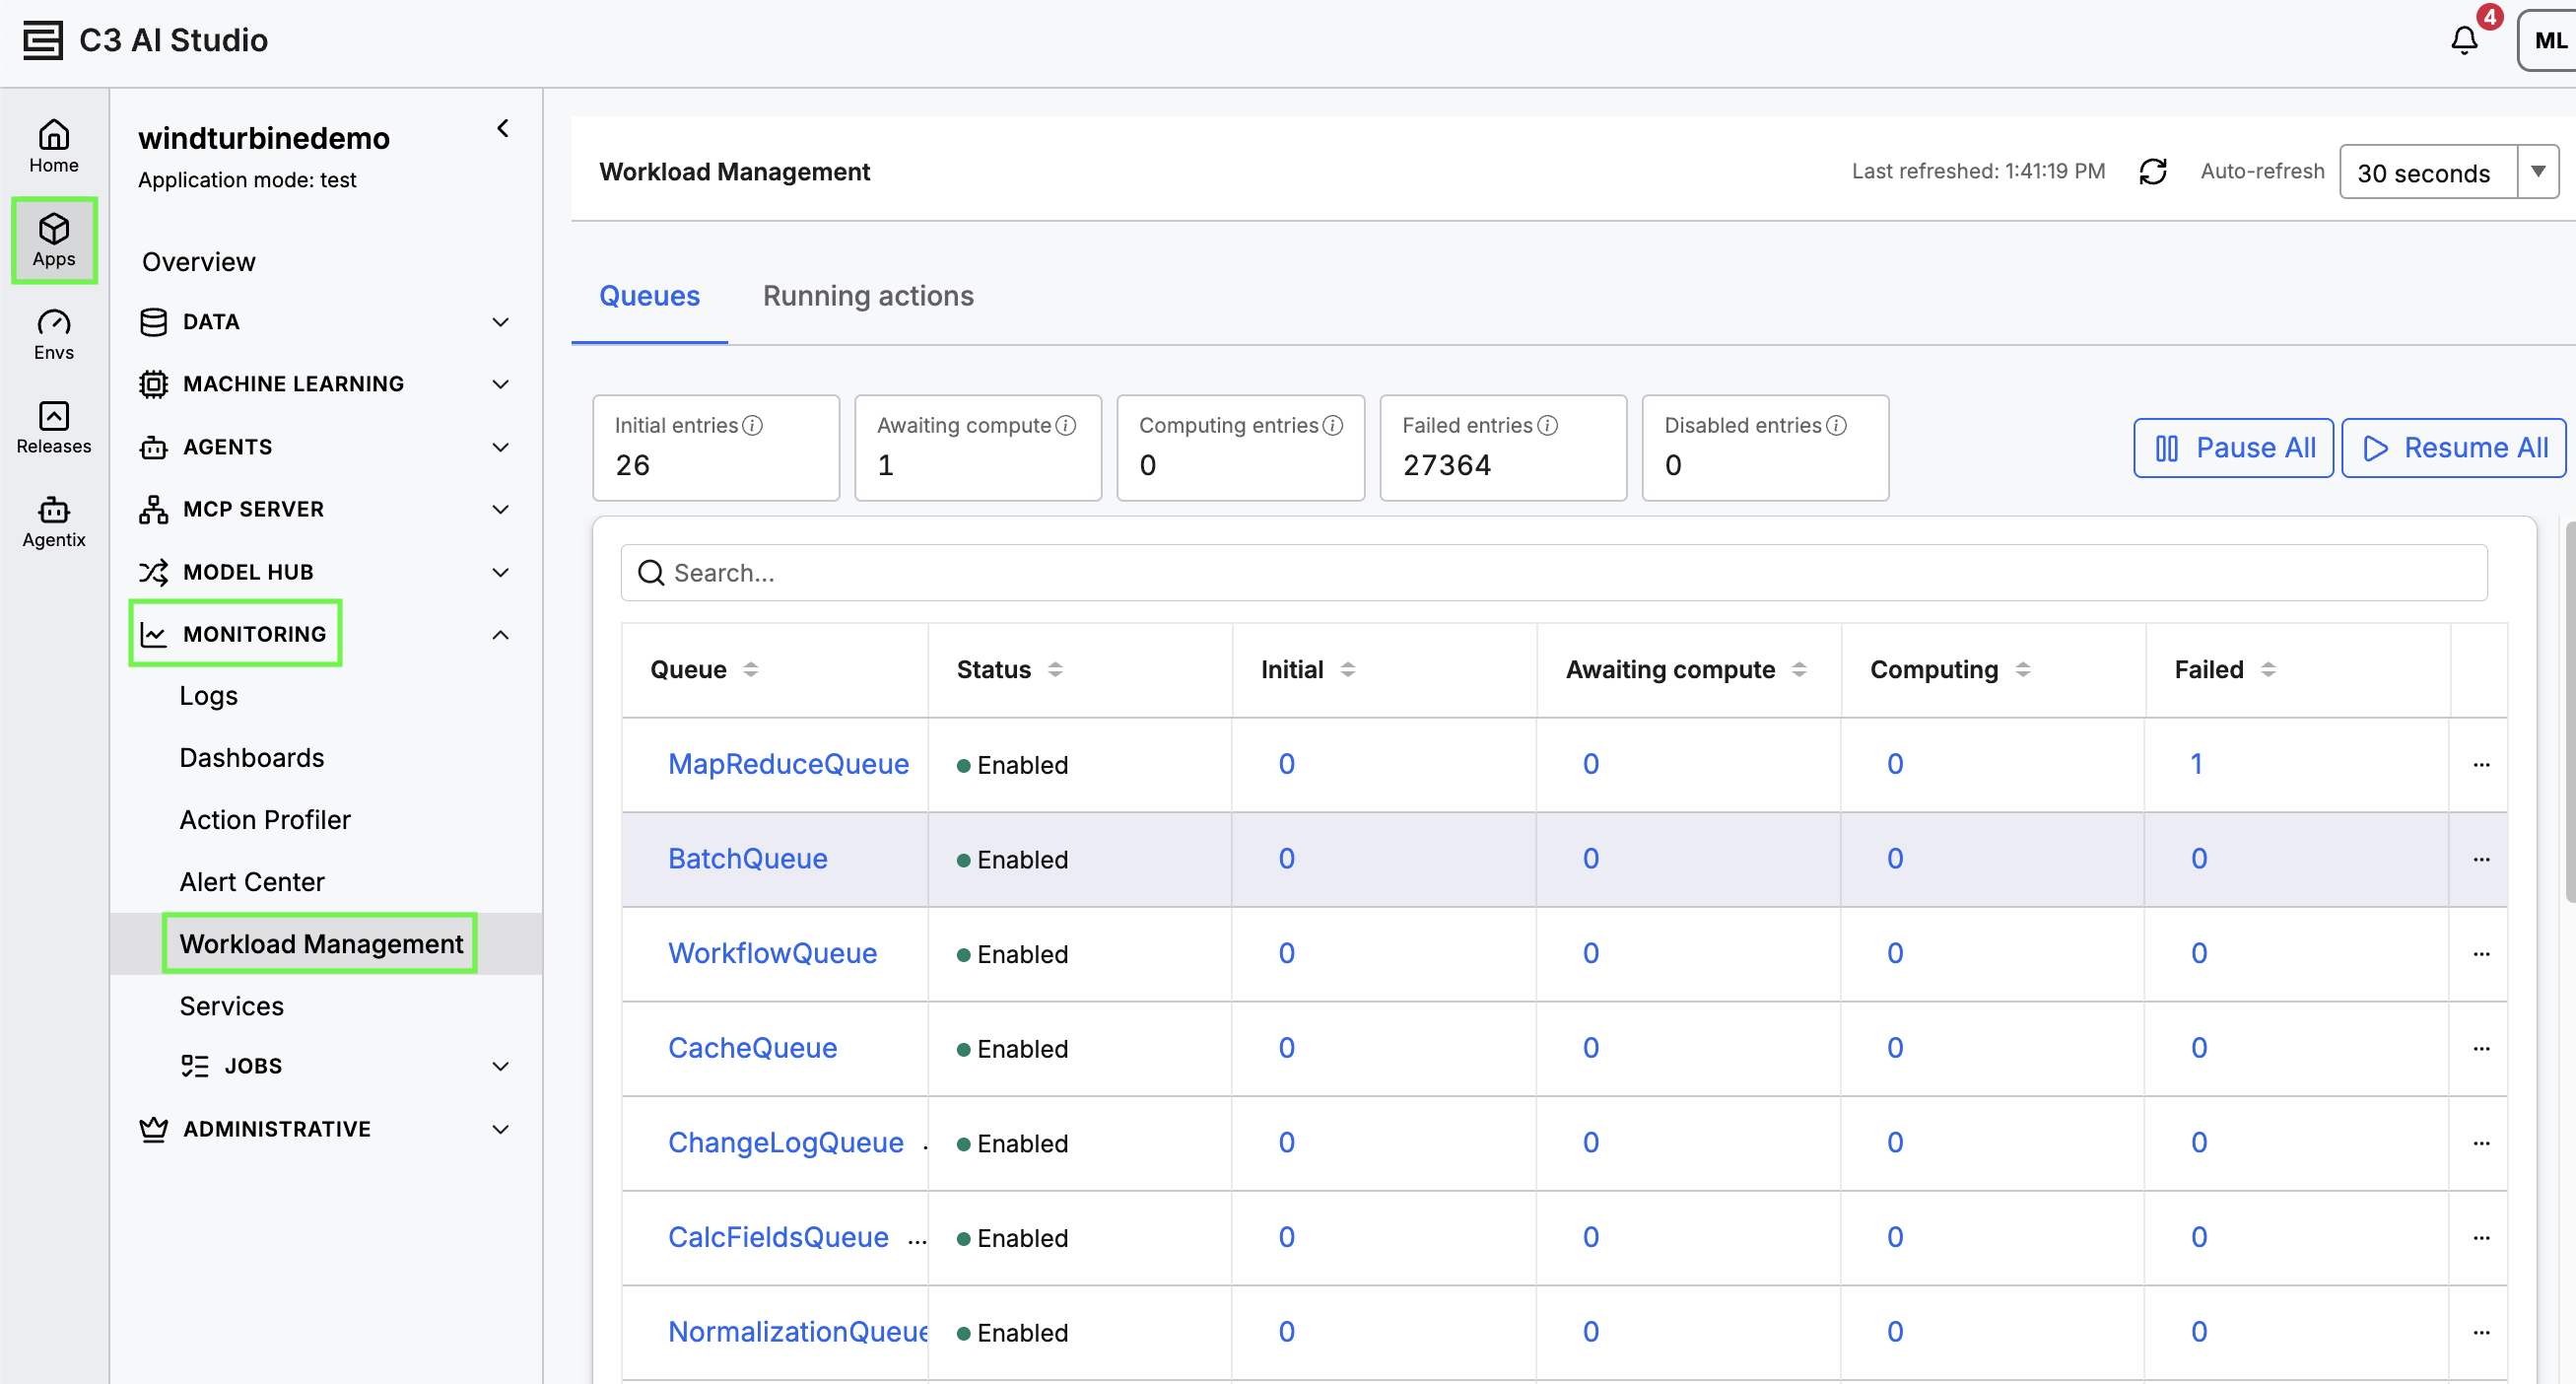
Navigate to Workload Management
Complete the following steps to navigate to the Workload Management page:
- In C3 AI Studio, navigate to the Apps page.
- Select an application.
- Navigate to Monitoring and then select Workload Management.
 |
| Navigate to Workload Management |
Queues
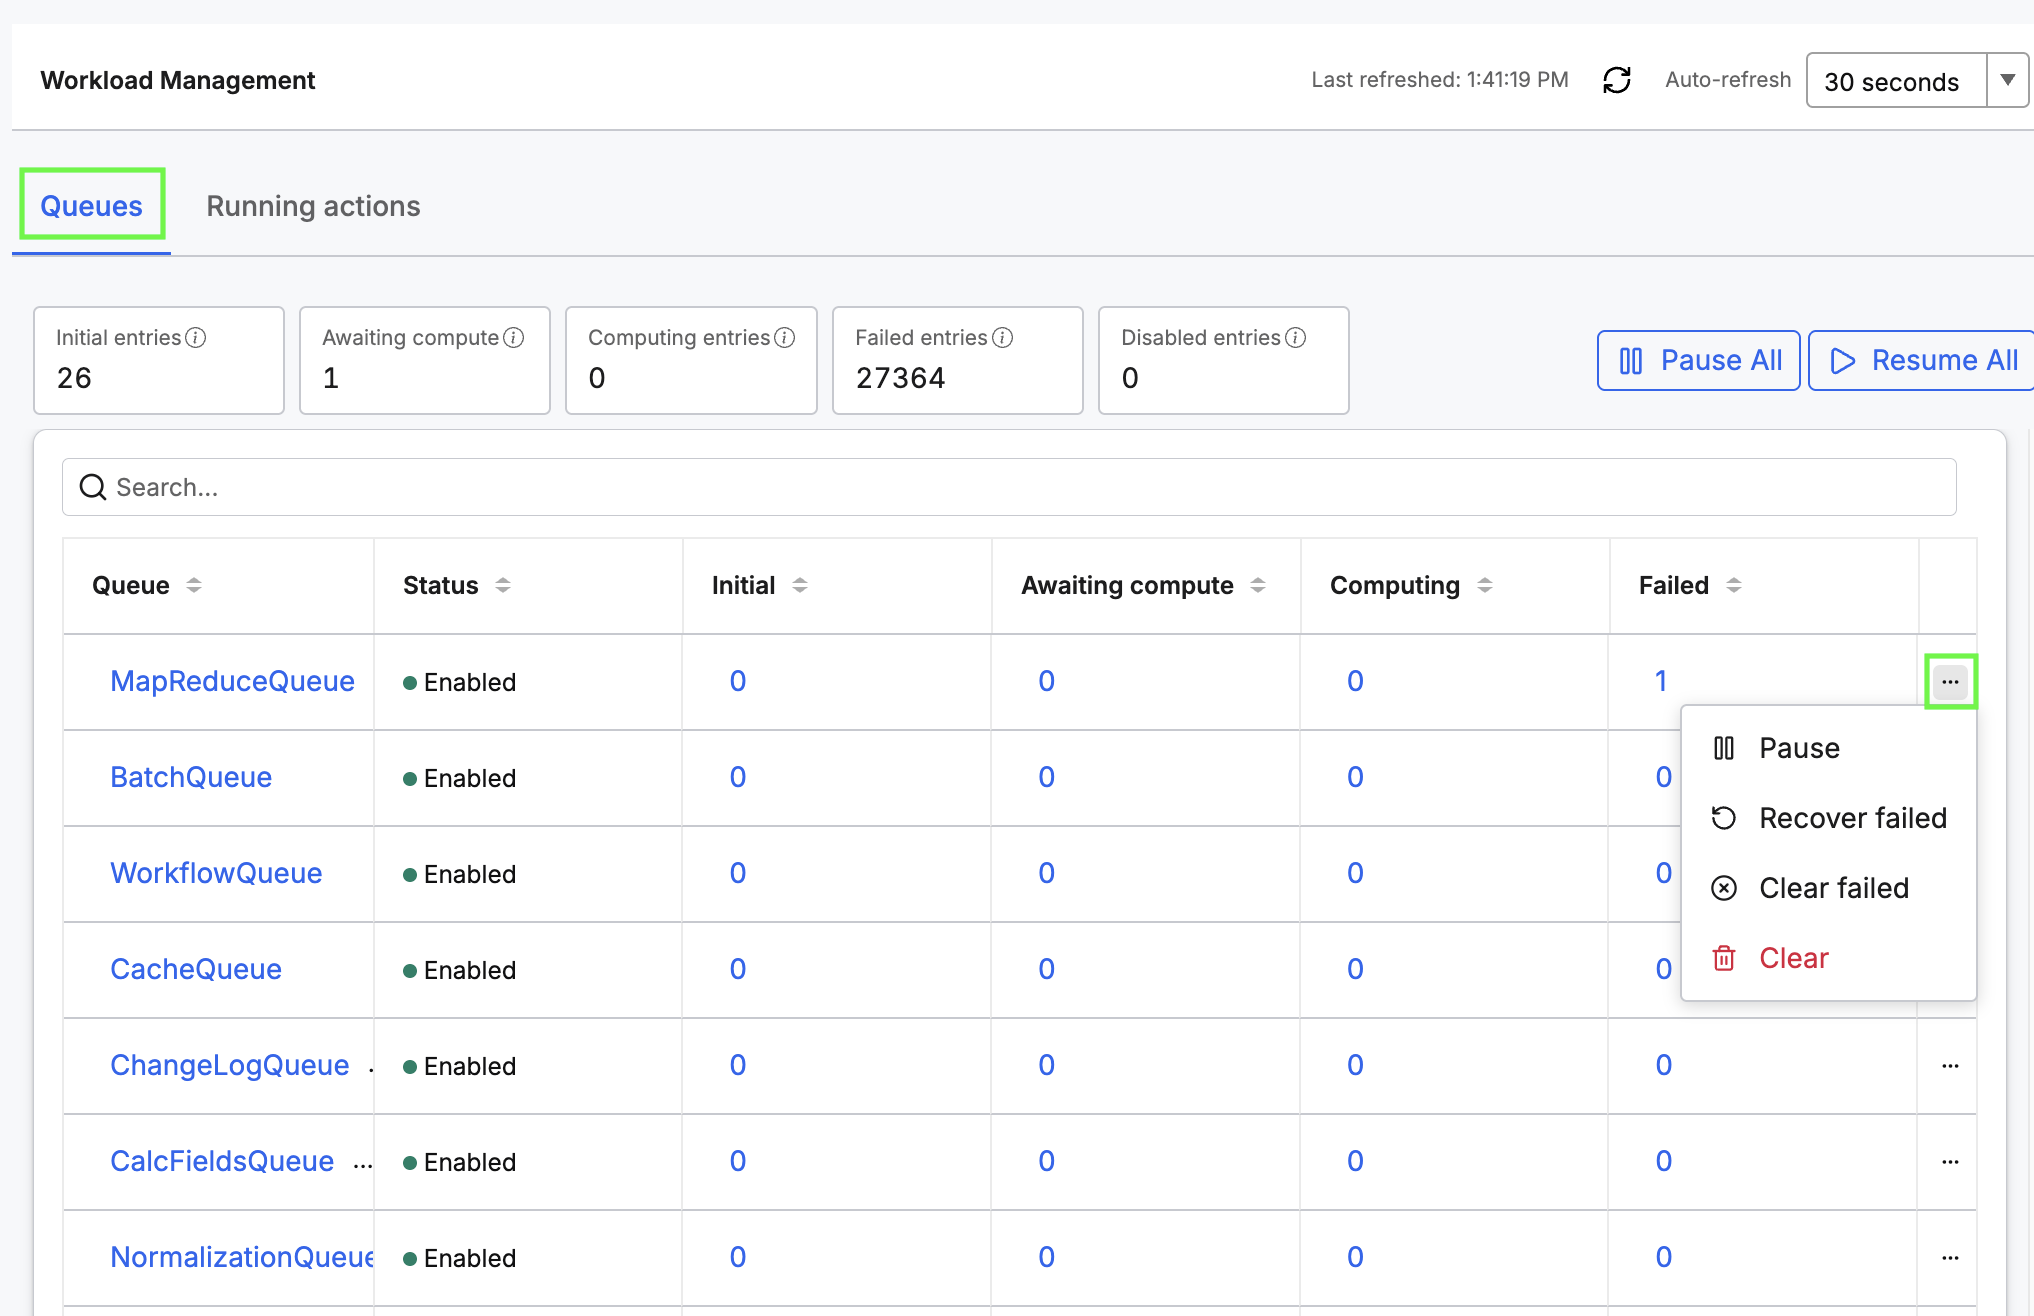
View and manage queues for the application in the Queues tab.
 |
| Queues in Workload Management |
The tiles above the table show the total number of entries across all queues:
- Initial entries
- Awaiting compute
- Computing entries
- Failed entries
- Disabled entries.
Select Pause All or Resume All to pause or resume every queue at once.
The table lists each queue, whether it is enabled or paused, and its entry counts by status. Use the search box to find a queue by name.
- Select a queue name to open its details page.
- Select an entry count to open the queue on that status.
- Use the ellipses icon on the right of a row to pause or resume the queue, recover failed entries, clear failed entries, or clear all entries from the queue.
For more information on types of queues, list of queues, or queues specific to cloud data processing, see Monitor and Manage Queues.
Queue details
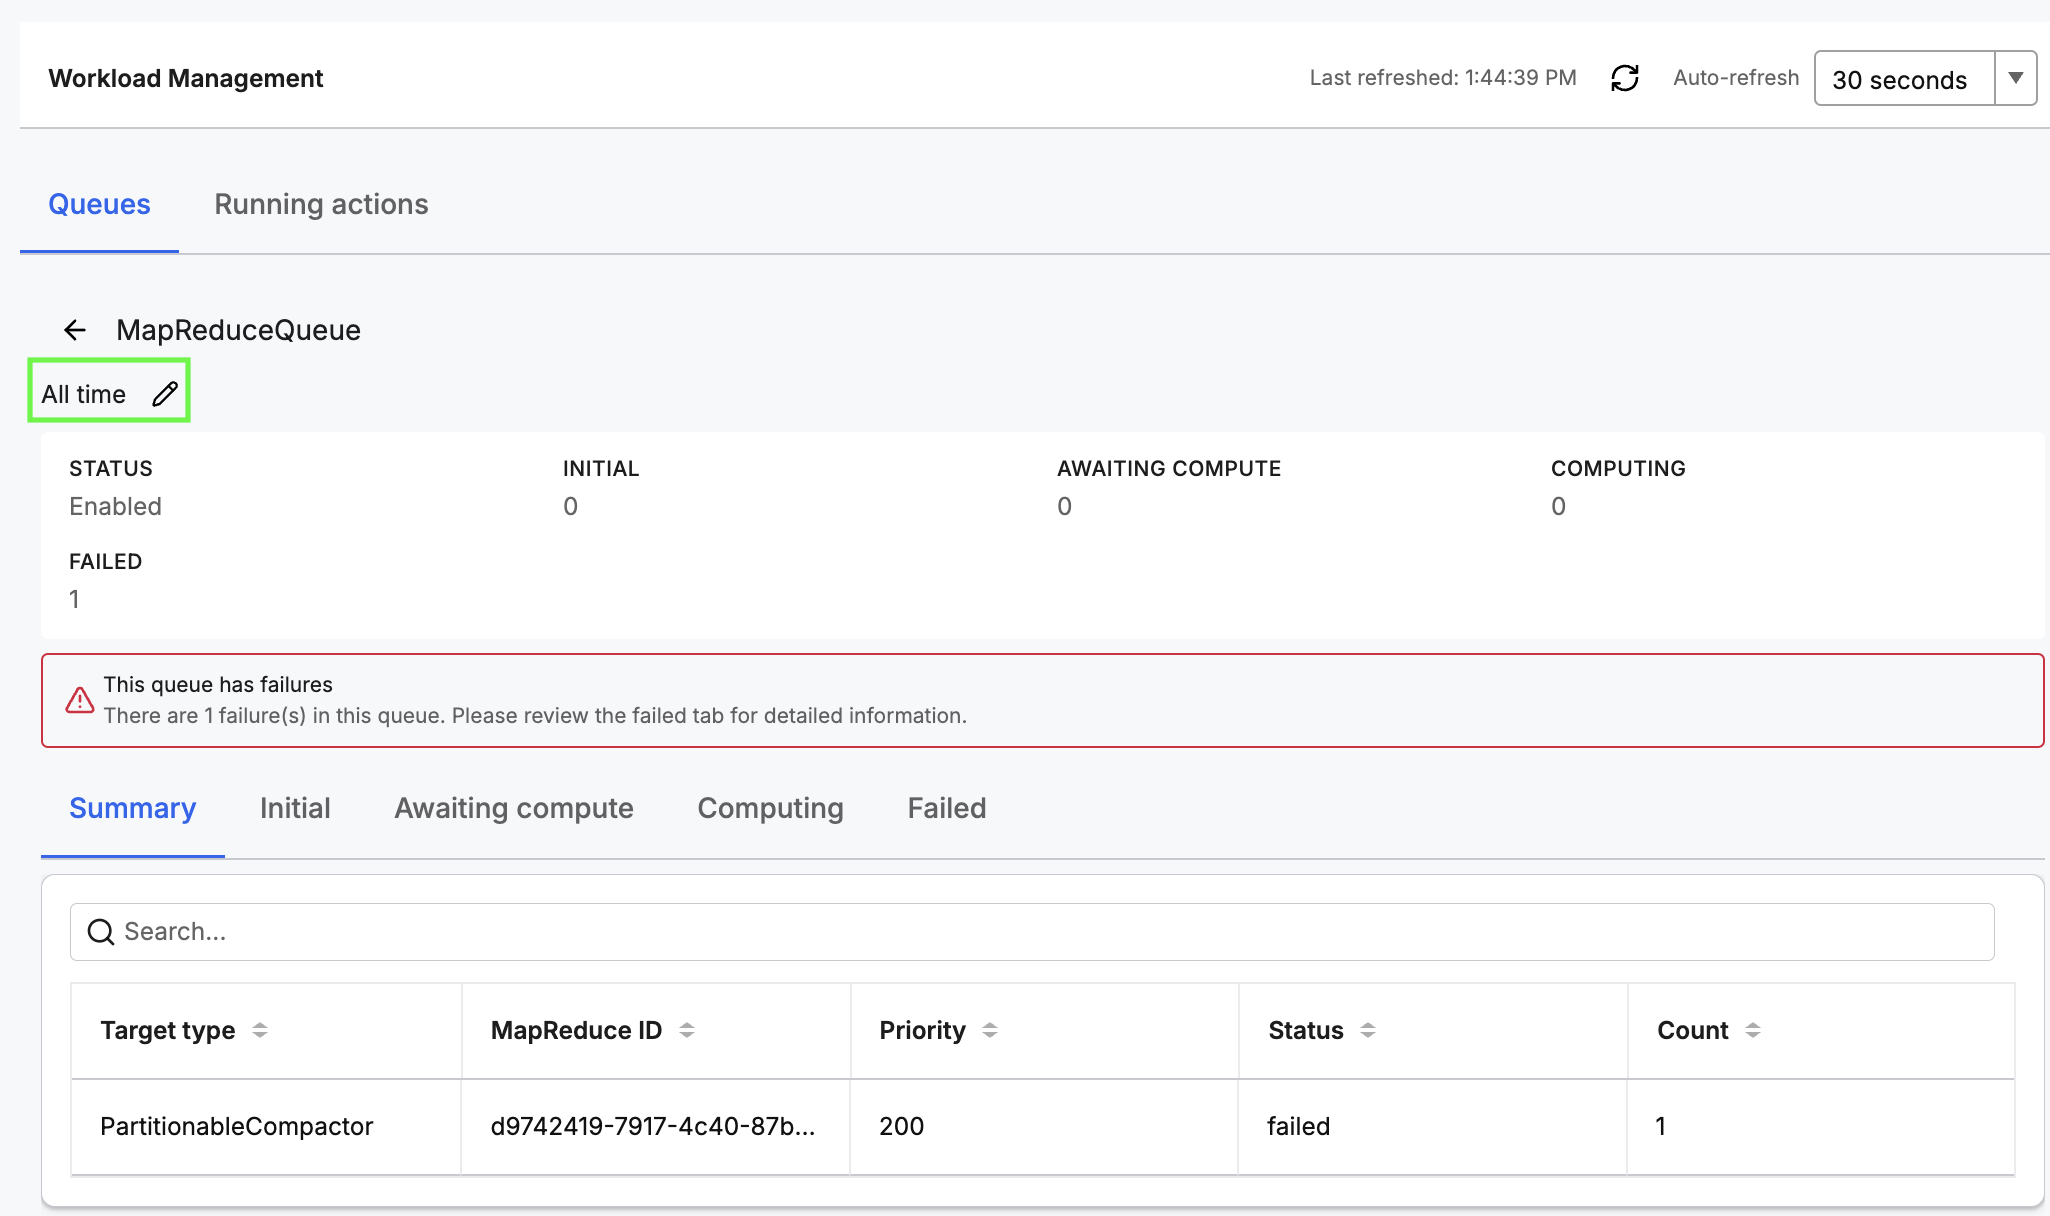
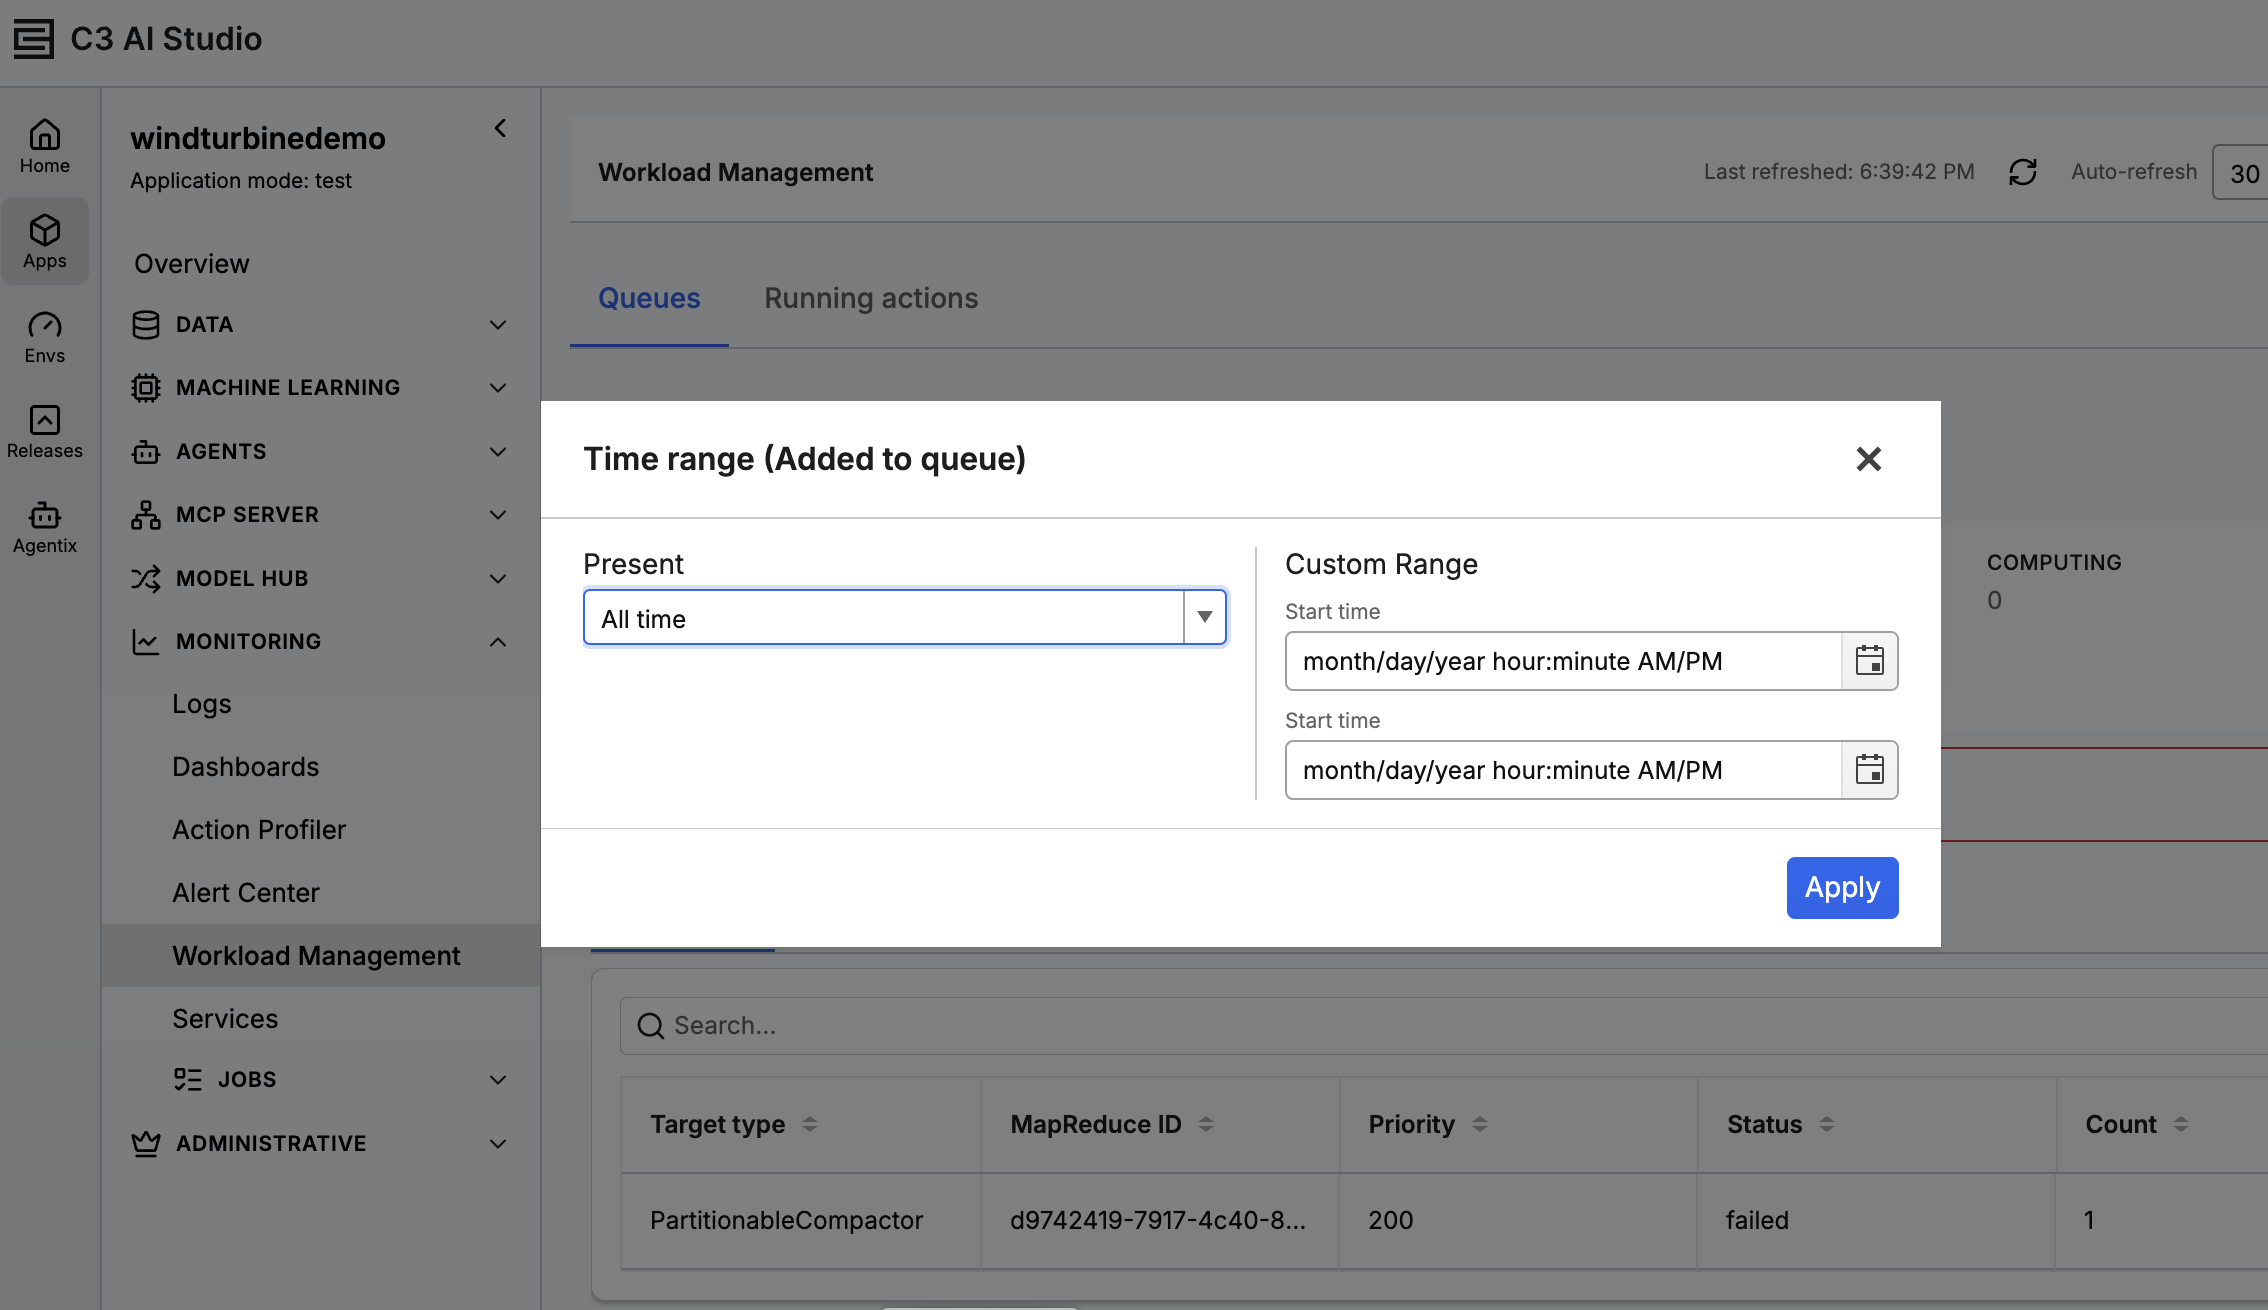
Select a queue name or an entry count in the Queues tab to open its details page. You can use the date range control to filter entries by when they were added to the queue. The default is set to All time.
Use the tabs to view entries by status.
- Summary - entry counts grouped by target type, priority, status and a queue-specific identifier column (for example, MapReduce ID). Use the search box to filter the results.
- Initial, Awaiting compute, Computing - entries currently in that status.
- Failed - failed entries, with the entry ID, priority, error message, a queue-specific identifier column, and the time the entry was added to the queue.
 |
| Queue details page |
 |
| Adjust Date Range |
If the queue has failed entries, a banner that says This queue has failures appears. Select the Failed tab and then select an error message to view the full error detail.
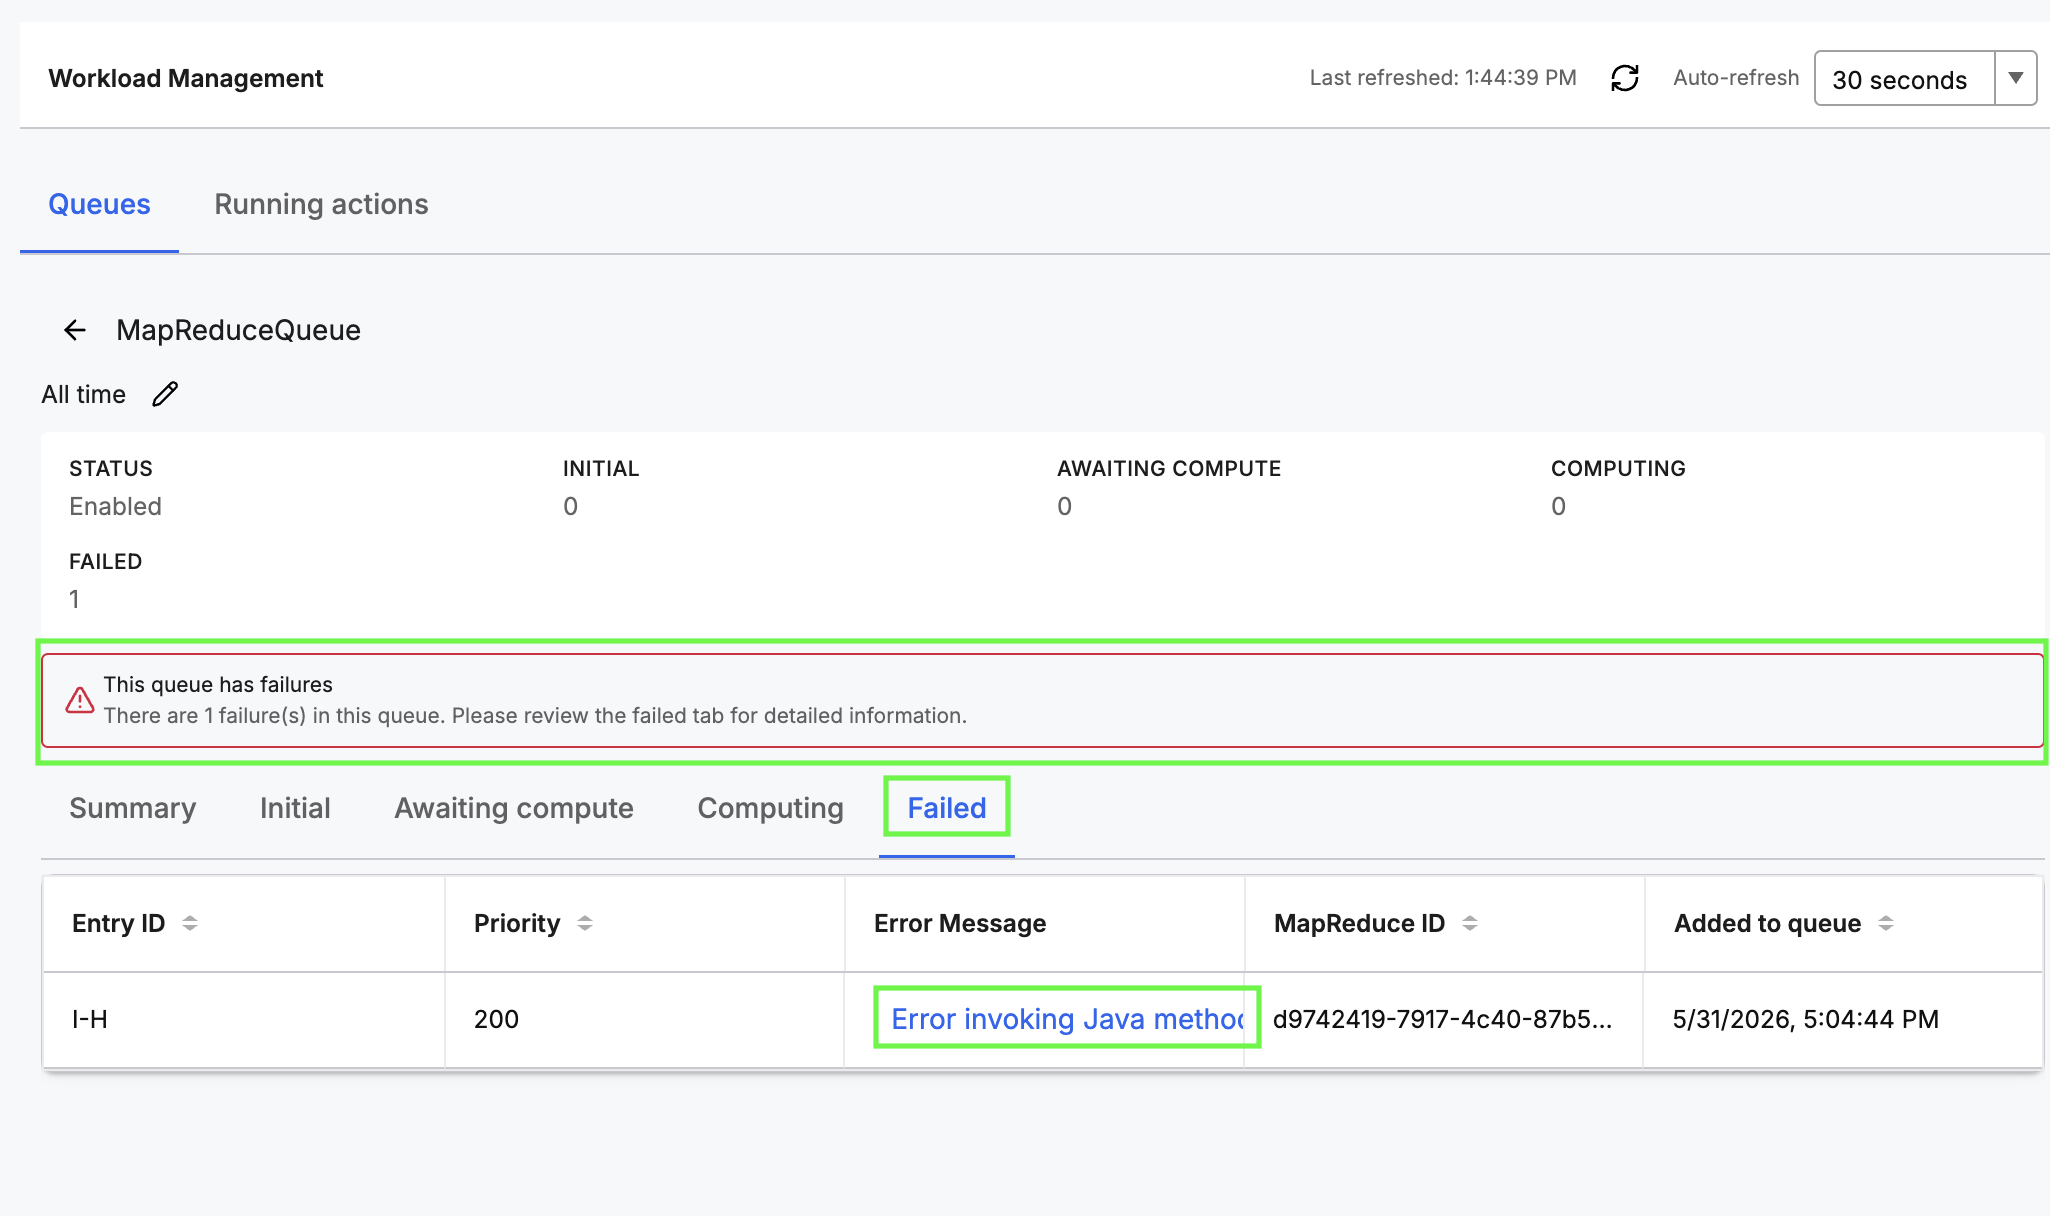 |
| Failed Entry |
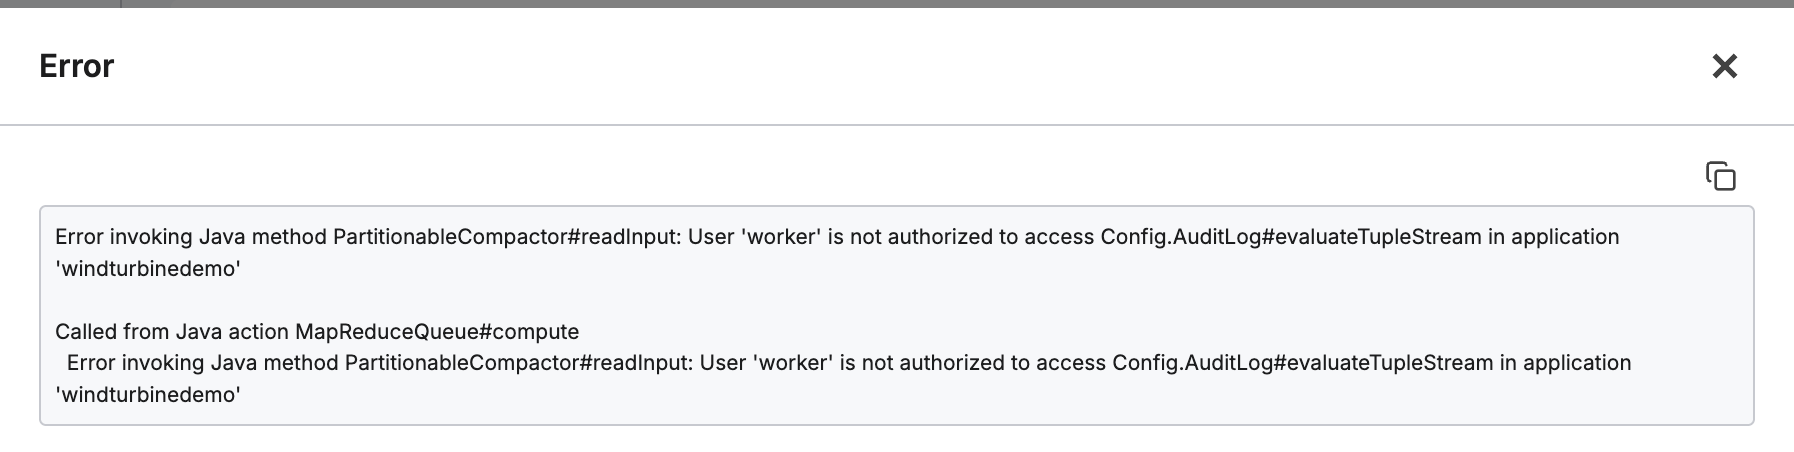 |
| Error Message |
Running actions
Monitor and manage the actions for your application in the Running actions tab.
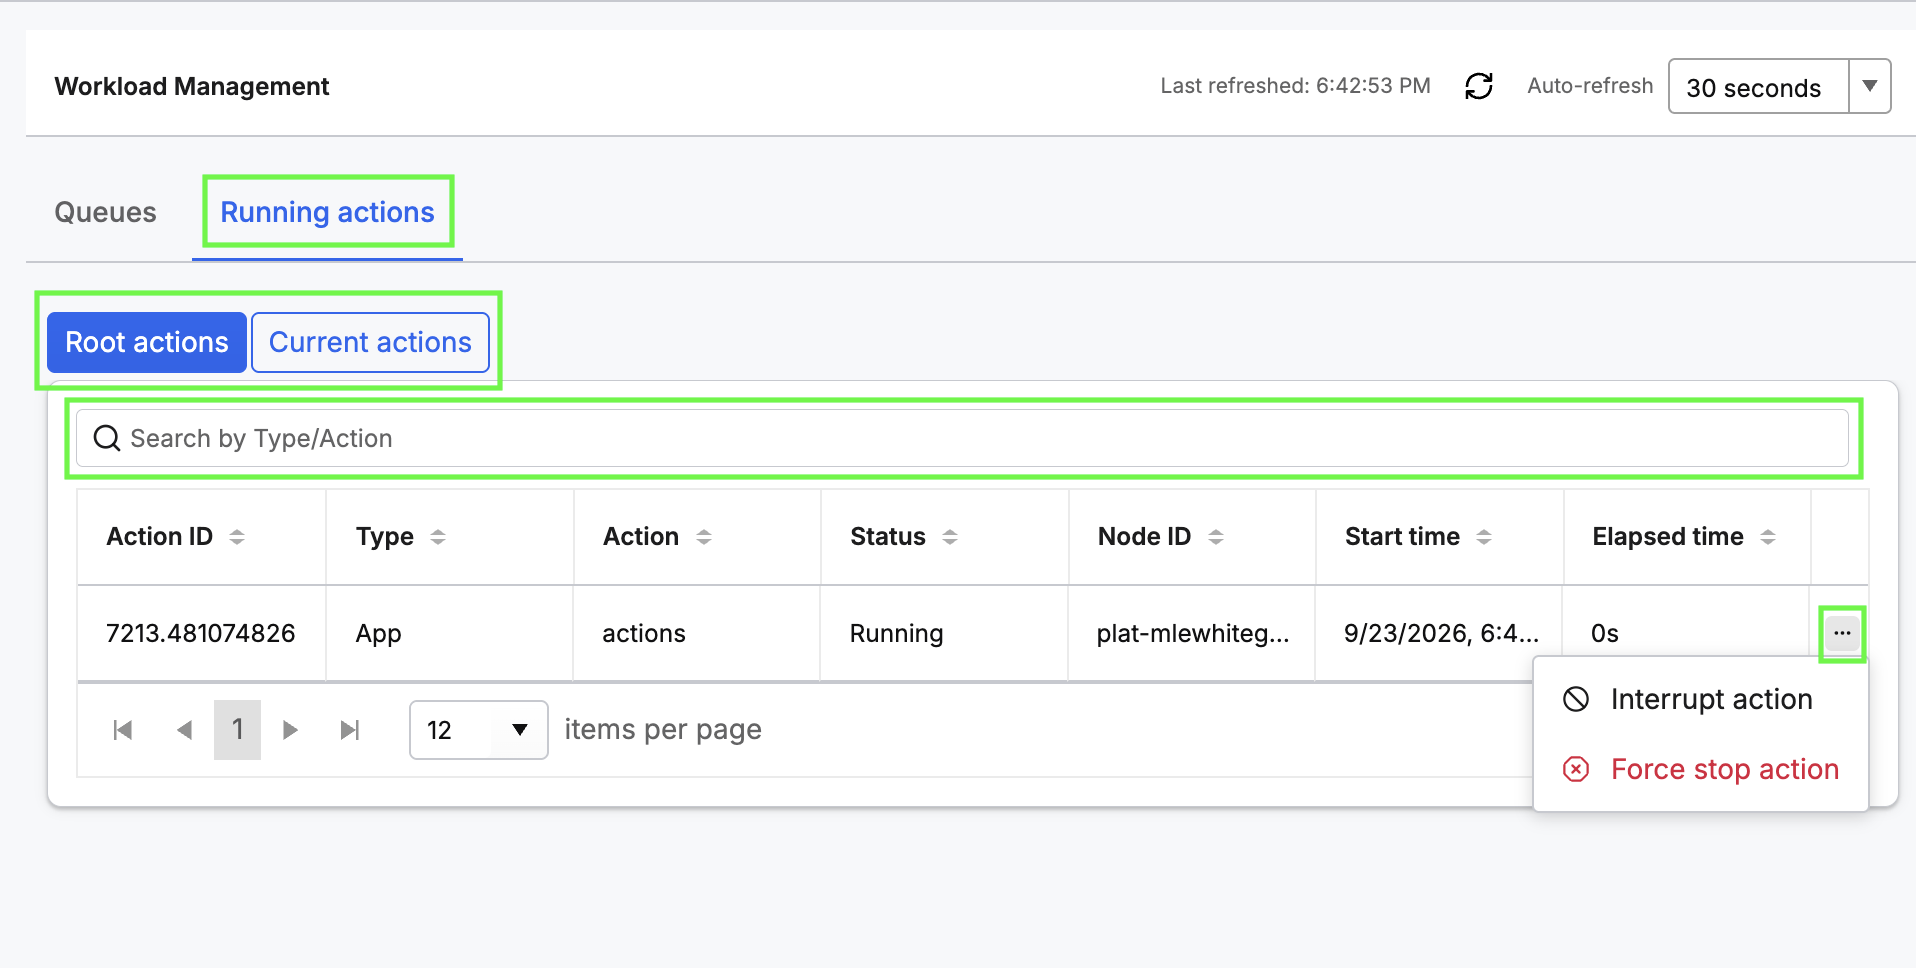 |
| Running Actions Tab |
Select Root actions or Current actions to filter the list. Use the search box to find an action by type or action name.
The table lists each action with its ID, type, action, status, node ID, start time, and elapsed time. Use the ellipses icon at the end of a row to manage a running action.
- Interrupt action - stop the action gracefully
- Force stop action - stop the action immediately
Select an action row to open its details in a side panel.
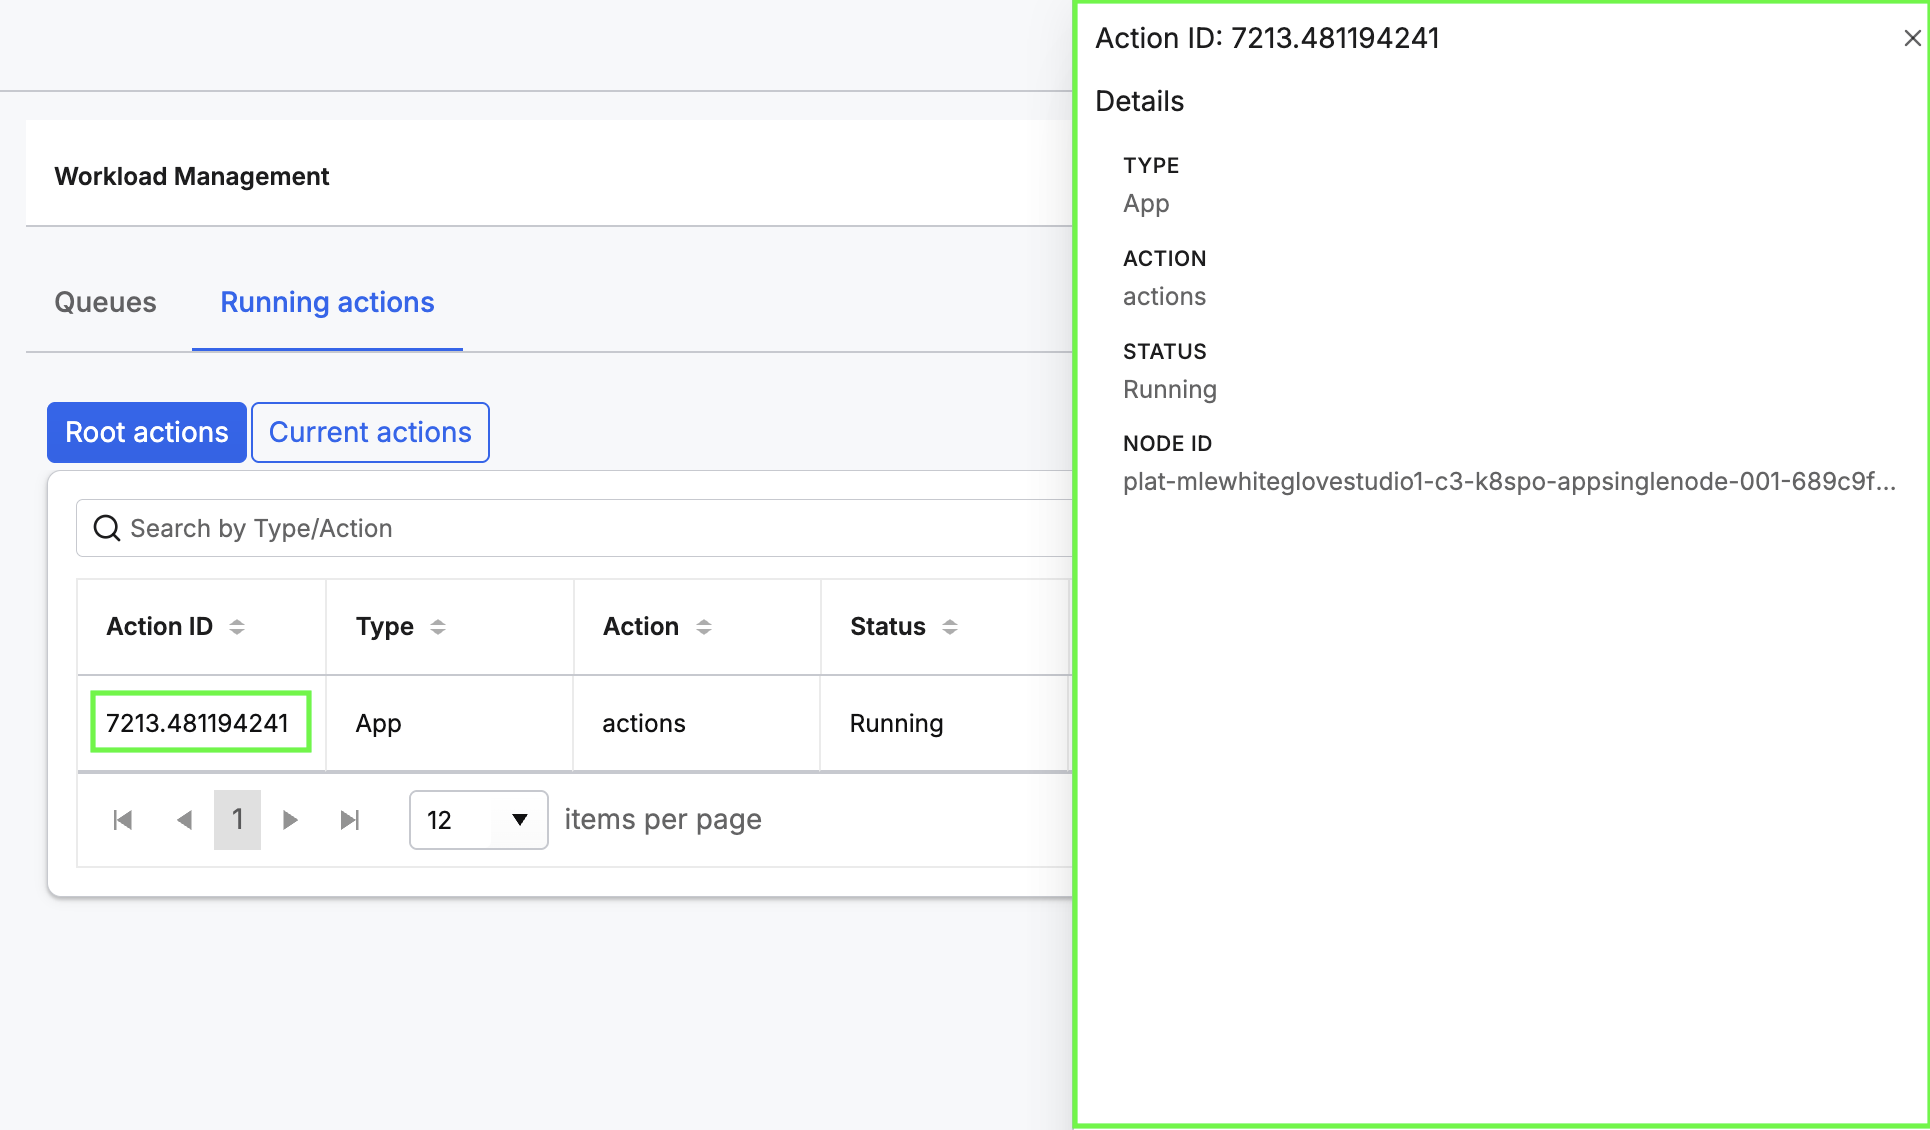 |
| Action Details Panel |
The panel header shows the Action ID and the Details section lists the following:
- Type
- Action
- Status
- Node ID
Select the X at the top right to close the panel.