C3 AI Analytics
Analytics provide an interface through which users can query and aggregate complex data associated with a C3 AI Object. Data takes the form of a timeseries on which further operations can be performed.
Prerequisites
The user must be in the appropriate Admin Group and have the correct roles to be authorized to read data from the selected C3 Type. By default, C3 AI follows the principle of least privilege and users may not have been granted access to retrieve data from C3 Types. Please speak to the C3 AI Support Team to ensure proper setup.
Configuration
| Field | Description |
|---|---|
| Name default=none | A user-specified node name displayed in the canvas |
| Metrics Required | The metrics, timeseries, or features to be retrieved from the selected C3 Type. |
| Metrics are instructions for how to transform data that is modeled as timeseries, into Time series data. They are used to generate data like the electricity consumption of a building and may be used as features for machine learning models (e.g., a trailing 3 day average of electricity consumption). |
Node Inputs/Outputs
| Input | A C3 AI Type node. The C3 AI Type Node and its associated selected C3 Type (i.e., Service Point, Organization, Meter Asset. etc.) is the only allowable input. |
|---|---|
| Output | None. Connect the C3 AI Analytics node to a C3 Evaluate Analytics node and specify a date range/interval to retrieve the desired data. |
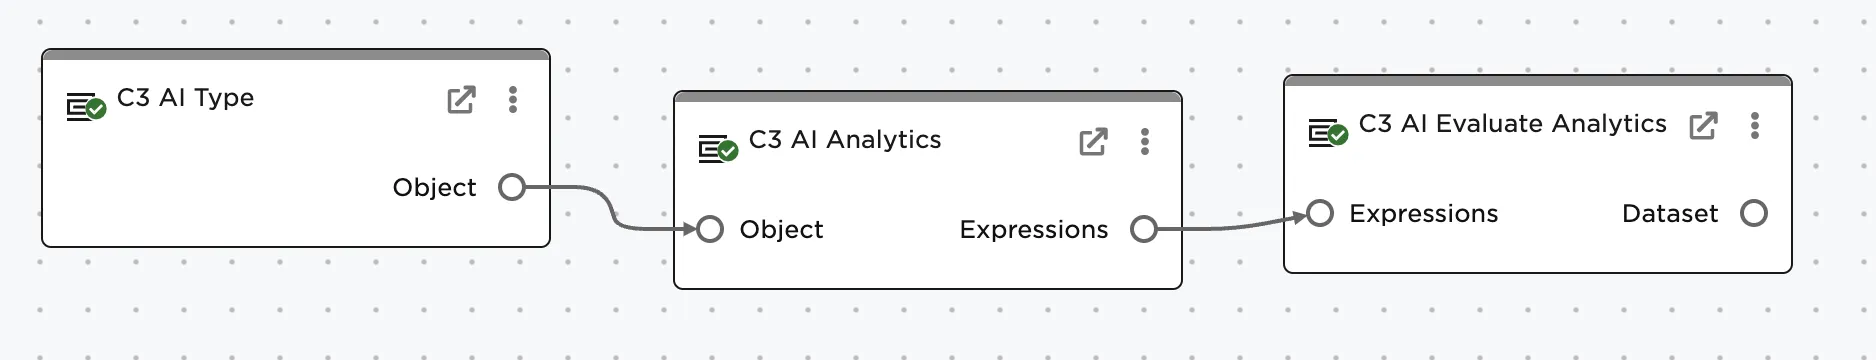
Figure 1: Example node setup. Note the node must take a C3 AI Type node as input and output to a C3 AI Evaluate Analytics node before data will load.
Examples
Examples assume the "ServicePoint" Type is being used. A ServicePoint represents a service delivery point or customer using electricity in their home.
Connect the C3 AI Analytics node to the properly configured C3 AI Type node.
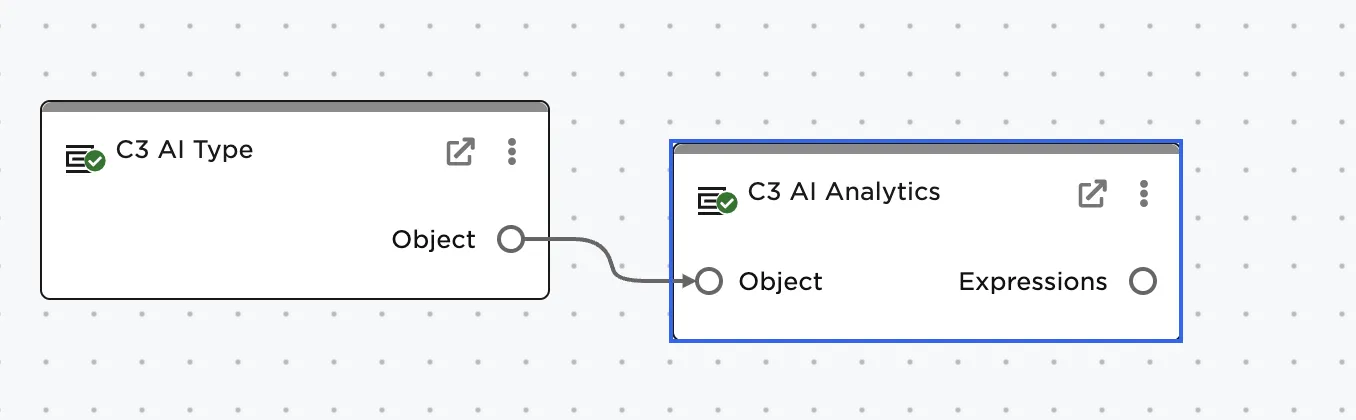
Figure 2: Connecting the nodes
Use the dropdown and select the desired timeseries / features to be retrieved
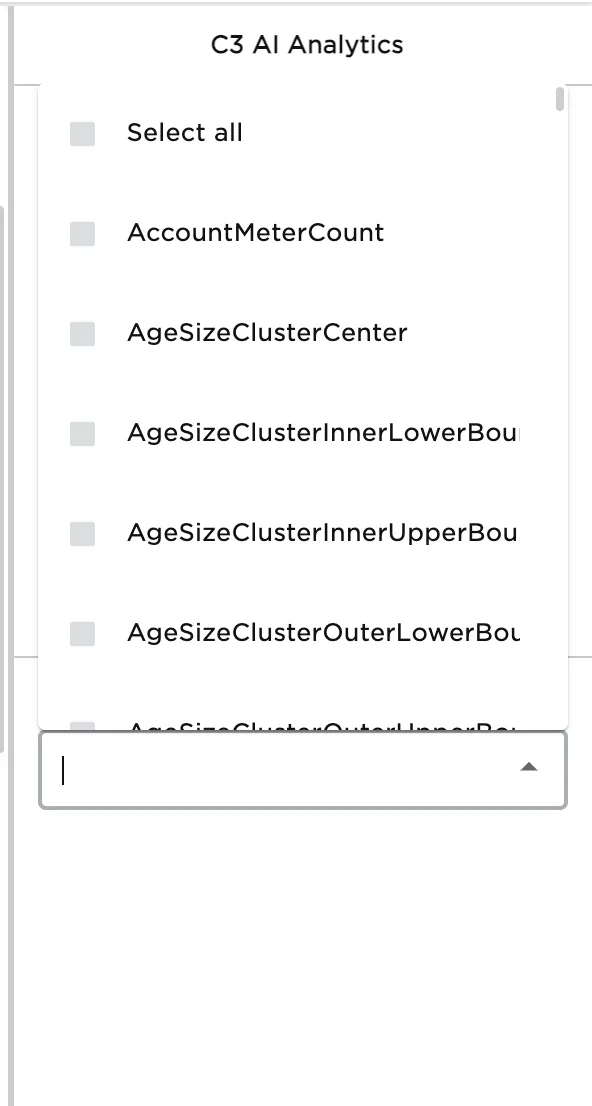
Figure 3: Using the drop down to select metrics
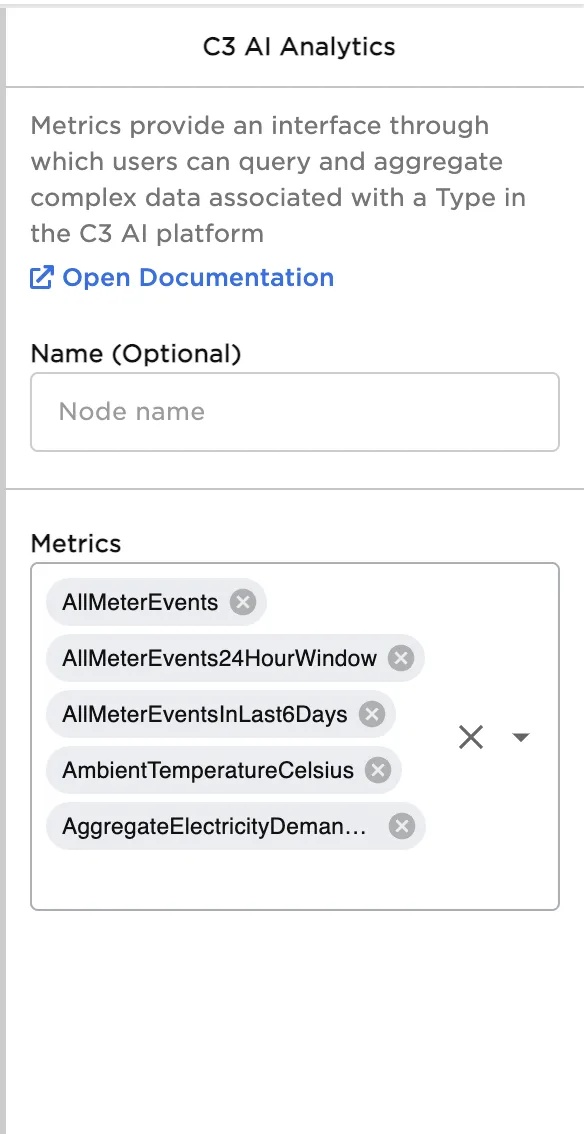
Figure 4: Resulting properties panel configuration