C3 AI Custom TS Decl
C3 AI Analytics take the form of a timeseries on which further operations can be performed. They may be used to represent the electricity consumption in a building over time or a failure event of the grid over time.
The C3 AI Custom TS Decl node evaluates a custom user-defined time series analytic.
There are four categories of Timeseries objects we can produce with TSDecl metrics:
- Continuous Numeric: has a standard time interval which reports a data point. This could be body temperature, heart rate, electricity consumption, etc.
- Continuous Enumerated: similar to continuous numeric, except there is an itemized list of values each time can be associated with, rather than any kind of numeric value. This can be a history of statuses (e.g., when a device was on or off).
- Discontinuous Point Events: occur at any point in time and do not have a standard time interval. For example, a lightbulb is switched on at 12:05pm, and it's switched off at 12:15pm.
- Discontinuous Interval Events: these can occur at any point in time, but they are time bound. For example, an outage occurred from 3:03pm to 3:05pm.
To learn more about Metrics and TSDecl metrics, navigate to docs.c3.ai.
Prerequisites
The user must be in the appropriate Admin Group and have the correct roles to be authorized to read data from the selected C3 Type. By default, C3 AI follows the principle of least privilege and users may not have been granted access to retrieve data from C3 Types. Please speak to the C3 AI Support Team to ensure proper setup.
Configuration
| Field | Description |
|---|---|
| Name | A user-specified node name displayed in the canvas |
| Output Column Name | The column name to be shown if the custom time series analytic is connected to a C3 AI Evaluate Analytics node. |
| Path | Specifies how to the get to the data of interest TSDecl metrics should lead to a relational C3 Type that has a direct reference to the CollectionType |
| DataField | Field that holds an array of the CollectionType |
| Treatment | Specify how to convert non timeseries data to timeseries data (options include PREVIOUS, RATE, INTEGRAL) This argument specifies the kind of treatment applied for aggregation or disaggregation on the data for metric creation as well as for normalization. |
| Start Expression | Start time of the event/data point |
| End Expression | End time of the event/data point (may not be applicable) |
| Value Expression | Expression on the data at the end of the path. Multiple Options: 1. Convert something like a string or a status into a number that can be aggregated into a timeseries. 2. Value that will be carried out throughout the timeseries 3. A value directly from a field on the collection type. 4. Left undefined or empty if the treatment selected already determines the value to be returned. (For example the COUNT treatment) |
| Overlap Handling | Indicates how to handle overlapping data points when converting a to time series. Options are "AVG", "MIN", "MAX", "SUM" and default is "AVG" |
| Rollup Function | Indicates how to aggregate across individual timeseries constructed at the end of path using the time series declaration. Options are "OR", "AND", "SUM", "AVG", "MIN", "MAX", "MEAN", "MEDIAN", "VARIANCE", "STDDEV". Default is null and all the data points for all end of path objects will be fed into a single timeseries |
| Filter Expression | Filter to be applied on the data points |
| Transform Expression | Transformation applied on the value expression Typical to fill missing with this step |
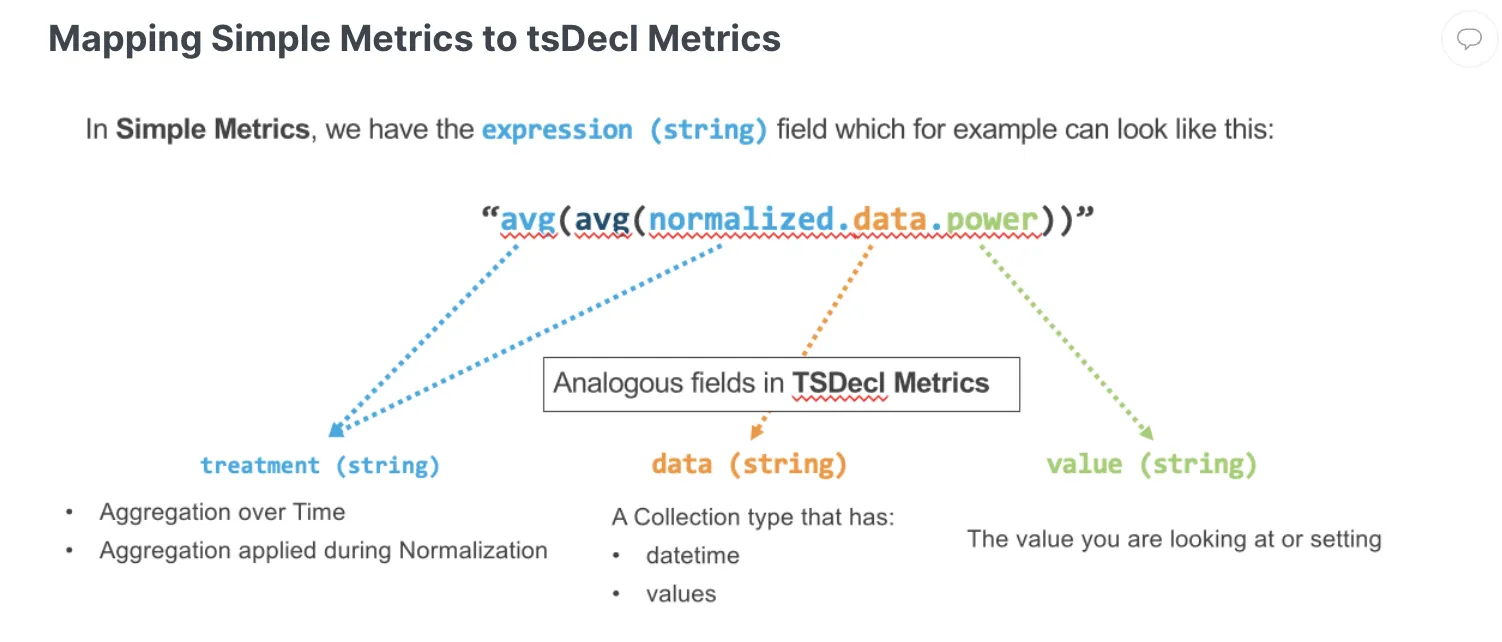
The following shows a mapping of a TSDecl to a simple metric.
Node Inputs/Outputs
| Input | A C3 AI Type node. The C3 AI Type Node and its associated selected Type (i.e., Service Point, Organization, Meter Asset. etc.) is the only allowable input. |
|---|---|
| Output | None. Connect the C3 AI Custom TS Decl node to a C3 AI Evaluate Analytics node and specify a date range/interval to retrieve the desired data. |
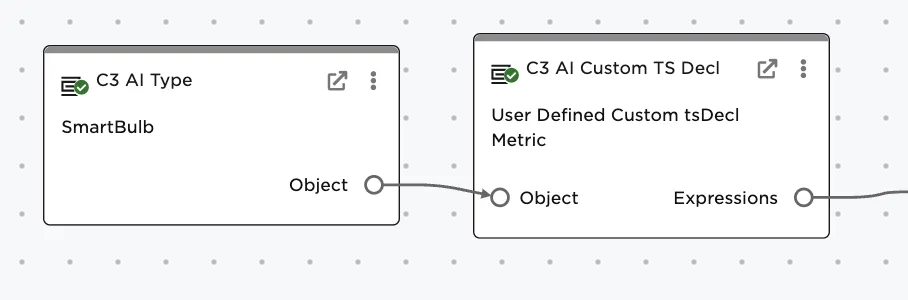
Figure 1: Example node setup. Note the node must take a C3 AI Type node as input and output to a C3 AI Evalaute Analytics node before data will load.
Examples
Example is based on a "Continuous Enumerated" metric that indicates if the PowerGrid is functioning (on) or not (off). The relevant C3 Types include a SmartBulb Type that is installed in a "Fixture". The Fixture is part of an Apartment in a Building connected to the grid. The Building Type includes an array field called gridStatusSet containing information on when the grid goes from on to off and vice versa.
Connect the C3 AI Custom TS Decl node to the properly configured C3 AI Type Node
Figure 2: Connect the configured SmartBulb Type node to the Custom TS Decl node.
Now configure the C3 AI Custom TS Decl node.
- Specify the output column name: "PowerGridStatus"
- Add the path. The path based on the information and data model is: SmartBulb → fixture → apartment → building
- Enter the data field: "gridStatusSet"
- Add the timestamp column: "timestamp"
- The treatment should maintain the PREVIOUS value--the grid is on until it is off, and off until switched back on
- The value where the grid status is captured: "value"
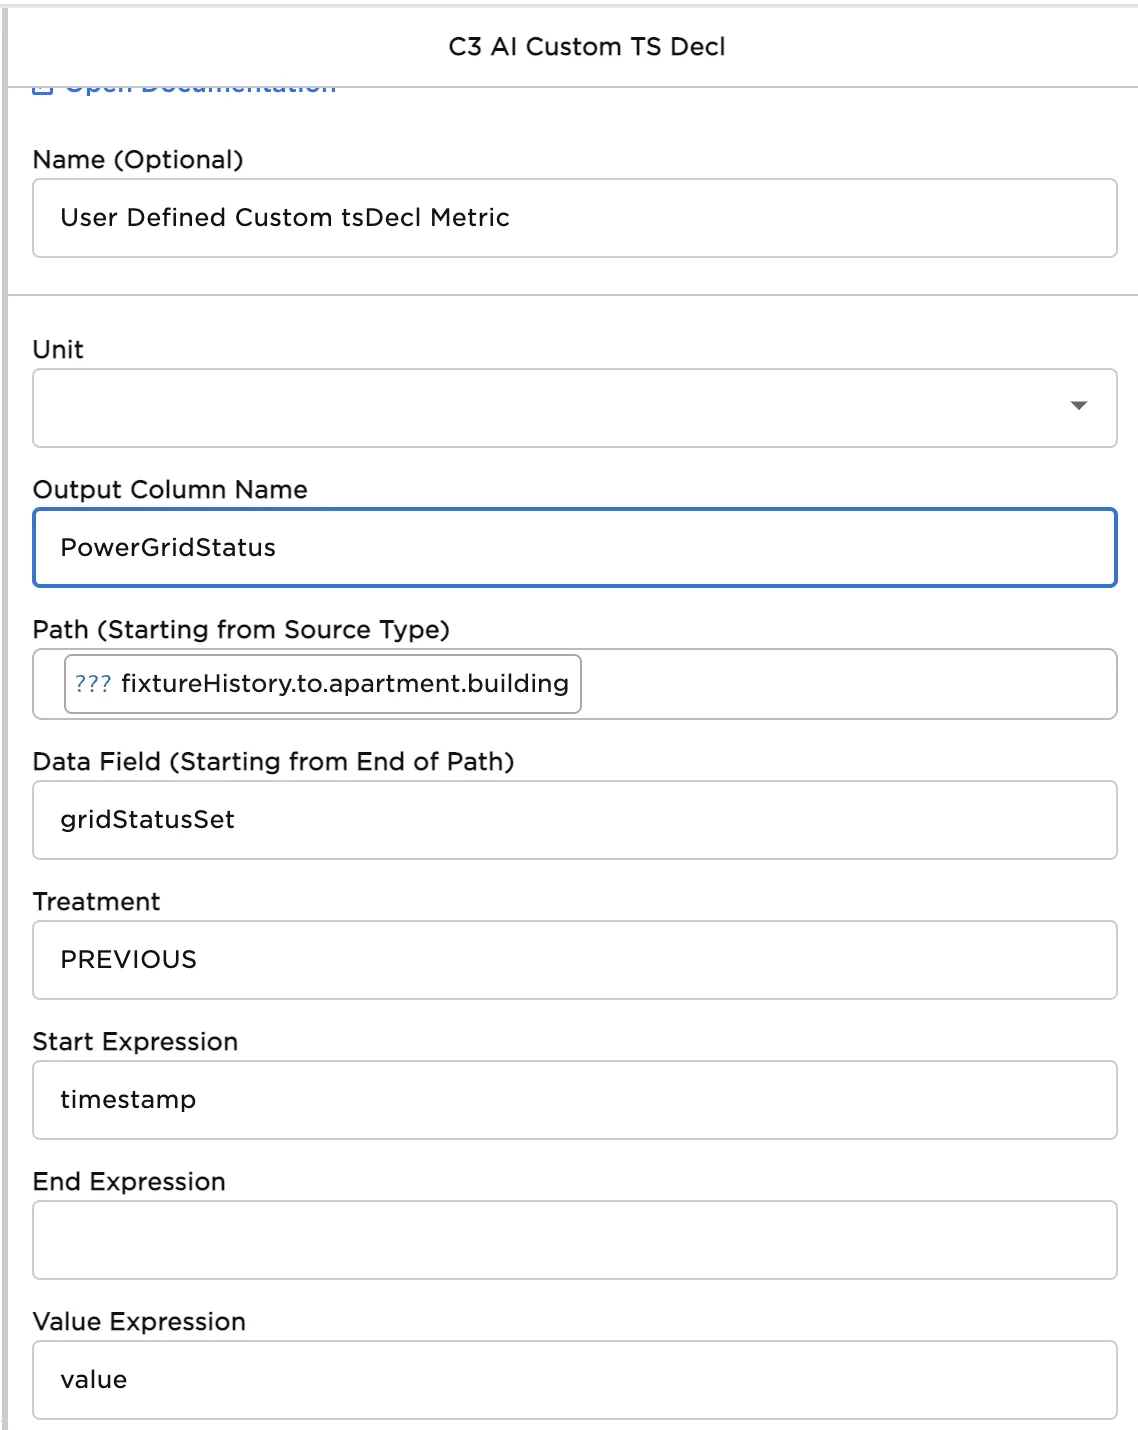
Figure 3: Configuring the Custom TS Decl