C3 AI Expression
The C3 AI Expression node allows users to create a custom compound metric for evaluation.
Compound metrics are built on top of simple and other compound metrics to produce increasingly complex transformations of data. They are frequently used to create features for use in machine learning models.
To learn more about compound metrics, and metrics in general, visit the C3 AI documentation site at docs.c3.ai.
Prerequisites
The user must be in the appropriate Admin Group and have the correct roles to be authorized to read data from the selected C3 Type. By default, C3 AI follows the principle of least privilege and users may not have been granted access to retrieve data from C3 Types. Please speak to the C3 AI Support Team to ensure proper setup.
Configuration
| Field | Required | Default | Description |
|---|---|---|---|
| Name | None | A user-specified node name displayed in the canvas | |
| Output Column Name | None | The column name to be shown if the expression is connected to a C3 AI Evaluate Analytics node. | |
| Expression (Starting from End of Path) | ✓ | None | User defined expression to be used for evaluation. Expression to create compound metric. Expressions can use logical and mathematical operators from Javascript (e.g., +, -, *, /, &&, ||) or any function available in the ExpressionEngineFunction |
Node Inputs/Outputs
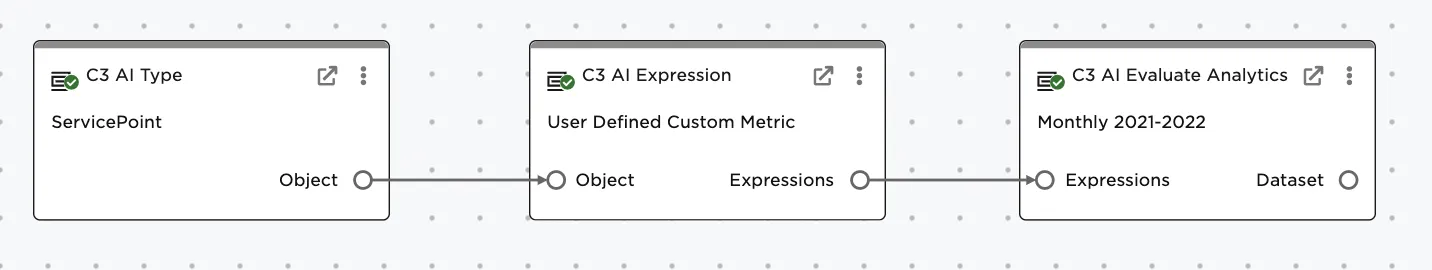
The node takes a C3 AI Type node as an input. Connect the C3 AI Expression node to a C3 AI Evaluate Analytics node and specify a date range/interval to retrieve the desired data as a dataframe.
The following image shows how to connect the nodes:
Examples
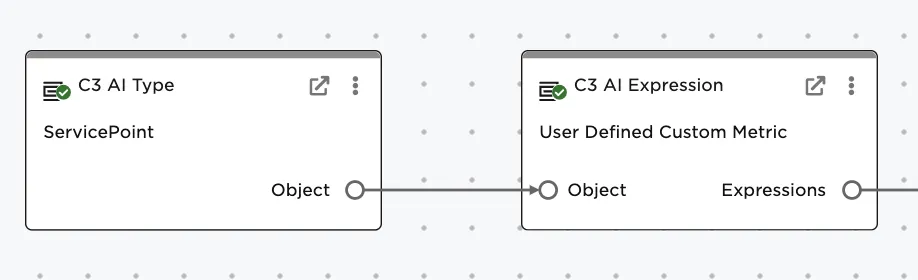
The example is based on creating a new custom metric from a set of ServicePoints. A ServicePoint represents a service delivery point or customer using electricity in their home.
Connect a C3 AI Type node with ServicePoint selected to the C3 AI Expression node, as shown in the following image:
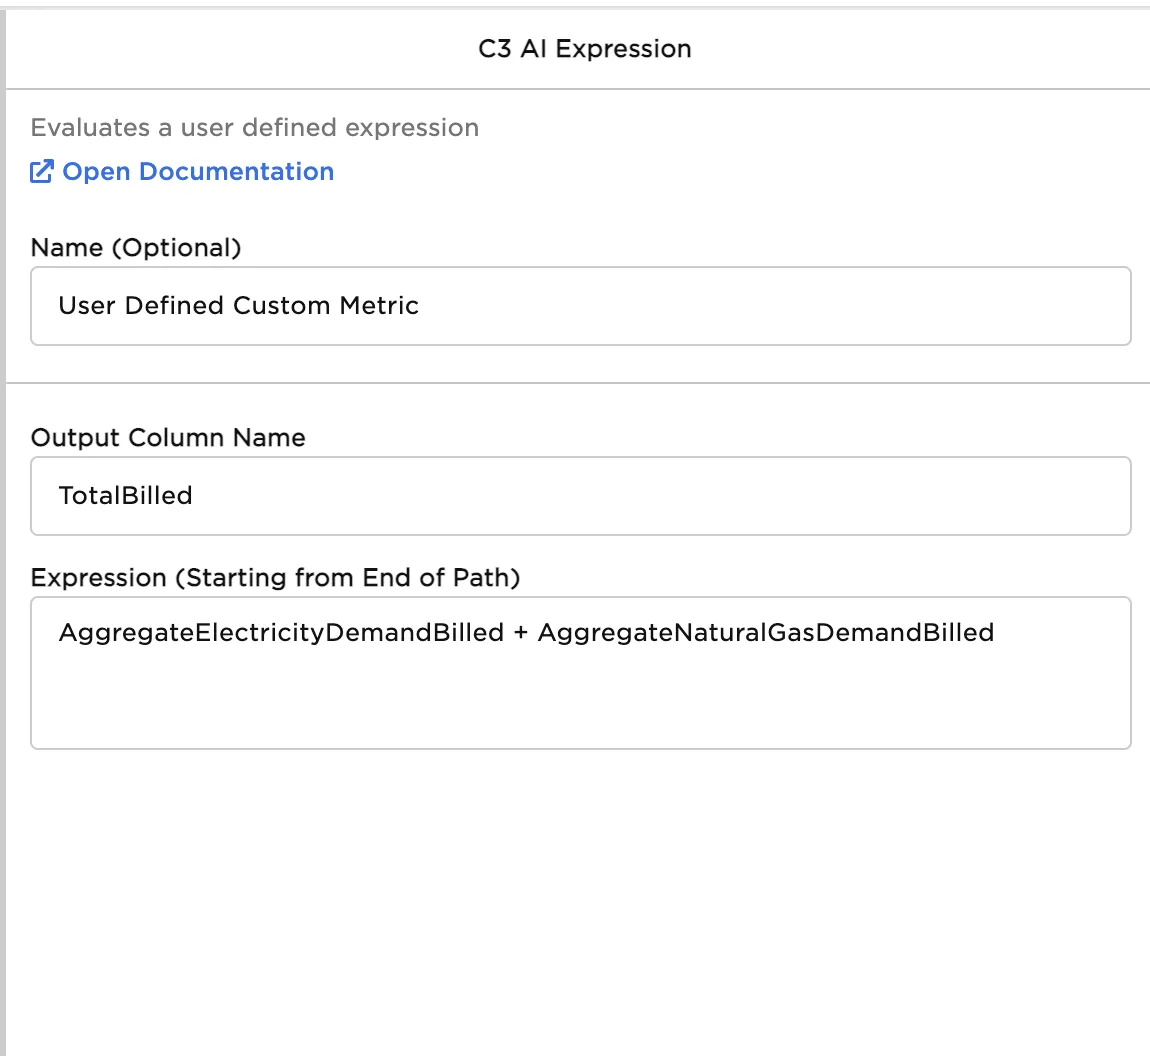
The C3 AI Expression node needs a column name, which becomes the column name in the Visual Notebooks dataframe after metric evaluation. In this example, "TotalBilled" is used.
A user defined expression is entered in the "Expression" field. Expressions can use logical and mathematical operators from Javascript (e.g., +, -, *, /, &&, ||) or any function available in the ExpressionEngineFunction. The example does a simple sum of two SimpleMetrics--the ElectricityDemandBilled and NaturalGasDemandBilled--to create a "TotalBilled" feature.
Name the new feature column and enter an expression, as shown in the following image:
Commonly used functions
The following table shows additional common functions used in compound metrics:
| Category | Functions |
|---|---|
| Aggregate Functions | min, max, avg, sum, and, or, count, median, stddev, variance |
| Time Series Transformations | rolling, window, eval, aggregate, available, linearDecay, exponentialDecay, fillMissing, interpolate, percentile, rollingDiff, rollup, scaleMinMax, scaleStandard, removeOutliers |
| Arithmetic Functions | ceil, floor, round, abs, random, cos, acos, sin, asin, tan, atan, cuberoot, dotProduct, exp, log, pow, sqrt |
| String Functions | concat, contains, startsWith, endsWith, length, join, lowerCase, upperCase, matchCount, matchesRegex, findAll, replace, substring, split |
| Type Casting Functions | string, number, dateTime, bool, data, convertToUnit |
| Miscellaneous Functions | exists, not, intersects, unique, count, ascending, descending, harvesineDistance, map, identity |
| Time Functions | dayOfWeek, daysInYear, earliest, latest, year, month, day, hour, minute, second, timeComponent, start, end, interval, period |