C3 AI Custom Analytic
The C3 AI Custom Analytic node allows users to create a custom simple metric for evaluation.
There are four categories of Timeseries objects we can produce with simple metrics:
- Continuous Numeric: has a standard time interval which will report a data point. This could be body temperature, heart rate, electricity consumption, etc.
- Continuous Enumerated: similar to continuous numeric, except there is an itemized list of values each time can be associated with, rather than any kind of numeric value. This can be a history of statuses (e.g., when a device was on or off).
- Discontinuous Point Events: occur at any point in time and do not have a standard time interval. For example, a lightbulb is switched on at 12:05pm, and it's switched off at 12:15pm.
- Discontinuous Interval Events: these can occur at any point in time, but they are time bound. For example, an outage occurred from 3:03pm to 3:05pm
To learn more about C3 AI Metrics, please visit docs.c3.ai.
Prerequisites
The user must be in the appropriate Admin Group and have the correct roles to be authorized to read data from the selected C3 Type. By default, C3 AI follows the principle of least privilege and users may not have been granted access to retrieve data from C3 Types. Please speak to the C3 AI Support Team to ensure proper setup.
Configuration
| Field | Description |
|---|---|
| Name default=none | A user-specified node name displayed in the canvas |
| Output Column Name default=none | The column name to be shown if the expression is connected to an Evaluate Analytics node. |
| Expression (Starting from End of Path) Required | User defined expression to be used for evaluation. |
| Expression to create simple metric. Expressions can use logical and mathematical operators from Javascript (e.g., +, -, *, /, &&, | |
| Path default=none | Specifies how to the get to the data of interest--should lead to TimeseriesHeader Type |
| Unit default=none | Not Required--adds unit to value |
Node Inputs/Outputs
| Input | A C3 AI Type Node |
|---|---|
| Output | None. Connect the C3 AI Analytics node to a C3 AI Evaluate Analytics node and specify a date range/interval to retrieve the desired data. |
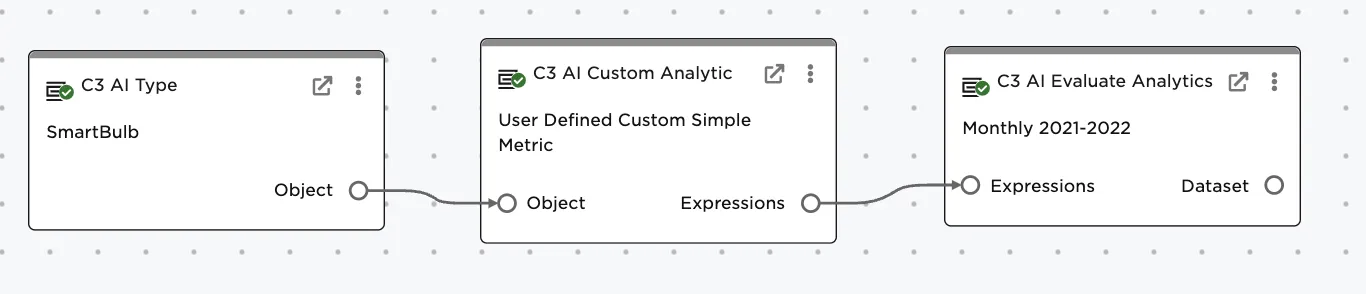
Figure 1: Preceding node is a C3 AI Type node. To retrieve data and view the resulting dataframe, connect the C3 AI Custom Analytic node to a C3 AI Evaluate Analytics node.
Examples
The example is based on creating a new simple metric from a set of SmartBulbs. The SmartBulbs contain measurement data, stored as a reference field called "measurements". This field links to a SmartBulbMeasurementSeries Type (timeseries header type). In that Type, there is a field called data which points to the SmartBulbMeasurement Type (data point type). The desired field, power, is defined on this Type. The goal of this metric is to average over space and time.
Connect a C3 AI Type node with "SmartBulb" selected to the C3 AI Custom Analytic node
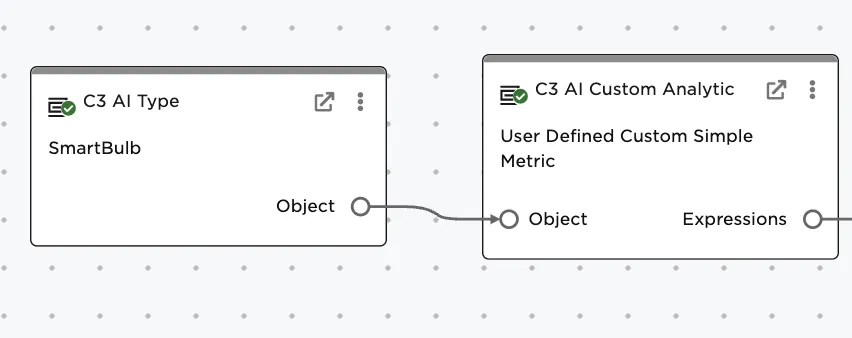
Figure 2: Connect the C3 AI Type node to the C3 AI Custom Analytic node
The C3 AI Custom Analytic node needs a column name, which becomes the column name in the Visual Notebooks dataframe after metric evaluation. In this example, "AveragePower" is used
A user defined expression is entered in the Expression field.
The path, based on the information and data model, is
SmartBulb → measurements → data → power
Moreover,
- The path gets you from the source type to the header type: "measurements"
- The expression gets you from the header type to the data you want to analyze: "data.power". The expression also dictates the logic to apply on the data: (avg(avg(normalized.data.power)))
Expressions can use logical and mathematical operators from Javascript (e.g. +, -, *, /, &&, ||) or any function available in the ExpressionEngineFunction.
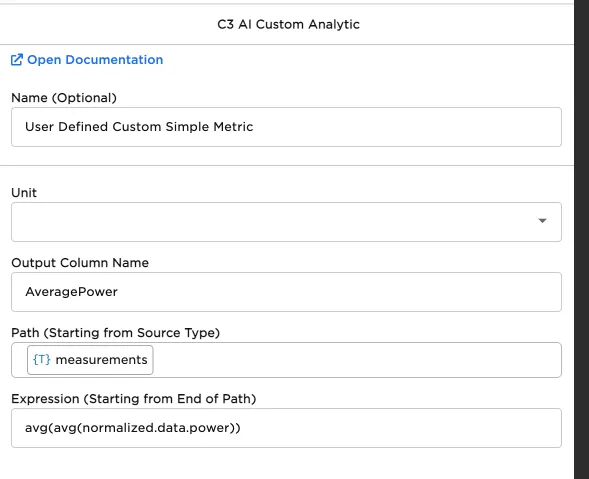
Figure 3: Configuring the Custom Analytic