MinMax Scaler
Normalize data in Visual Notebooks by scaling to a range. Normalization can be useful, and even required in some machine learning algorithms, when your data has input values and features with differing measurements and dimensions. The goal is to change the values of numeric columns in the dataset to use a common scale, without distorting differences in the ranges of values or losing information.
Scaling to a range is a good choice when you know the approximate upper and lower bounds on your data with few or no outliers, and your data is approximately uniformly distributed across that range.
Configuration
| Field | Description |
|---|---|
| Name default=none | Name of the node A user-specified node name, displayed in the canvas and in the dataframe as a tab. |
| Select columns to scale *Required | Columns to transform with scaling operation Select one or more numerical columns to scale. The same scaling parameters are applied to all selected columns. |
| Maximum *Required | Maximum value of the scaled range Enter the maximum value for the selected columns after scaling. The largest value in each column is scaled to this value. |
| Minimum *Required | Minimum value of the scaled range Enter the minimum value for the selected columns after scaling. The smallest value in each column is scaled to this value. |
Keep Original Columns default=Off | Keep columns with unscaled data Toggle this switch on to keep the unscaled columns and create a new column with the scaled data. Keep the switch on to replace the unscaled columns with scaled data. |
Output column suffix default=_scaled | Column suffix Enter a suffix to append to the scaled columns. The suffix can only contain alphanumeric characters and underscores. |
Node Inputs/Outputs
| Input | A Visual Notebooks dataframe |
|---|---|
| Output | A dataframe with scaled data |
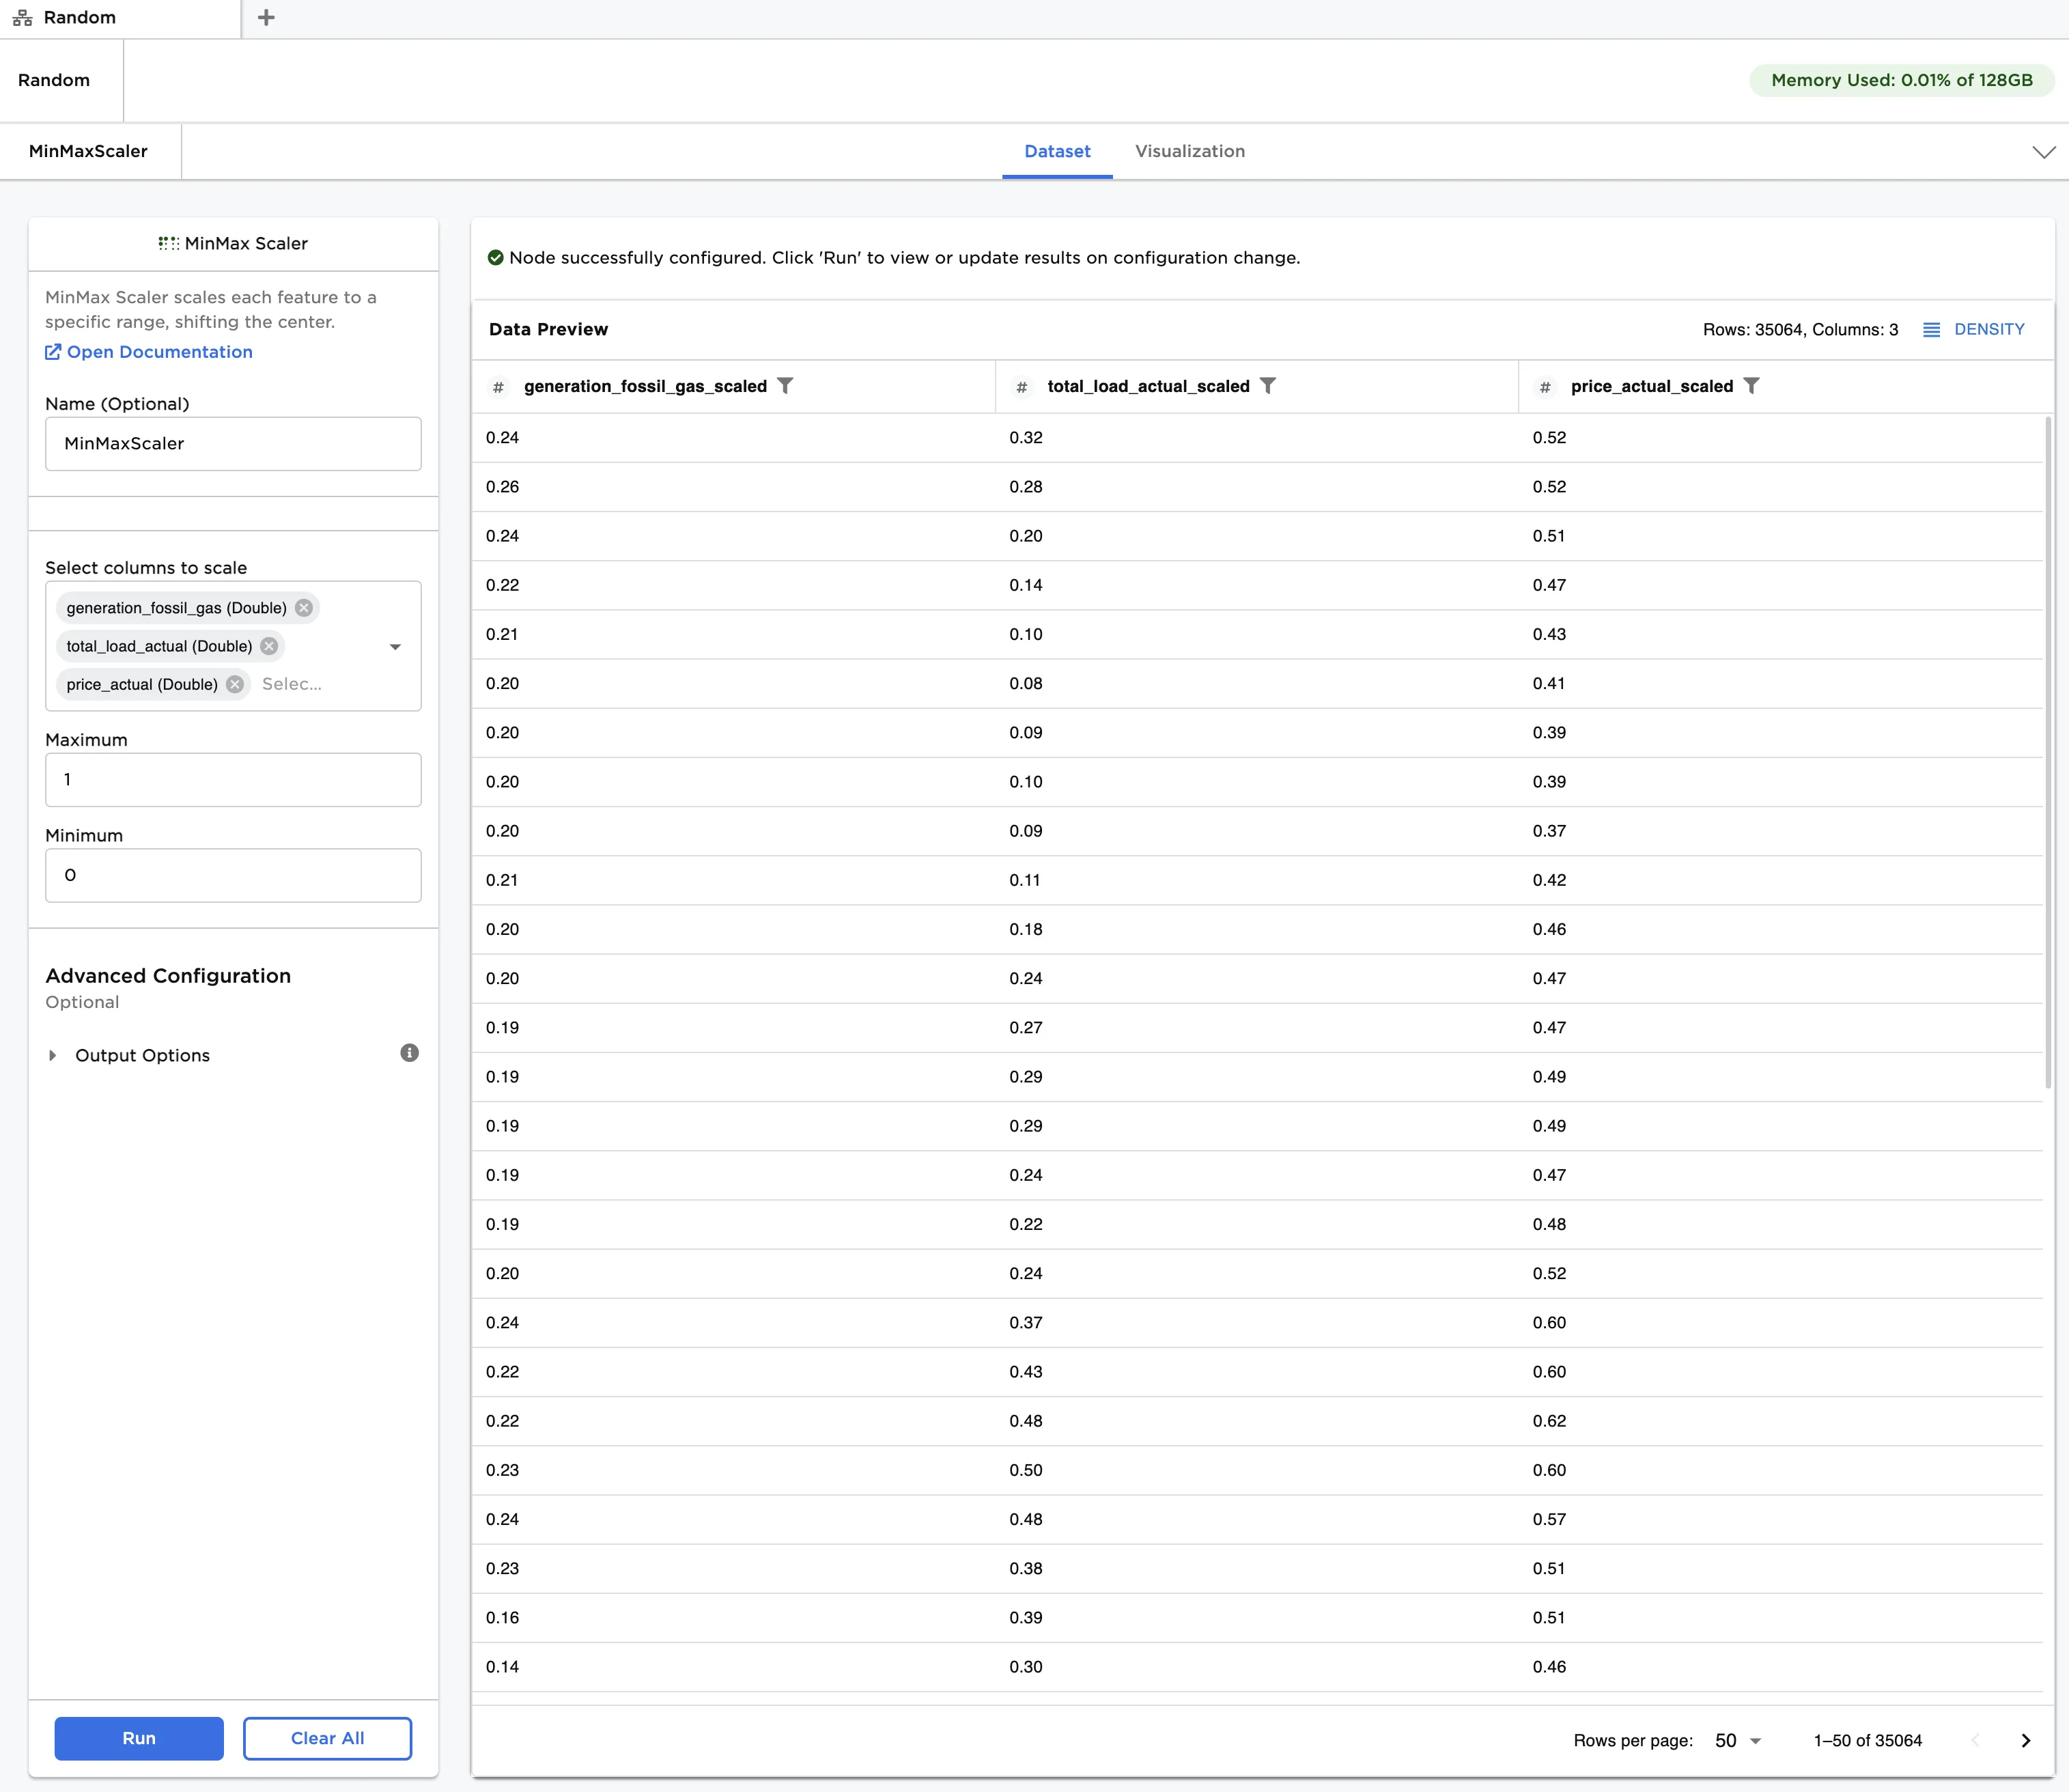
Figure 1: Example dataframe output
Examples
The data shown in Figure 2 is used in this example. It contains personal data used to determine individual risk for an auto insurance policy. The risk score is a value to predict, with values between 0 and 100. We would like to train a kNN machine learning model to make predictions, however, kNN requires features to be normalized first. The MinMax Scaler node is used to accomplish this for our feature set.
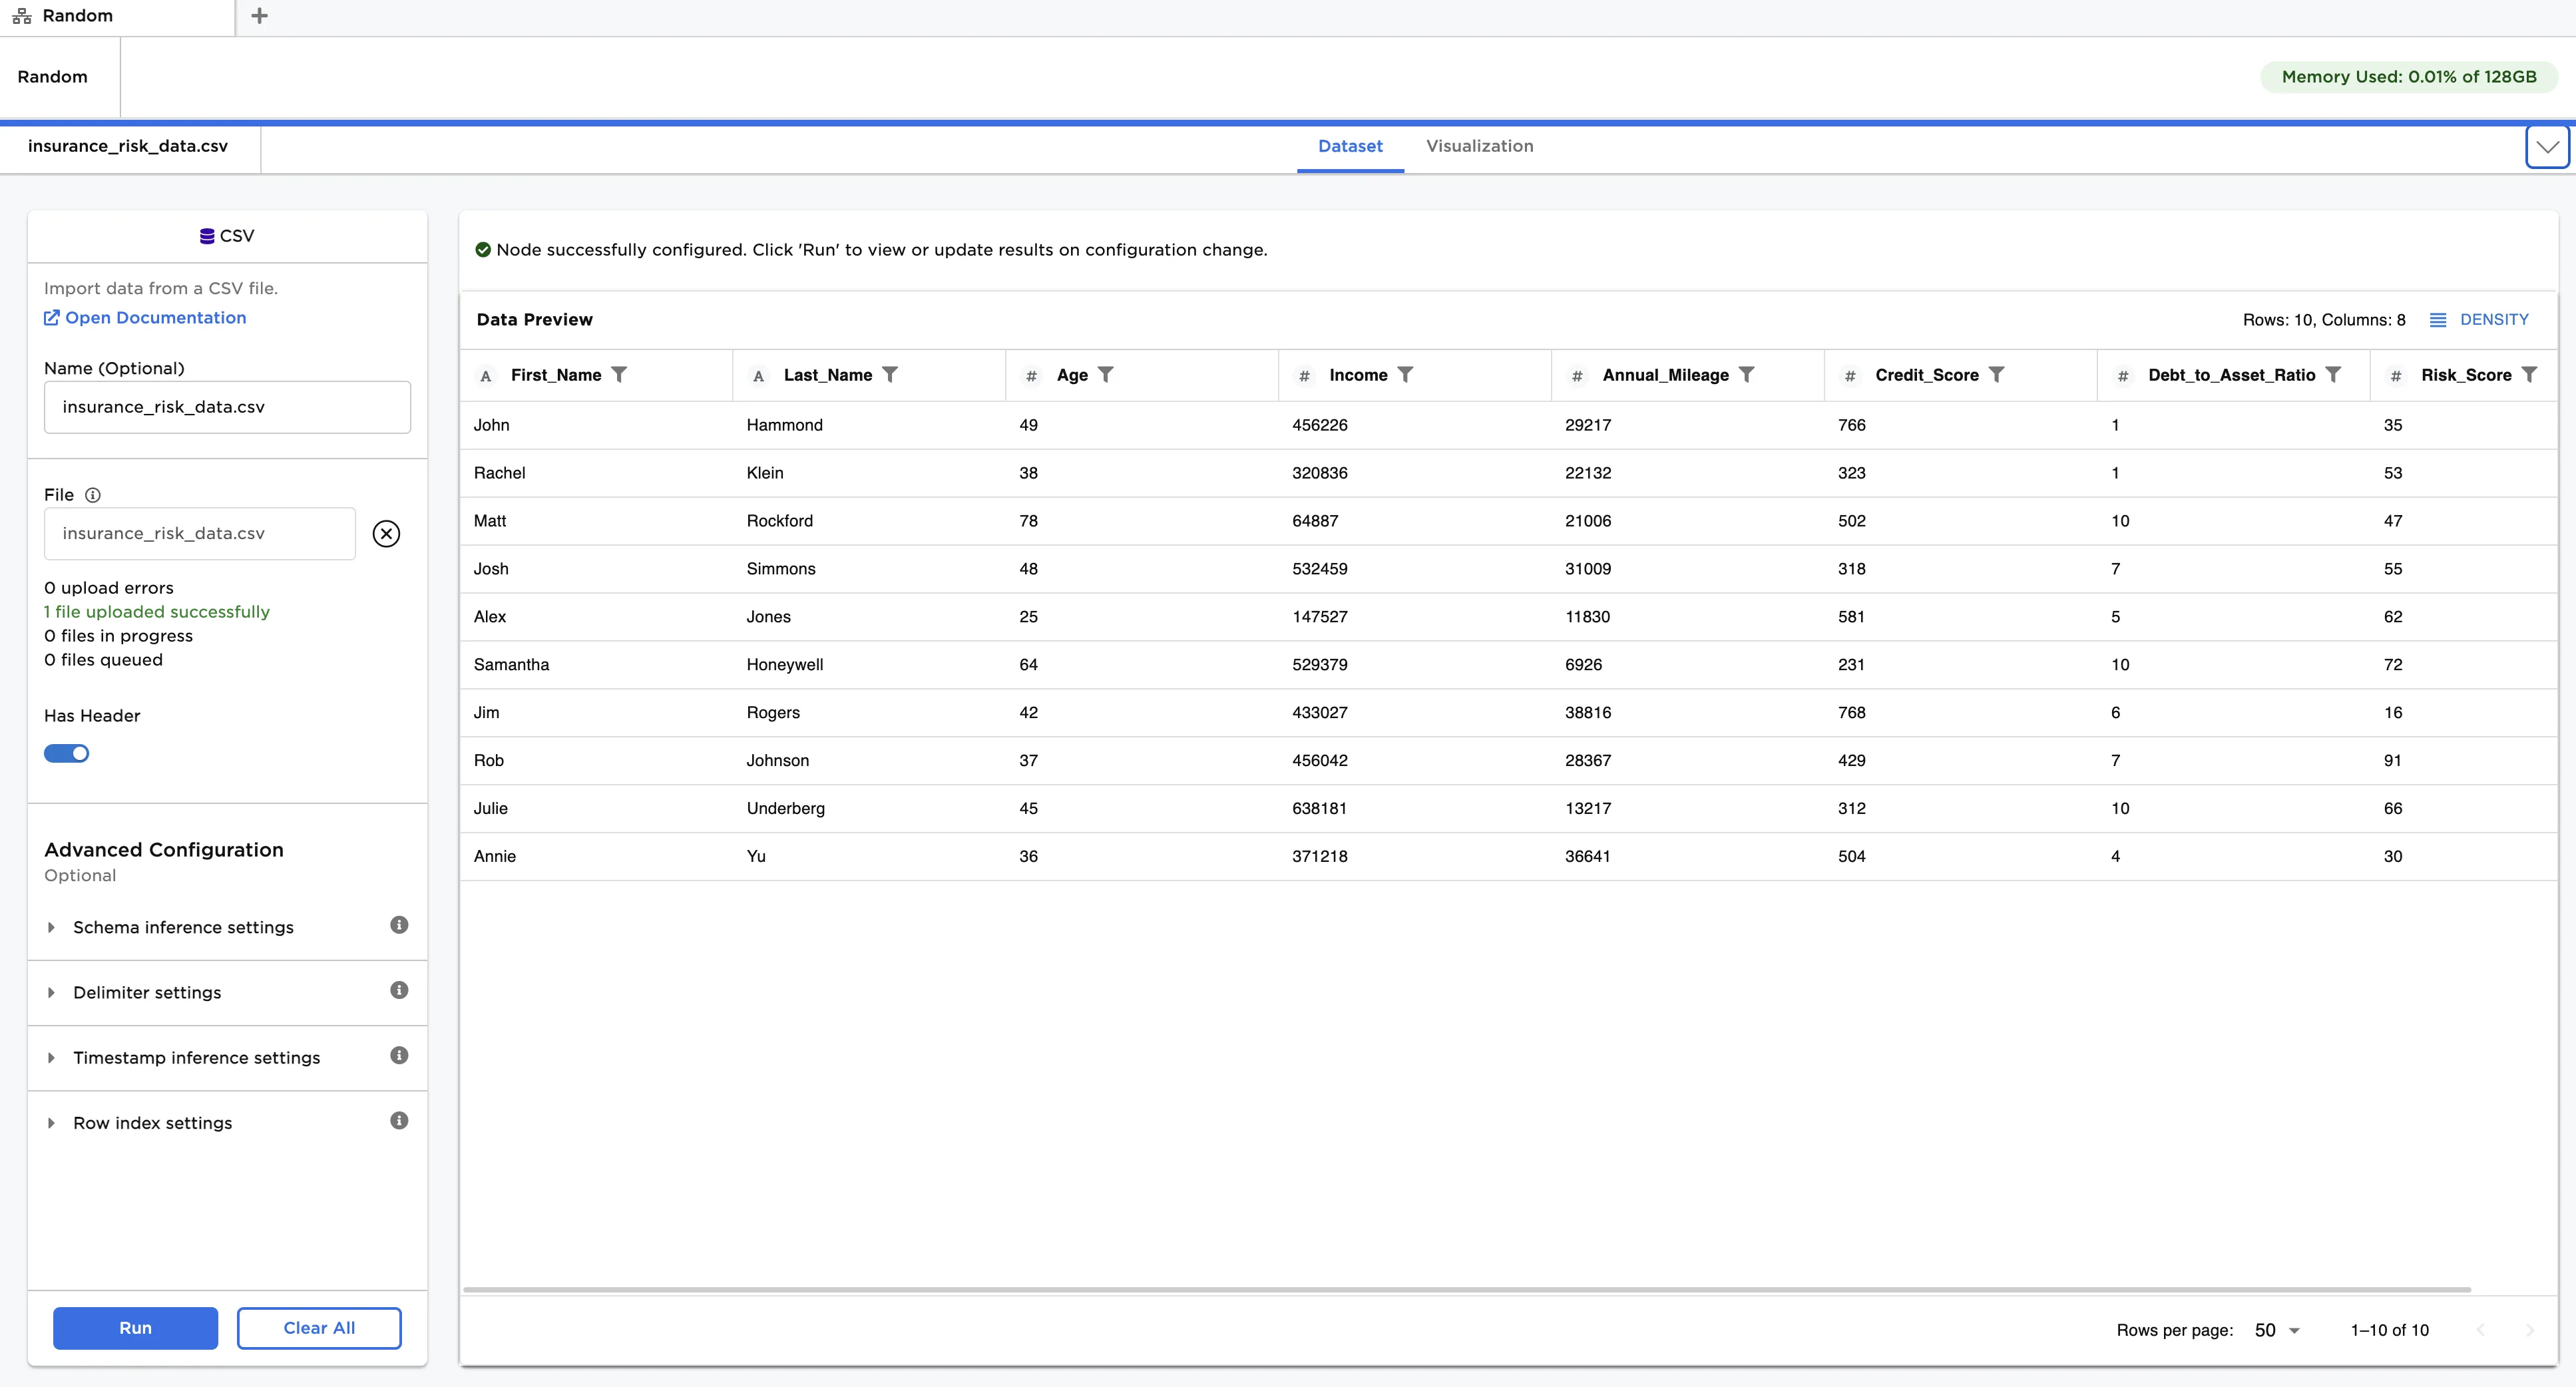
Figure 2: Example input data
Follow the steps below to normalize the input features:
- Connect a MinMax Scaler node to an existing node
- Observe the difference in measurement units (i.e., years, dollars, miles/year, unitless) and order of magnitude (e.g., age: 10^1 and income: 10^5) between columns. Since kNN uses distance estimates, features with large magnitudes are automatically assigned much greater importance in making predictions than they should be. Scaling can address this problem.
- In Select columns to scale, select all columns except Risk Score.
- Click Run to create a dataframe with the default settings (i.e., Maximum of "1" and Minimum of "0"). Observe that the original data is replaced with the scaled data. Each entry has been modified according to the following formula:
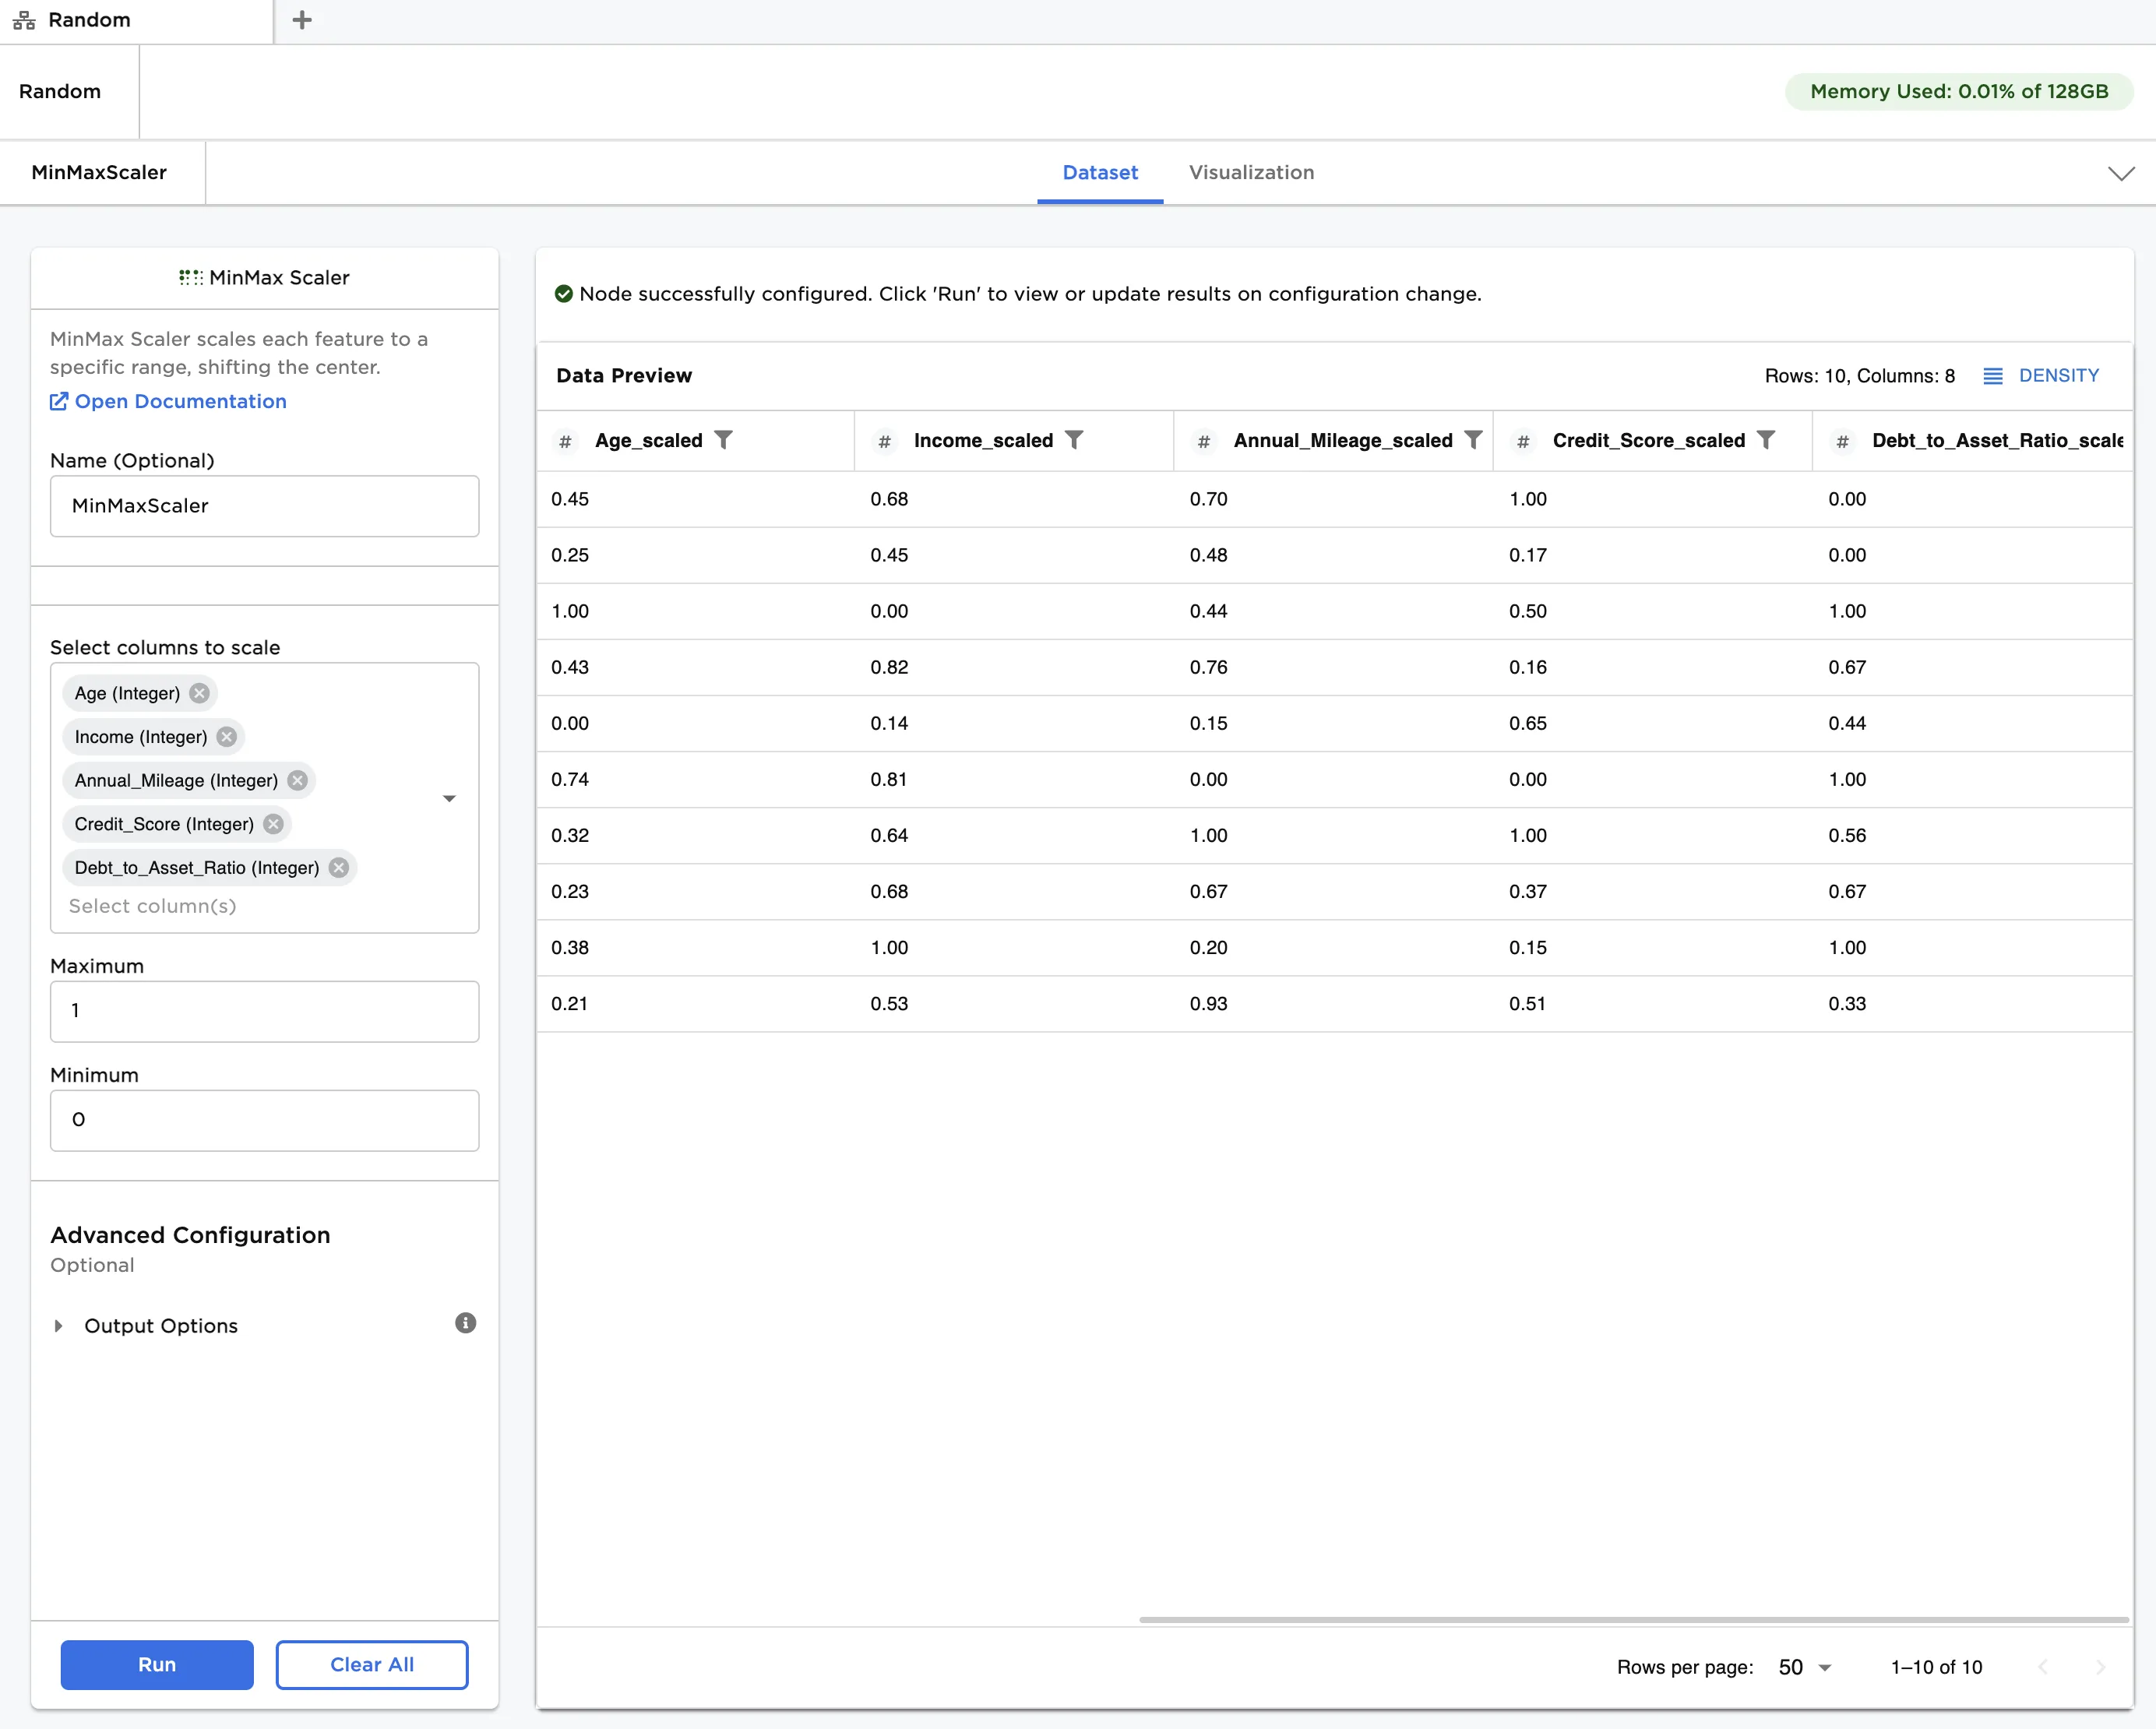
Figure 3: Example dataframe with default settings
- Change the Maximum to "80", and the Minimum to "20". Enable Keep Original Columns in Advanced Configuration.
- Click Run to create an updated dataframe. Observe that the scaled data is now between the values of 20 and 80. Each entry has been modified to the following generalized formula:
Additionally, both the original data and the scaled data, which uses the "_scaled" suffix, are displayed in the output.
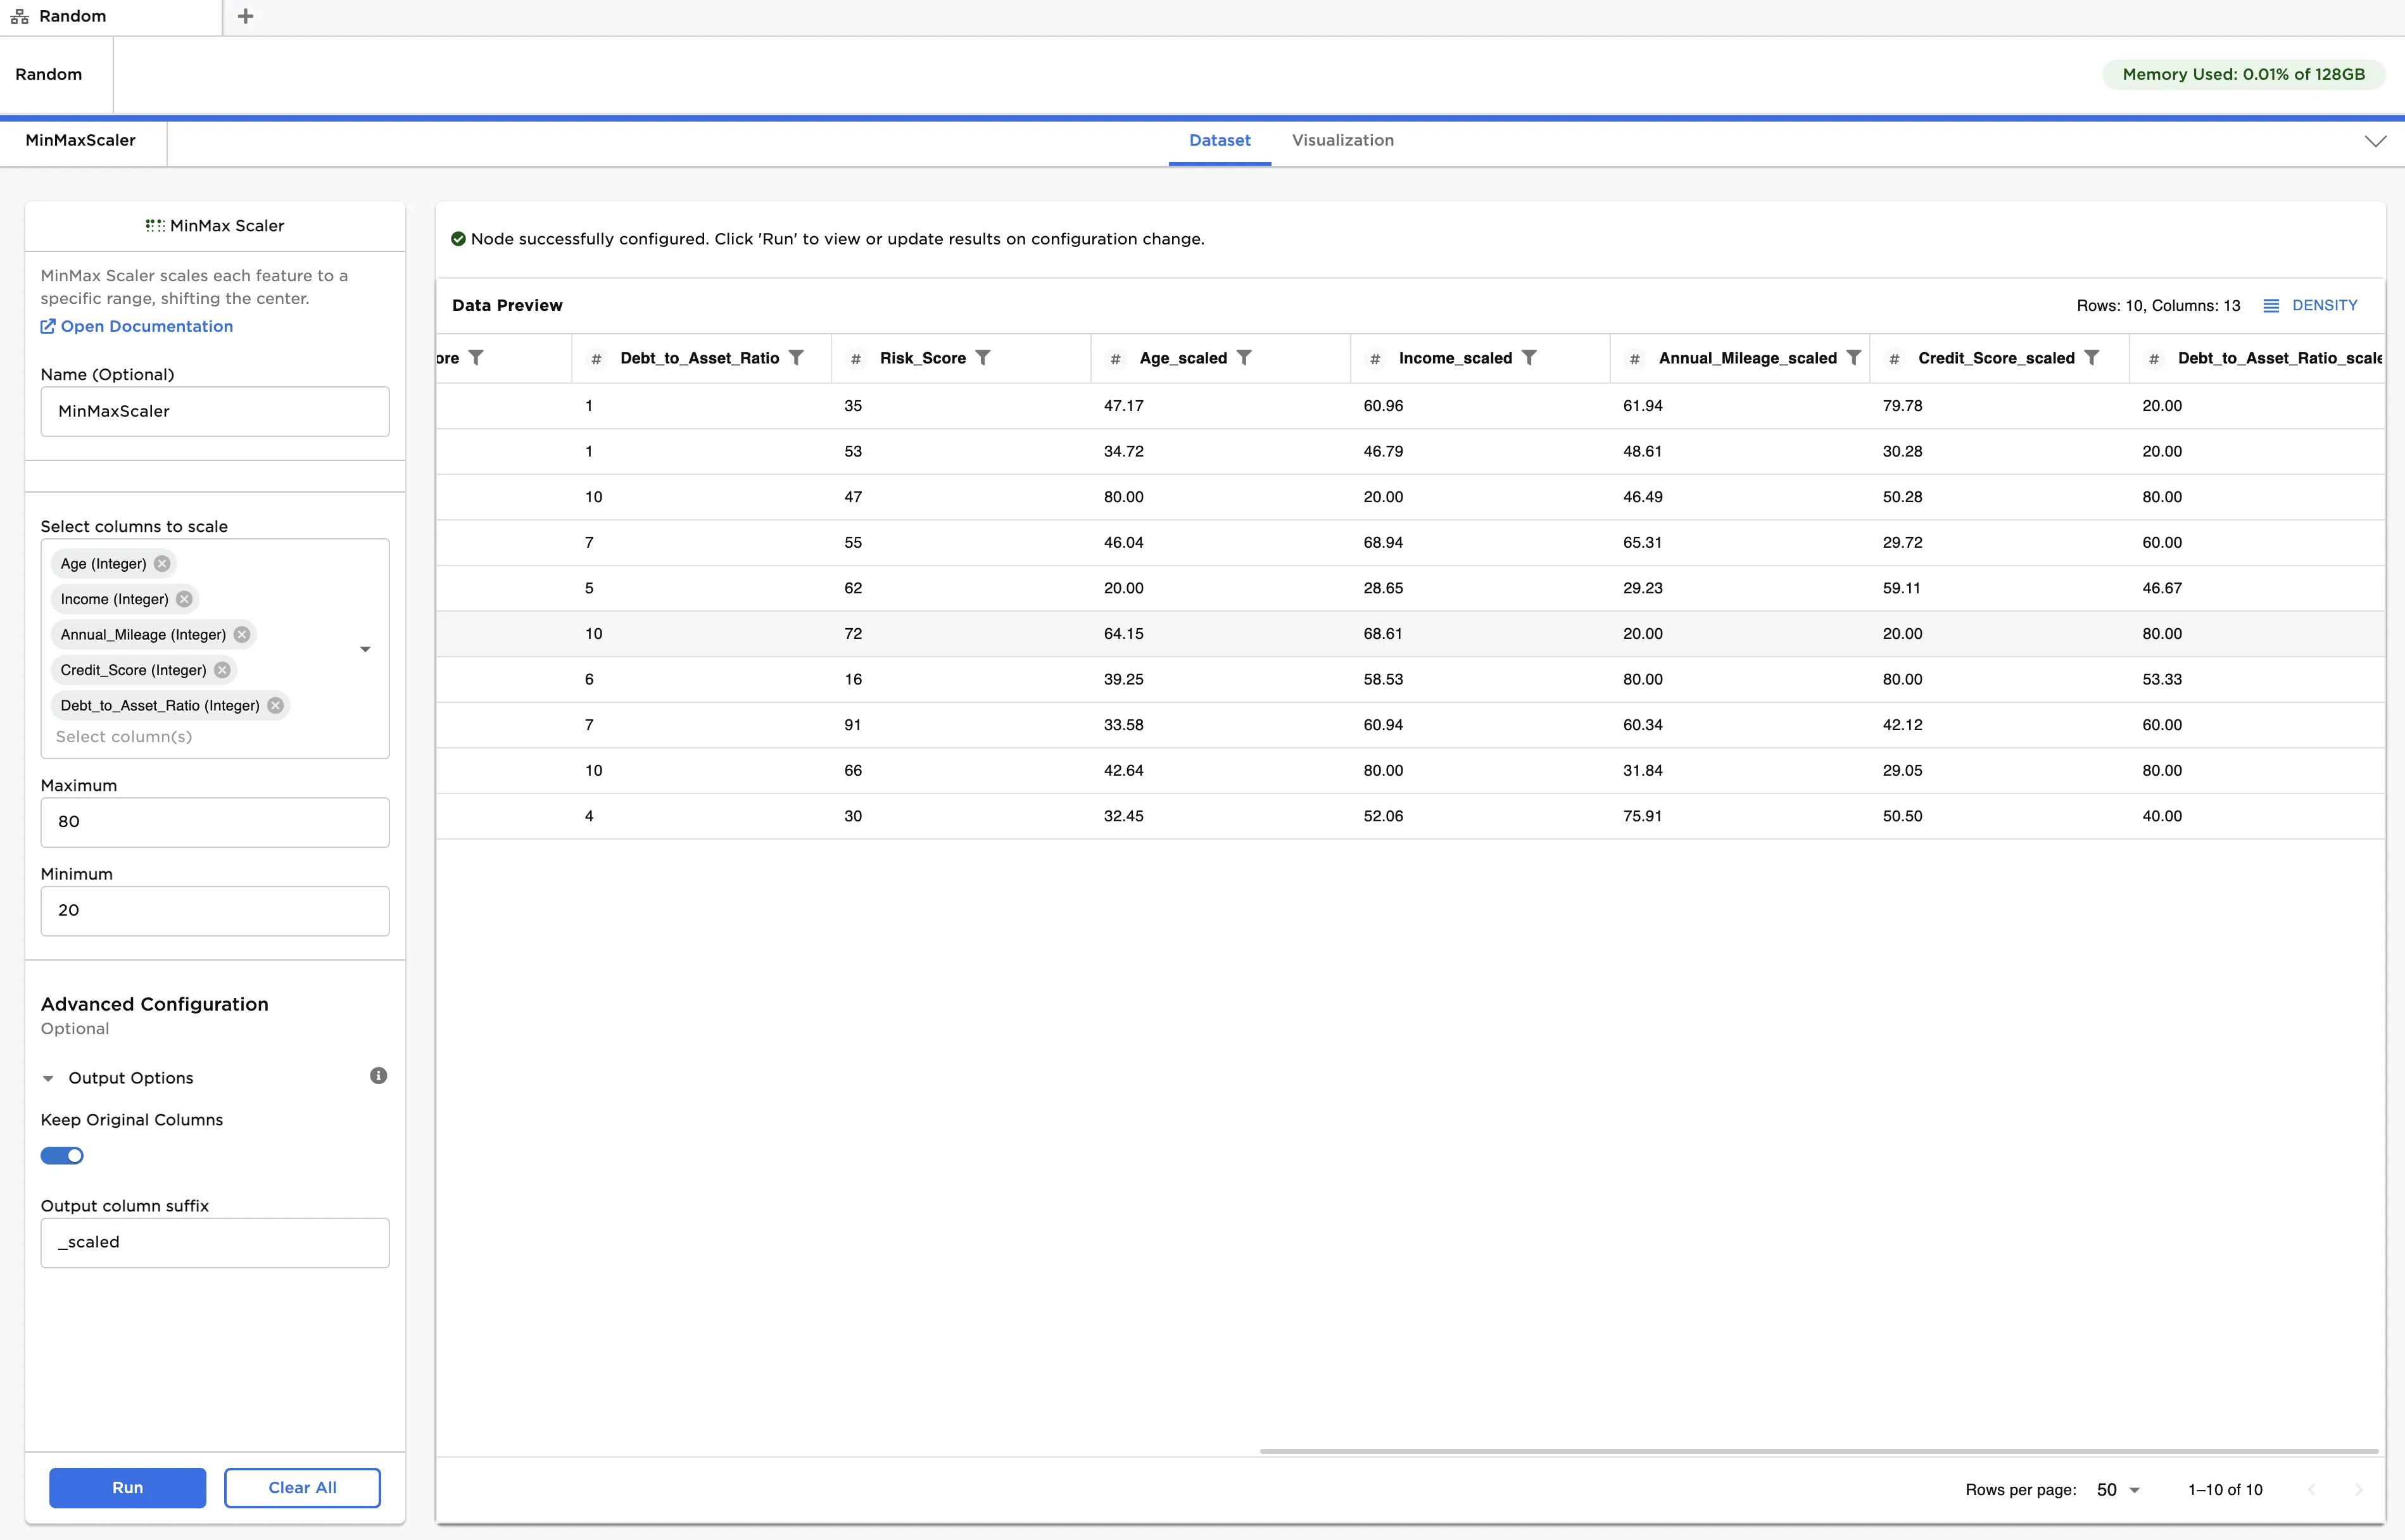
Figure 4: Example dataframe with custom scale