Pandas on Spark
Use the Pandas API on Spark in Visual Notebooks to scale your data transformations with Pandas. This node allows you to efficiently process large datasets using Apache Spark's cluster-computing platform, with no learning curve, if you are already familiar with Pandas. Additionally, you can switch between Pandas API and PySpark API contexts easily without any overhead.
To learn more about Pandas and Spark, reference the following documentation links:
Configuration
| Field | Description |
|---|---|
| Name default=none | Field to name the node A user-specified node name, displayed in the canvas and in the dataframe as a tab. |
Output Name default=output | Name of the output dataframe Enter a name for the output PySpark dataframe. This must match the name of the output variable in the notebook. |
Node Inputs/Outputs
| Input | A Visual Notebooks dataframe |
|---|---|
| Output | A dataframe transformed by one or more Pandas or PySpark functions |
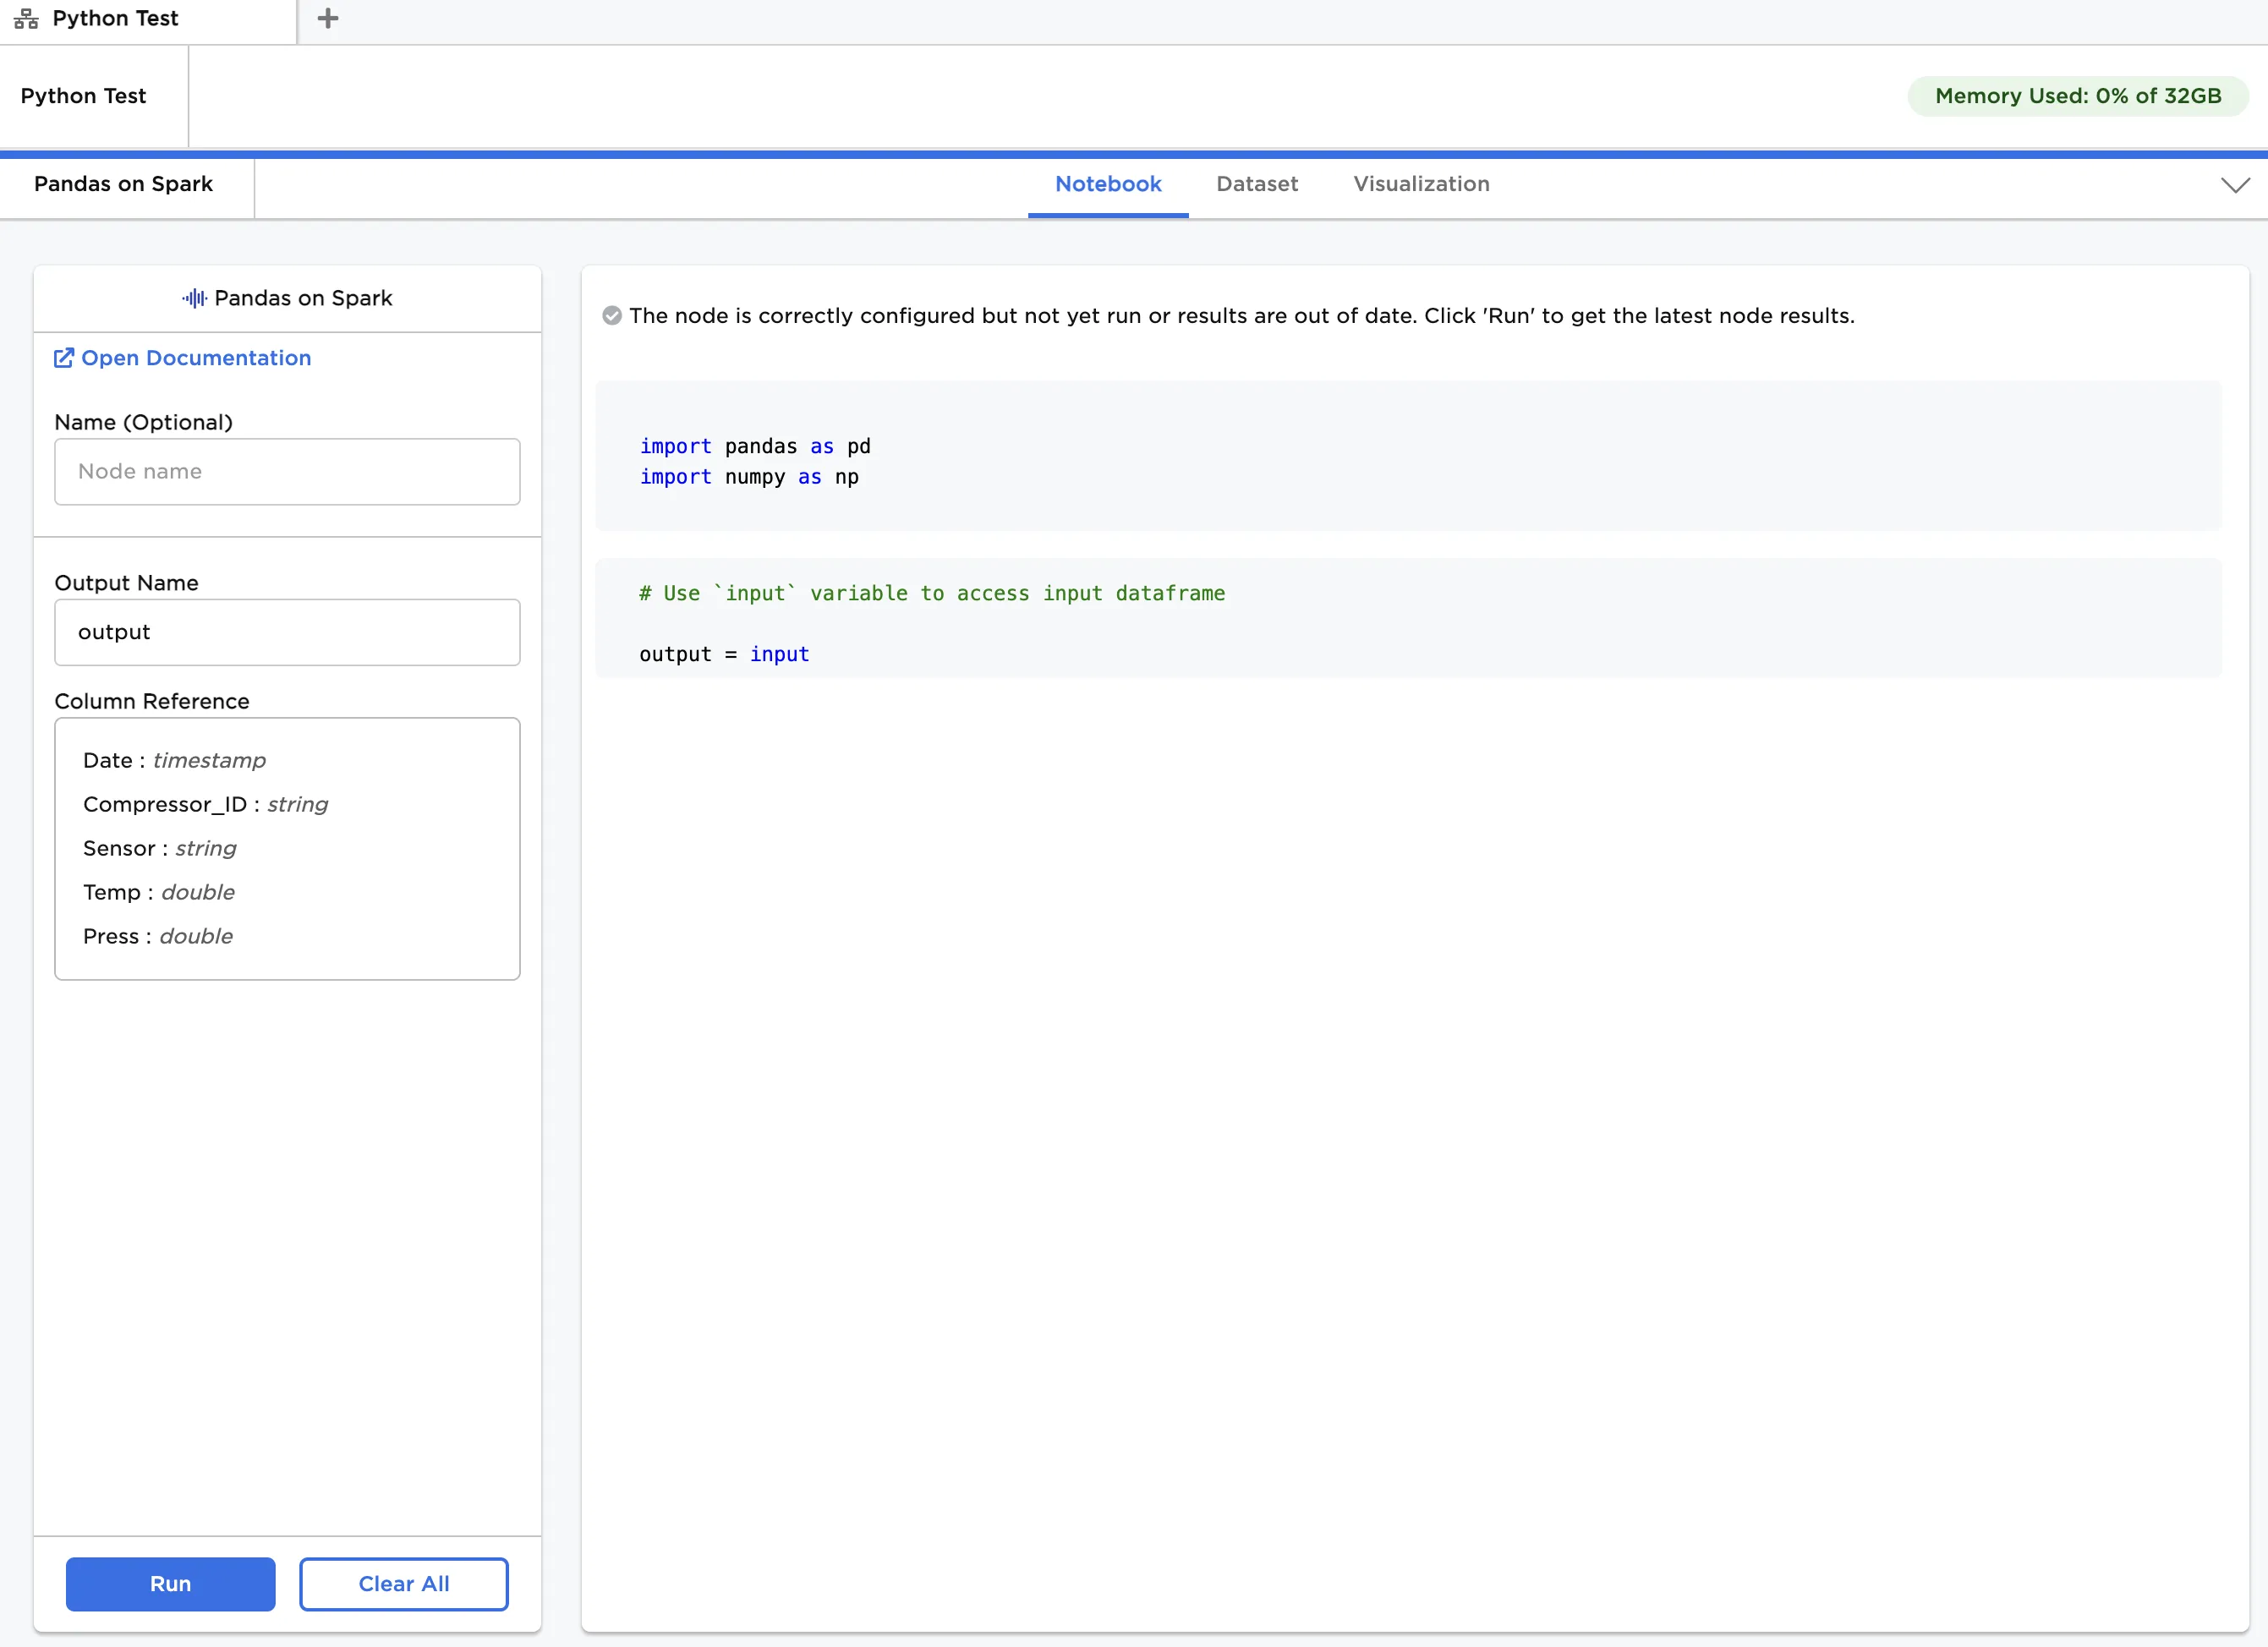
Figure 1: Example notebook
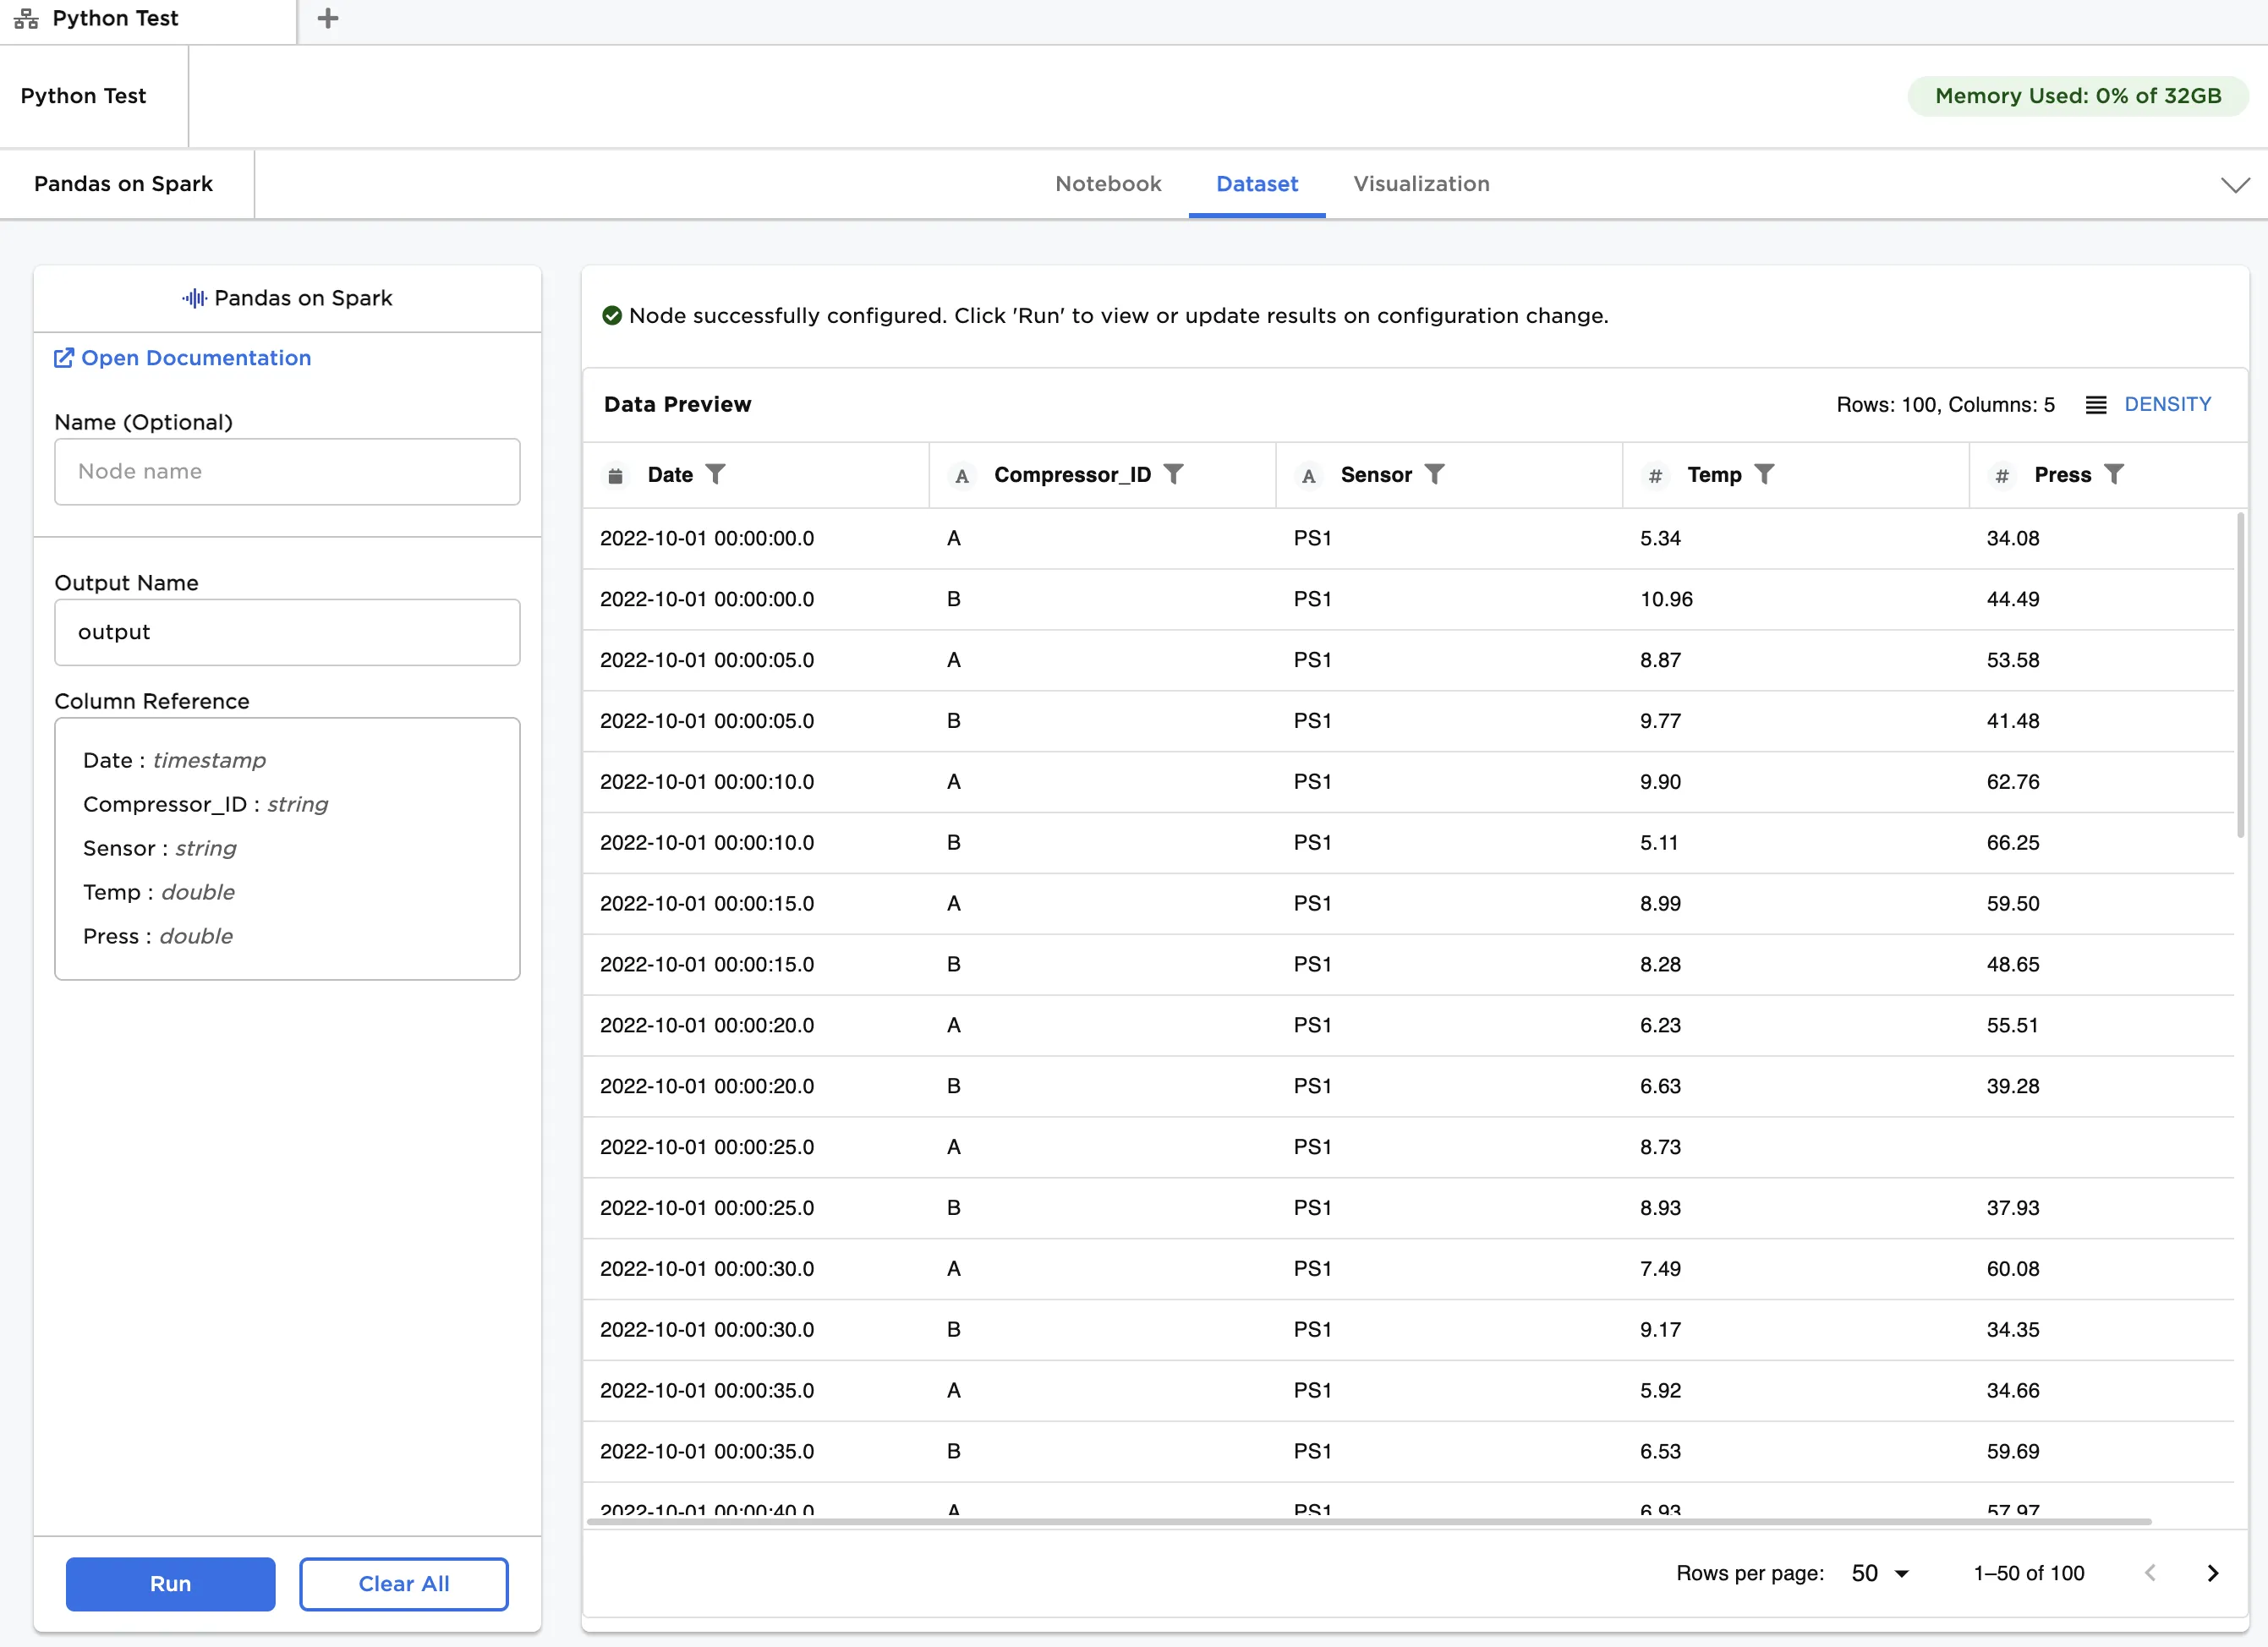
Figure 2: Example dataframe output
Examples
The data shown in Figure 3 is used in this example. It contains temperature and pressure data for two identical air compressors operating in parallel. Each compressor has two sensors at different locations, and each sensor measures both temperature and pressure. Data is recorded every five seconds over a two-minute period. For each timestamp, we would like to check if average readings for sensors at the same location across compressors are above a certain threshold.
Although this is a small dataset, our primary goal is to show how analysis can be performed using both the Pandas-on-Spark API and PySpark API.
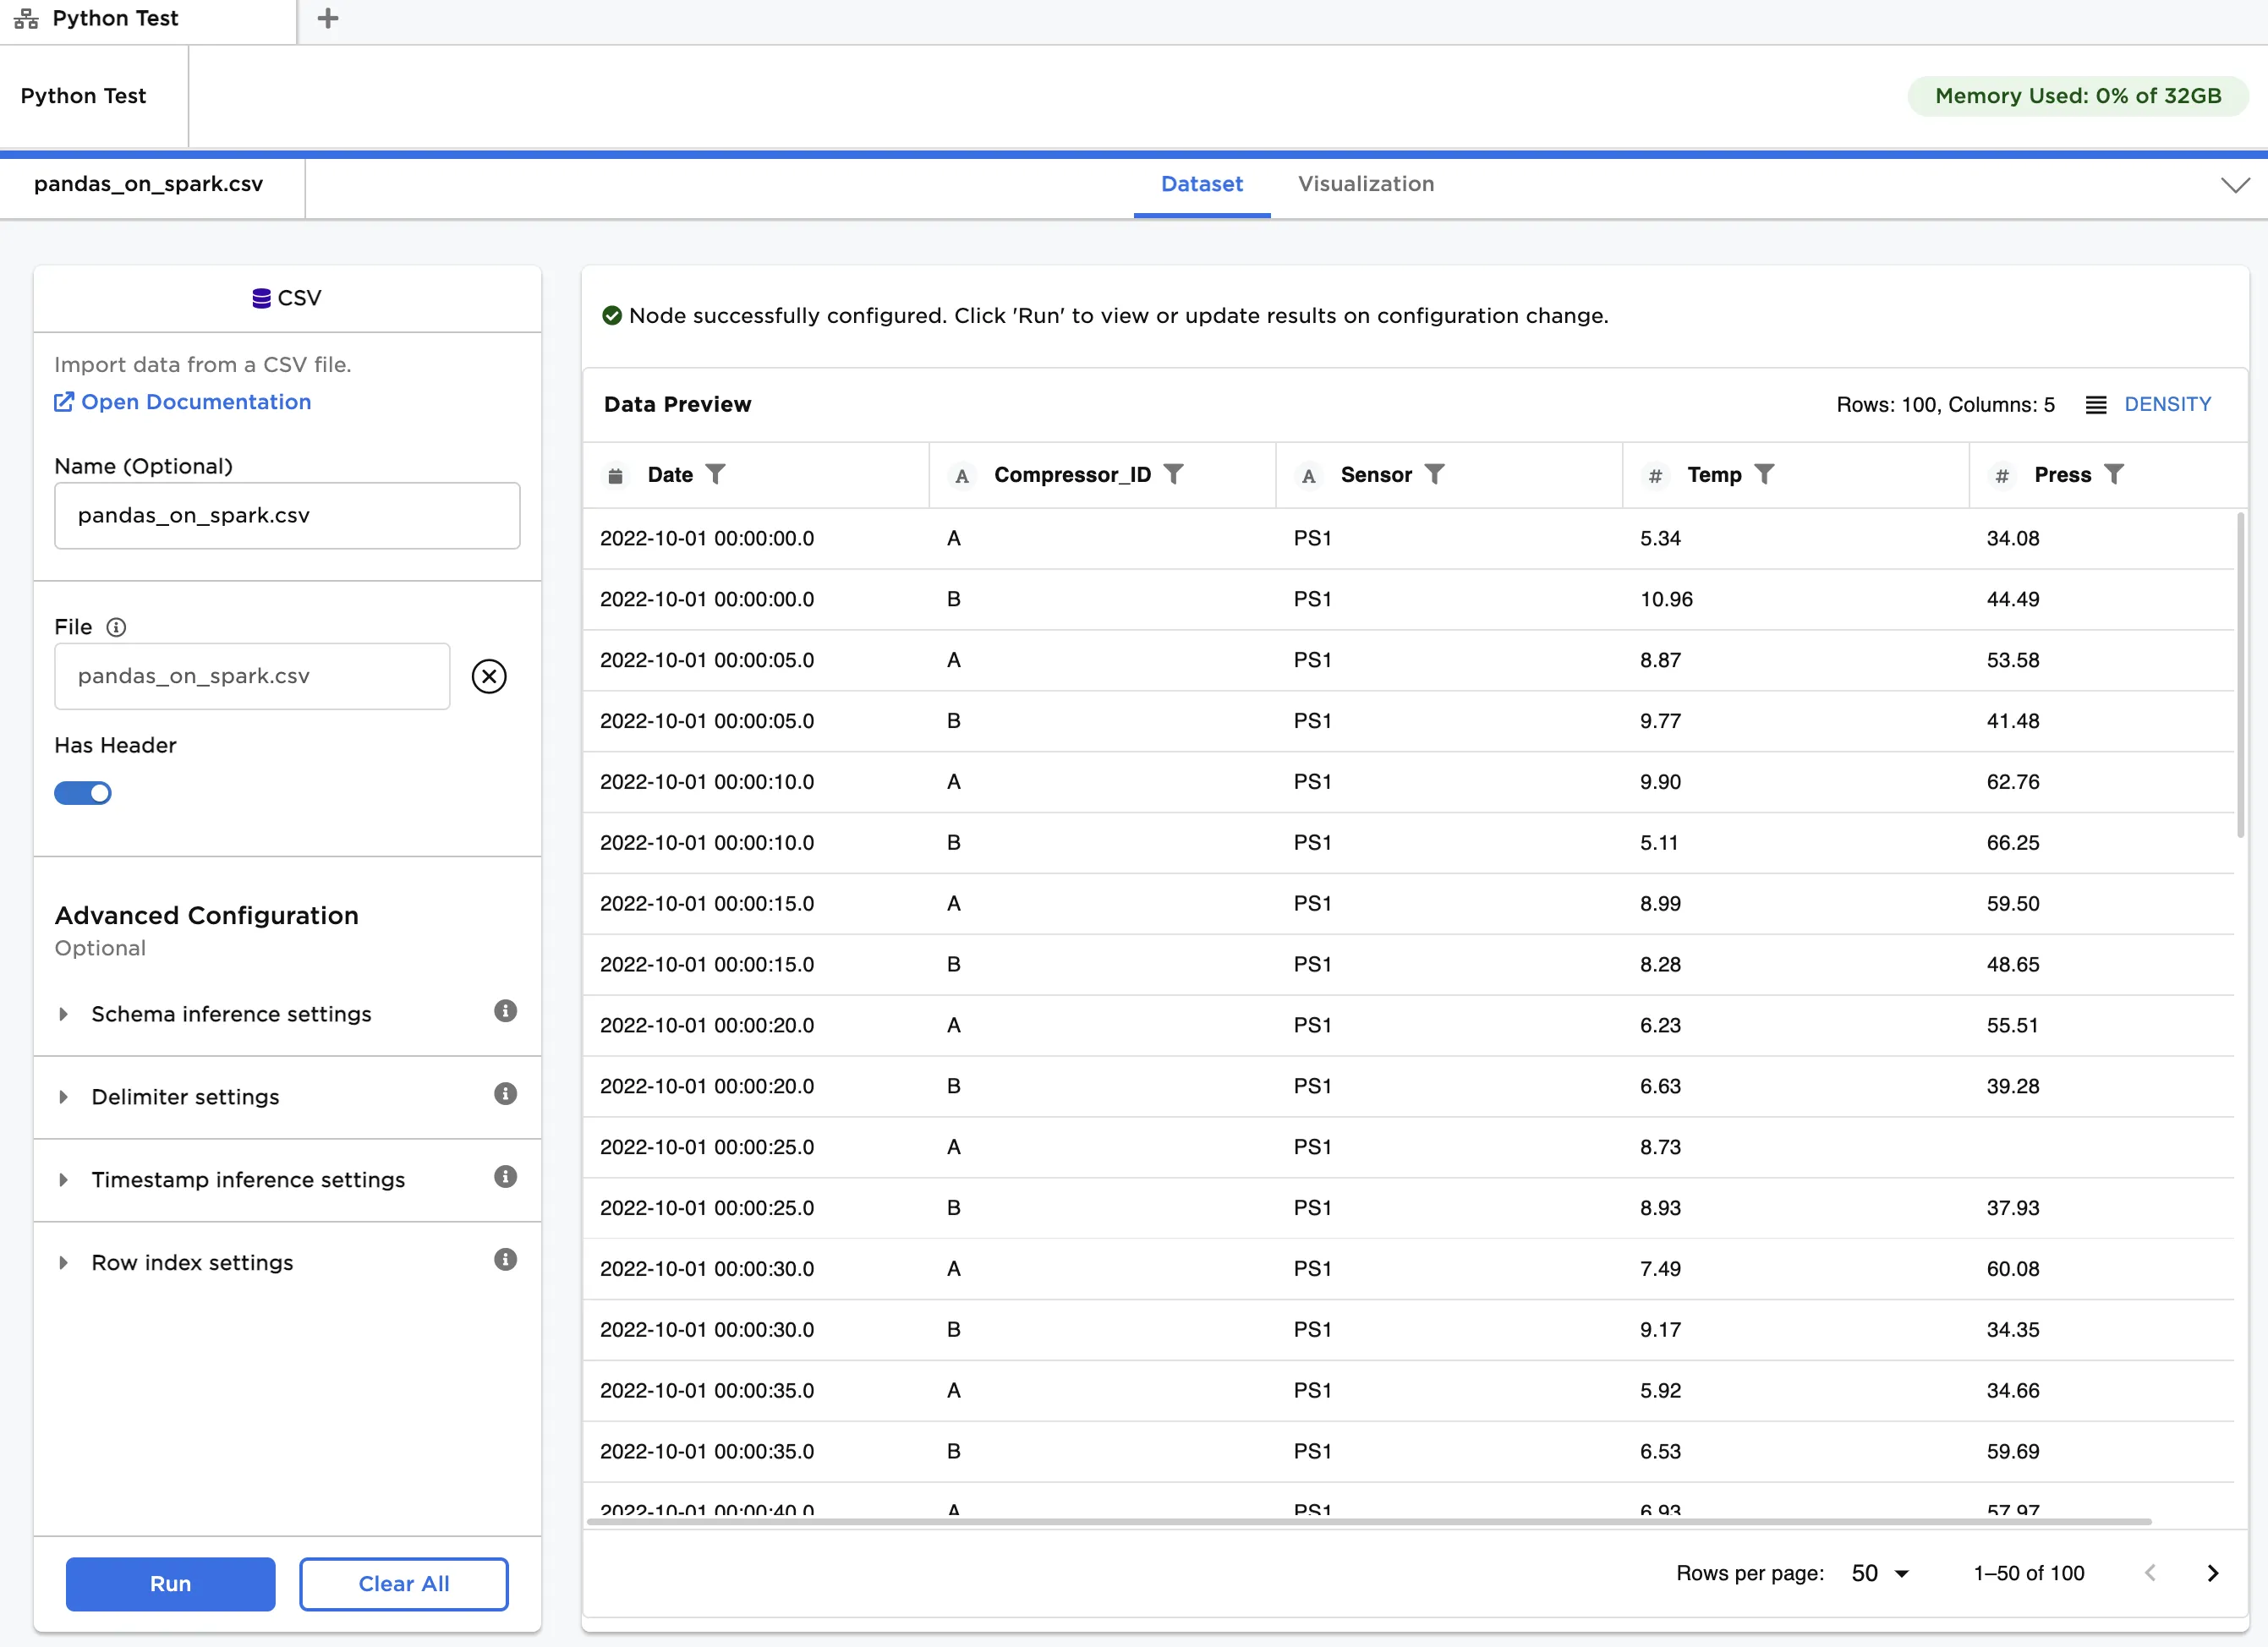
Figure 3: Example input data
Follow the steps below to perform the analysis using the Pandas-on-Spark API:
- Connect a Pandas on Spark node to an existing node. In this case, it is connected to a CSV node with the example data provided. Ensure
outputis entered in Output Name. - Copy the code below and paste it into the Notebook tab, as shown in Figure 4.
output = input.to_pandas_on_spark() output = output[output['Temp'].notna() & output['Press'].notna()].groupby(['Date','Sensor']).mean().reset_index() high_PS1 = output[(output['Sensor'] == 'PS1') & ((output['Temp'] > 10) | (output['Press'] > 60))] high_PS2 = output[(output['Sensor'] == 'PS2') & ((output['Temp'] > 60) | (output['Press'] > 500))] output = high_PS1.append(high_PS2).sort_values(by = ['Sensor','Date']) output = output.to_spark()
- Click Run.
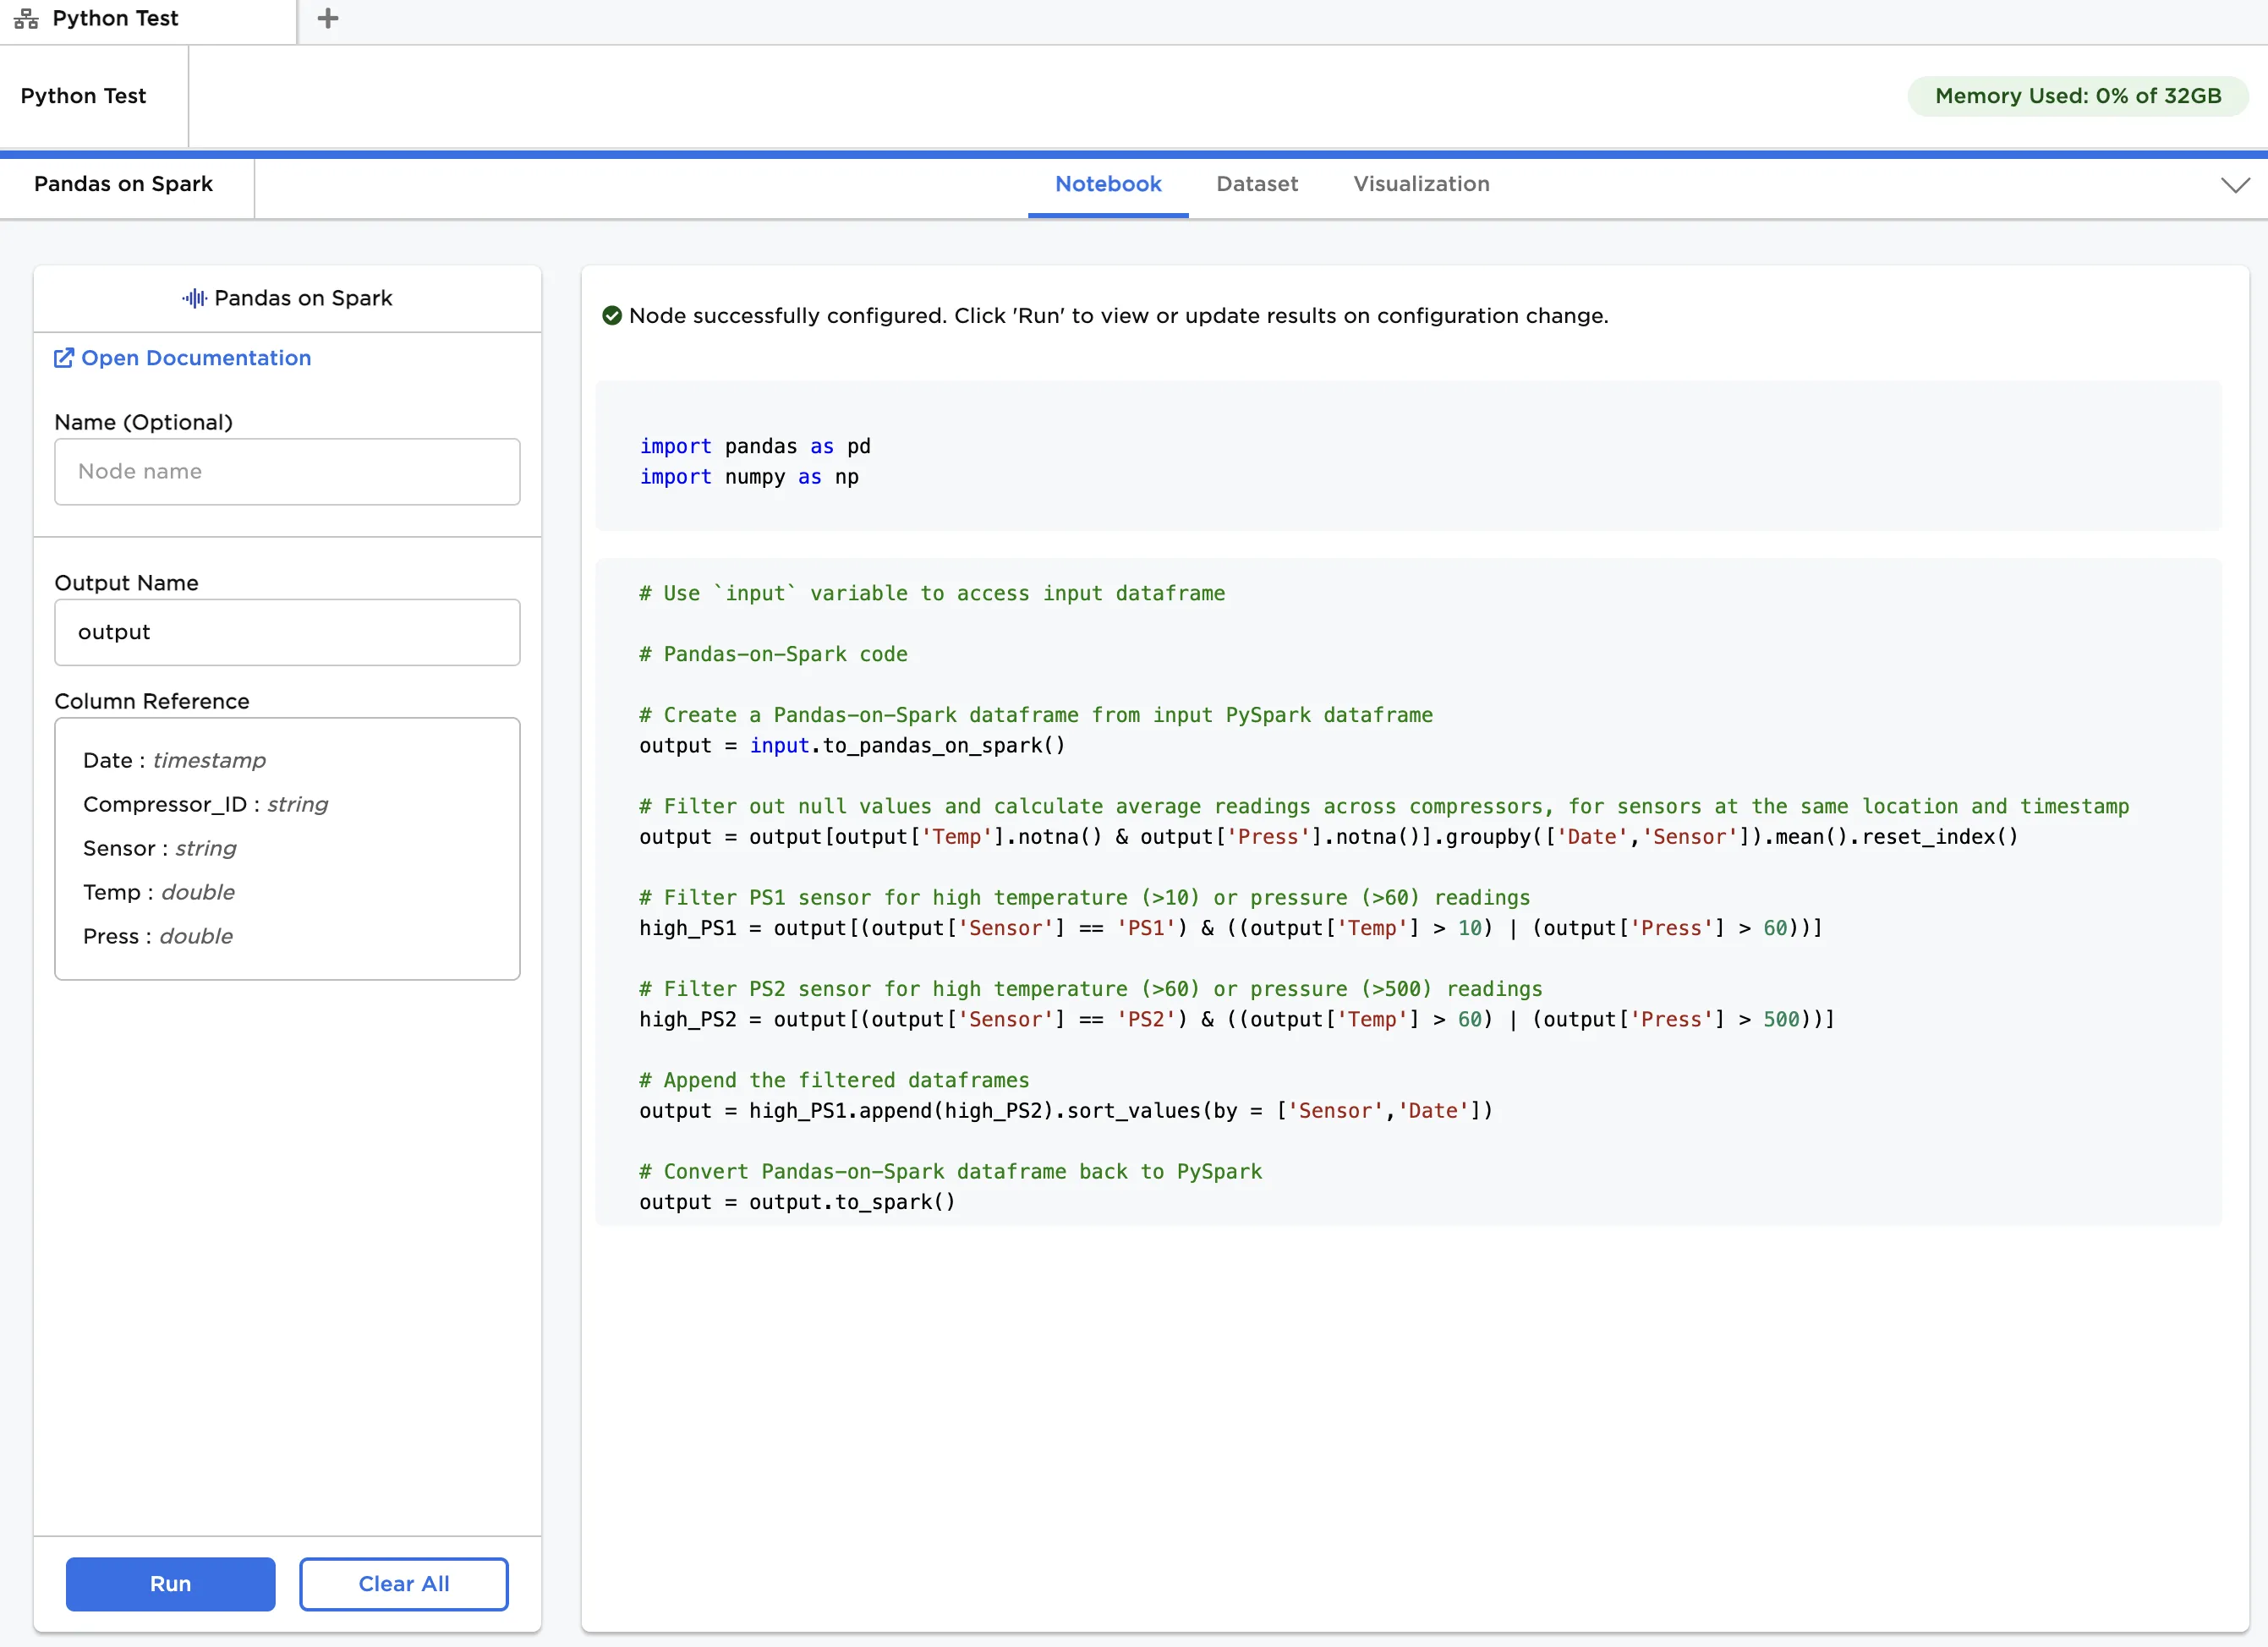
Figure 4: Example notebook using Pandas-on-Spark API
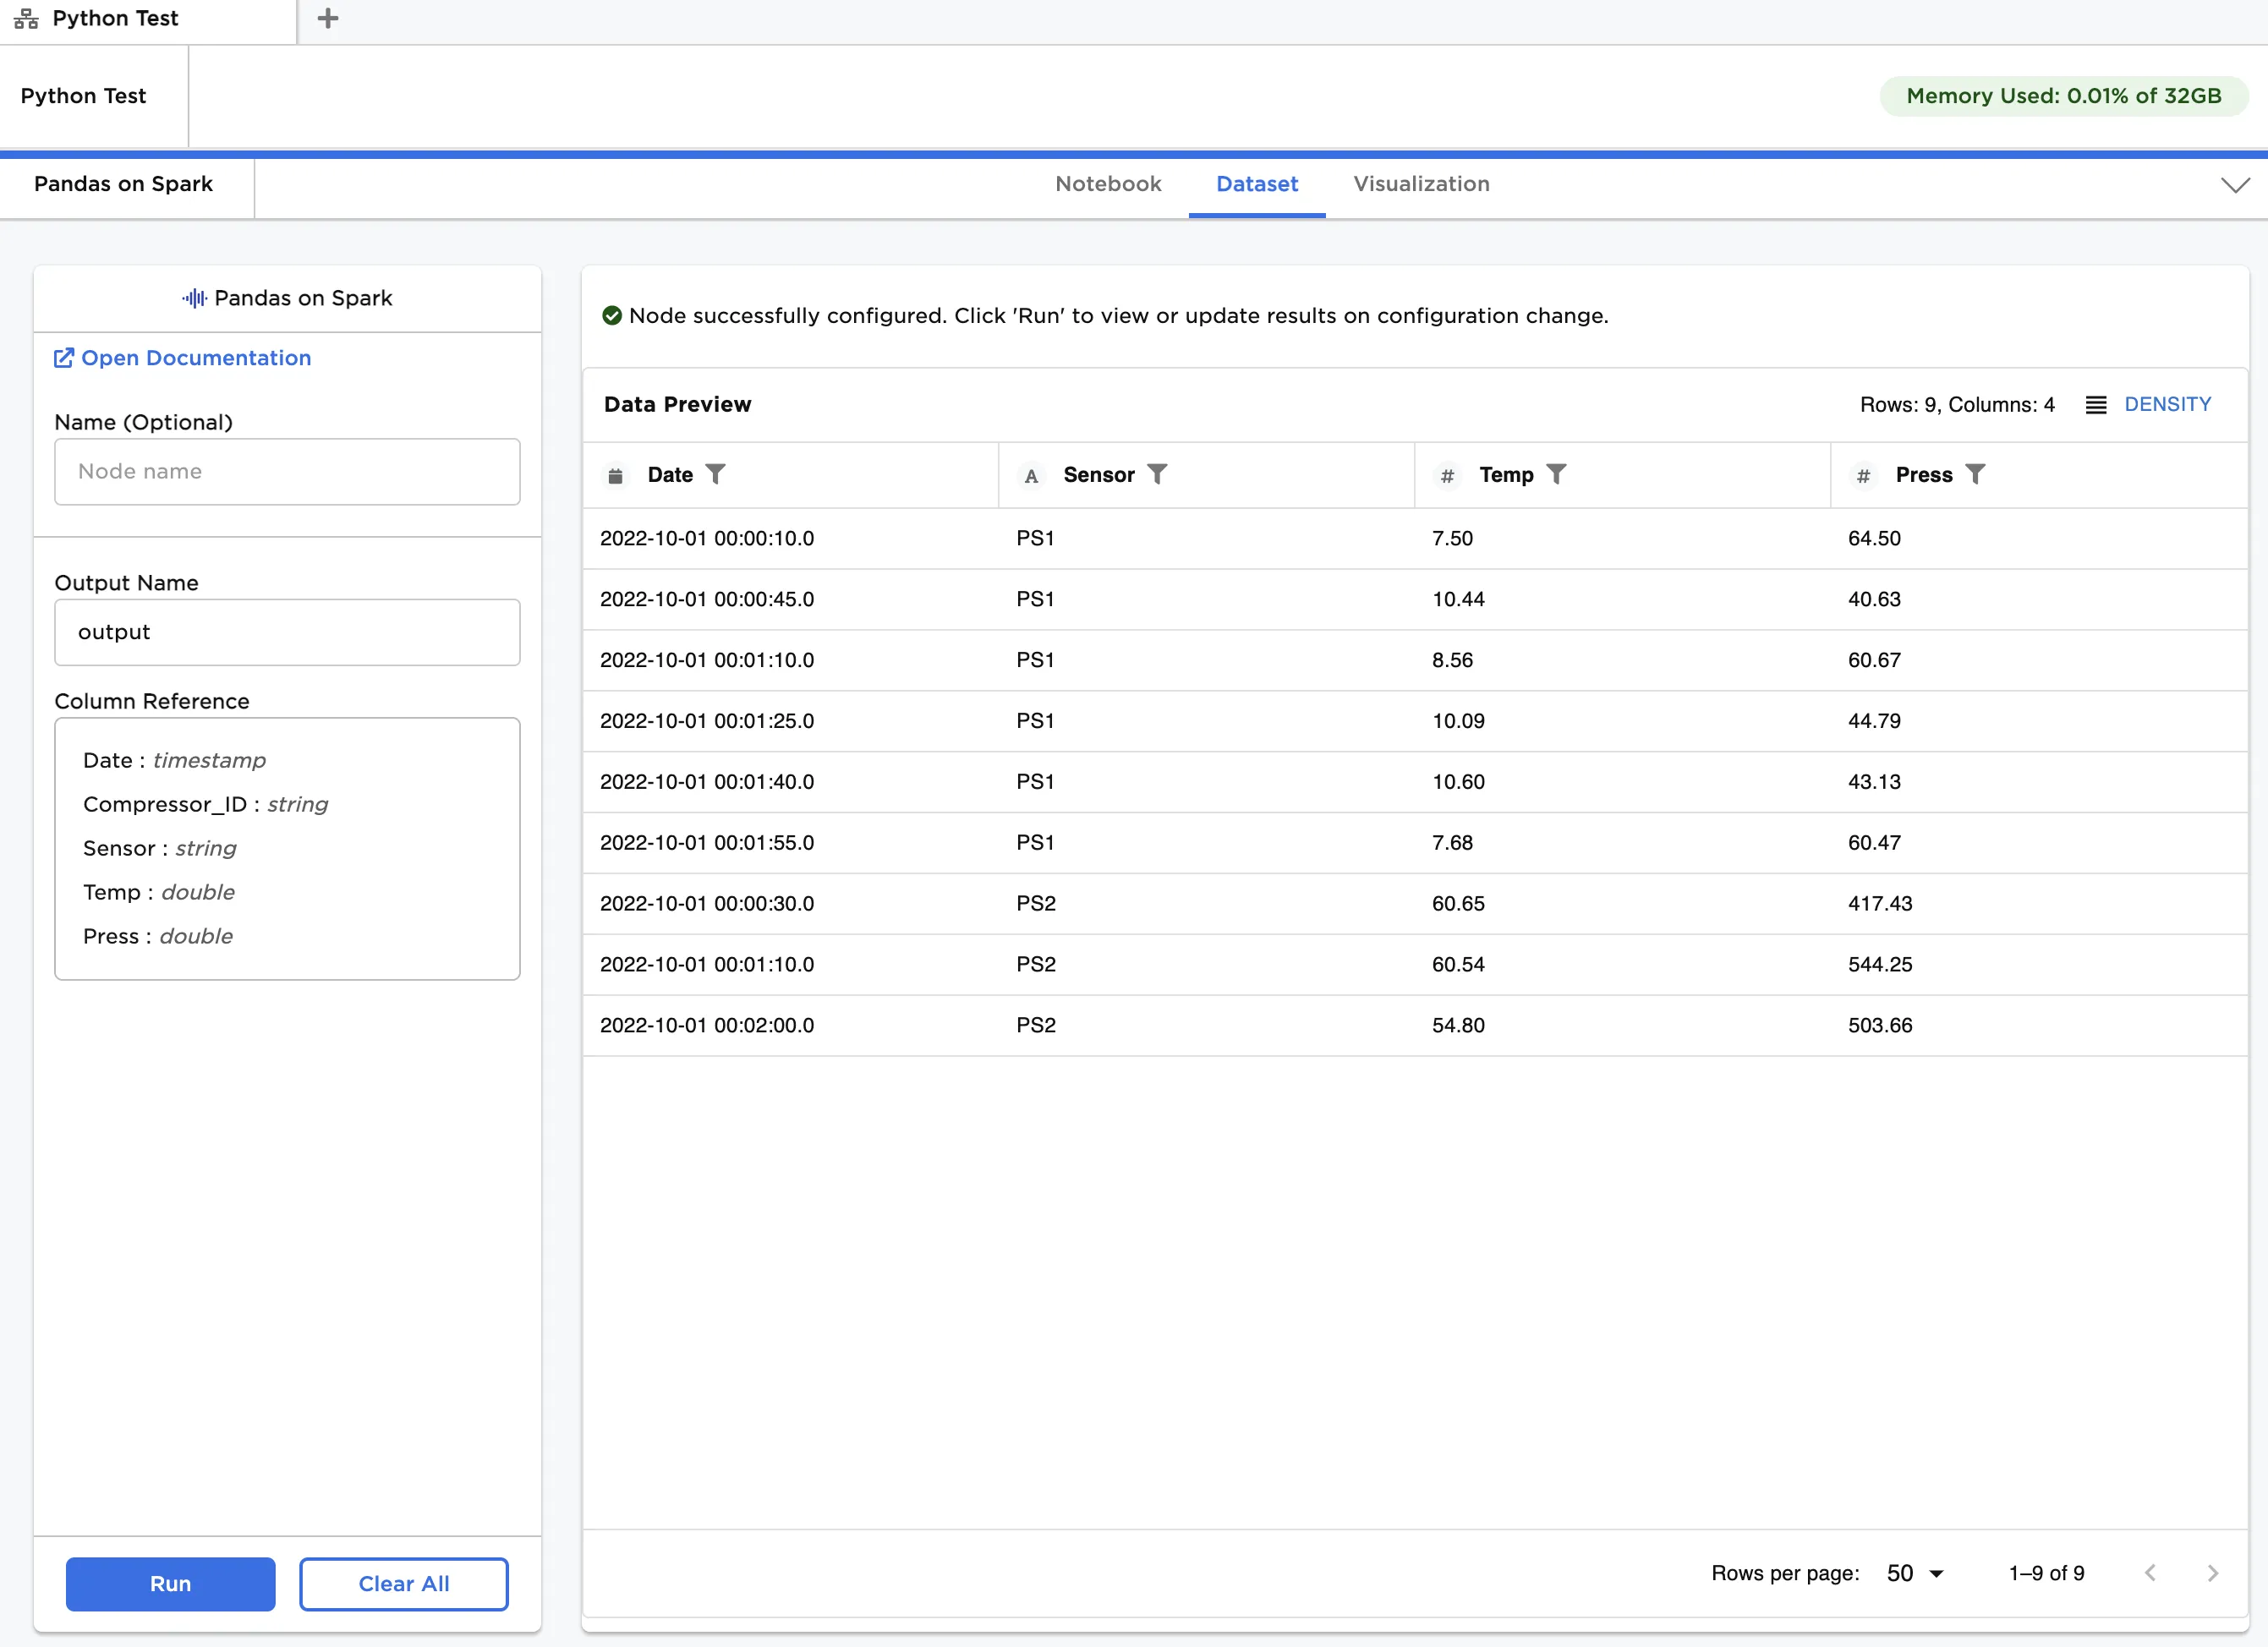
Figure 5: Dataframe output using Pandas-on-Spark API or PySpark API
To perform the same analysis using the PySpark API, repeat the steps in the previous example except with the following code:
output = input output = output.filter(output.Temp.isNotNull() & output.Press.isNotNull()).groupBy('Date', 'Sensor').mean('Temp', 'Press').withColumnRenamed('avg(Temp)', 'Temp').withColumnRenamed('avg(Press)', 'Press') high_PS1 = output.filter((output.Sensor == 'PS1') & ((output.Temp > 10) | (output.Press > 60))) high_PS2 = output.filter((output.Sensor == 'PS2') & ((output.Temp > 60) | (output.Press > 500))) output = high_PS1.union(high_PS2).sort('Sensor','Date')
The annotated notebook is shown in Figure 6. Note that the output dataframe is identical to the one in Figure 5.
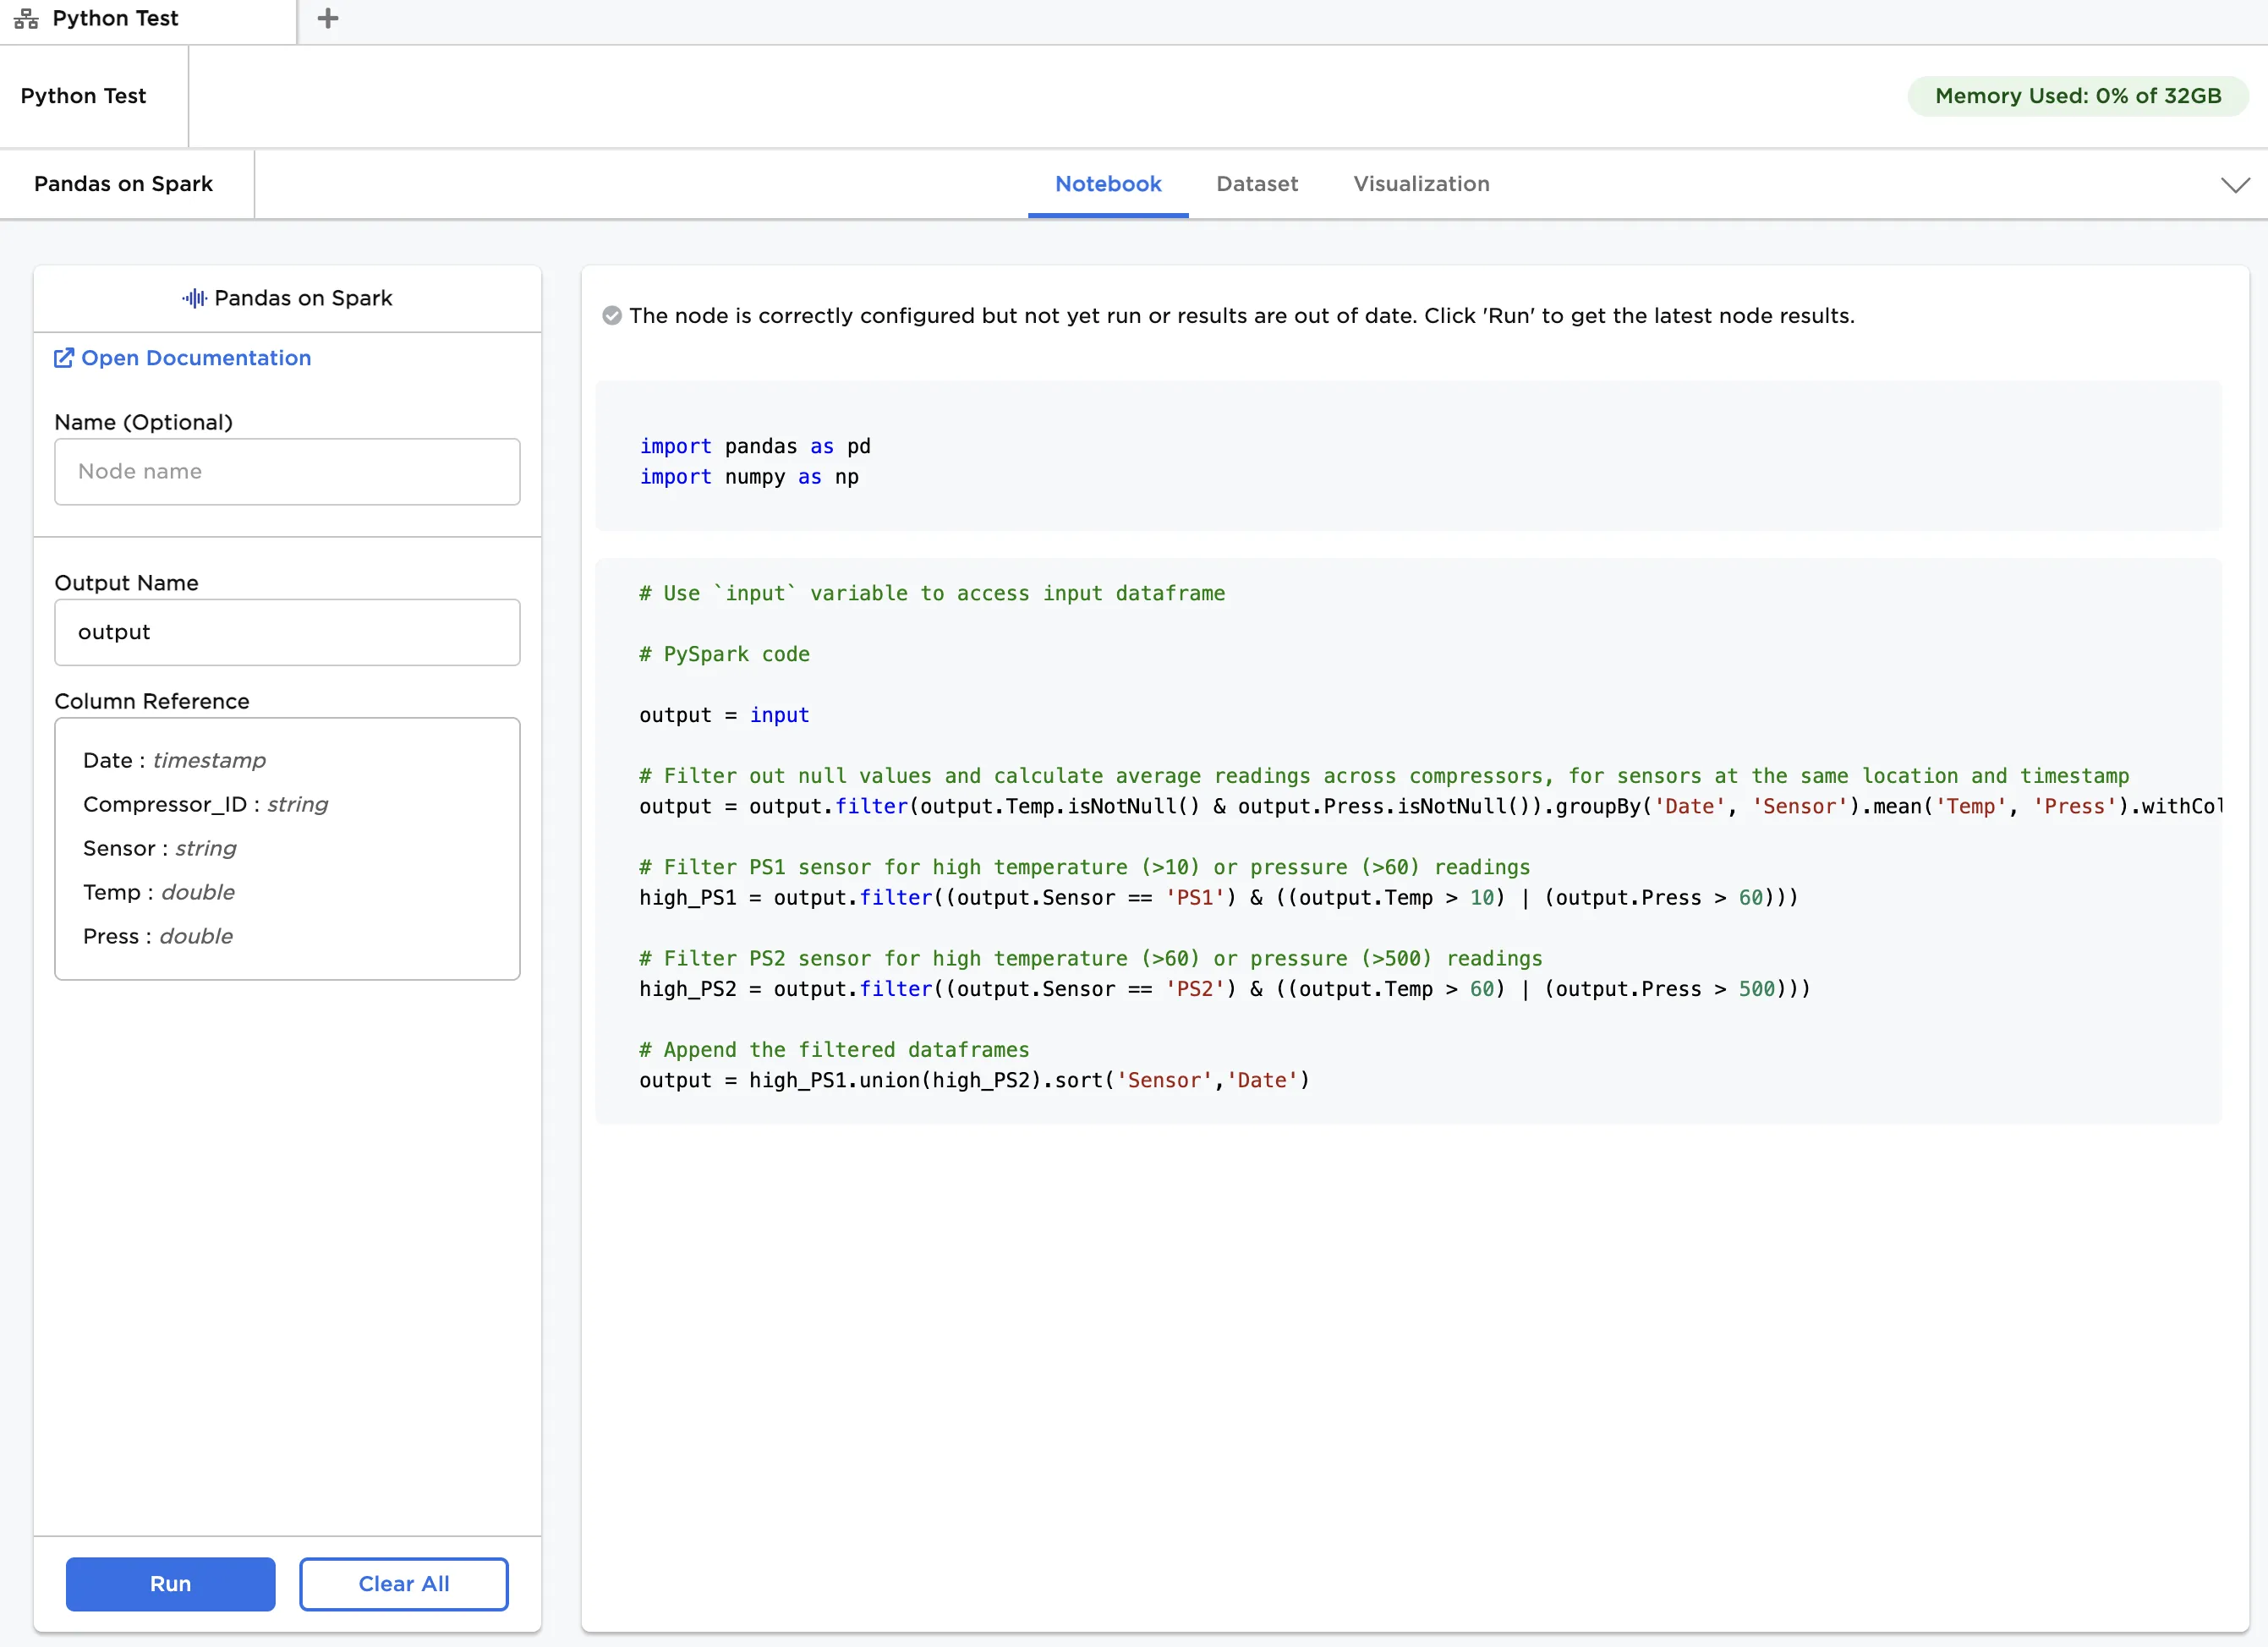
Figure 6: Example notebook using PySpark API