Python
Use Visual Notebooks to transform data using custom Python. For more information about relevant Python functions, view the documentation for the following Python libraries:
Configuration
| Field | Description |
|---|---|
| Name default=none | Field to name the node A user-specified node name, displayed in the canvas and in the dataframe as a tab. |
Group by default=No groups - data is single series | Grouping selection Select whether to to view the data in a single series or grouped by data in another column. |
| Select column to partition with default=none | Column to group by If Group data by column is selected for the Group by field, select a column to partition the data. |
Output Name default=output | Name of the output dataframe Enter a name for the dataframe that contains the output of the custom Python function. This must match the name of the output variable in the function. |
Node Inputs/Outputs
| Input | A Visual Notebooks dataframe |
|---|---|
| Output | A dataframe transformed by one or more Python functions |
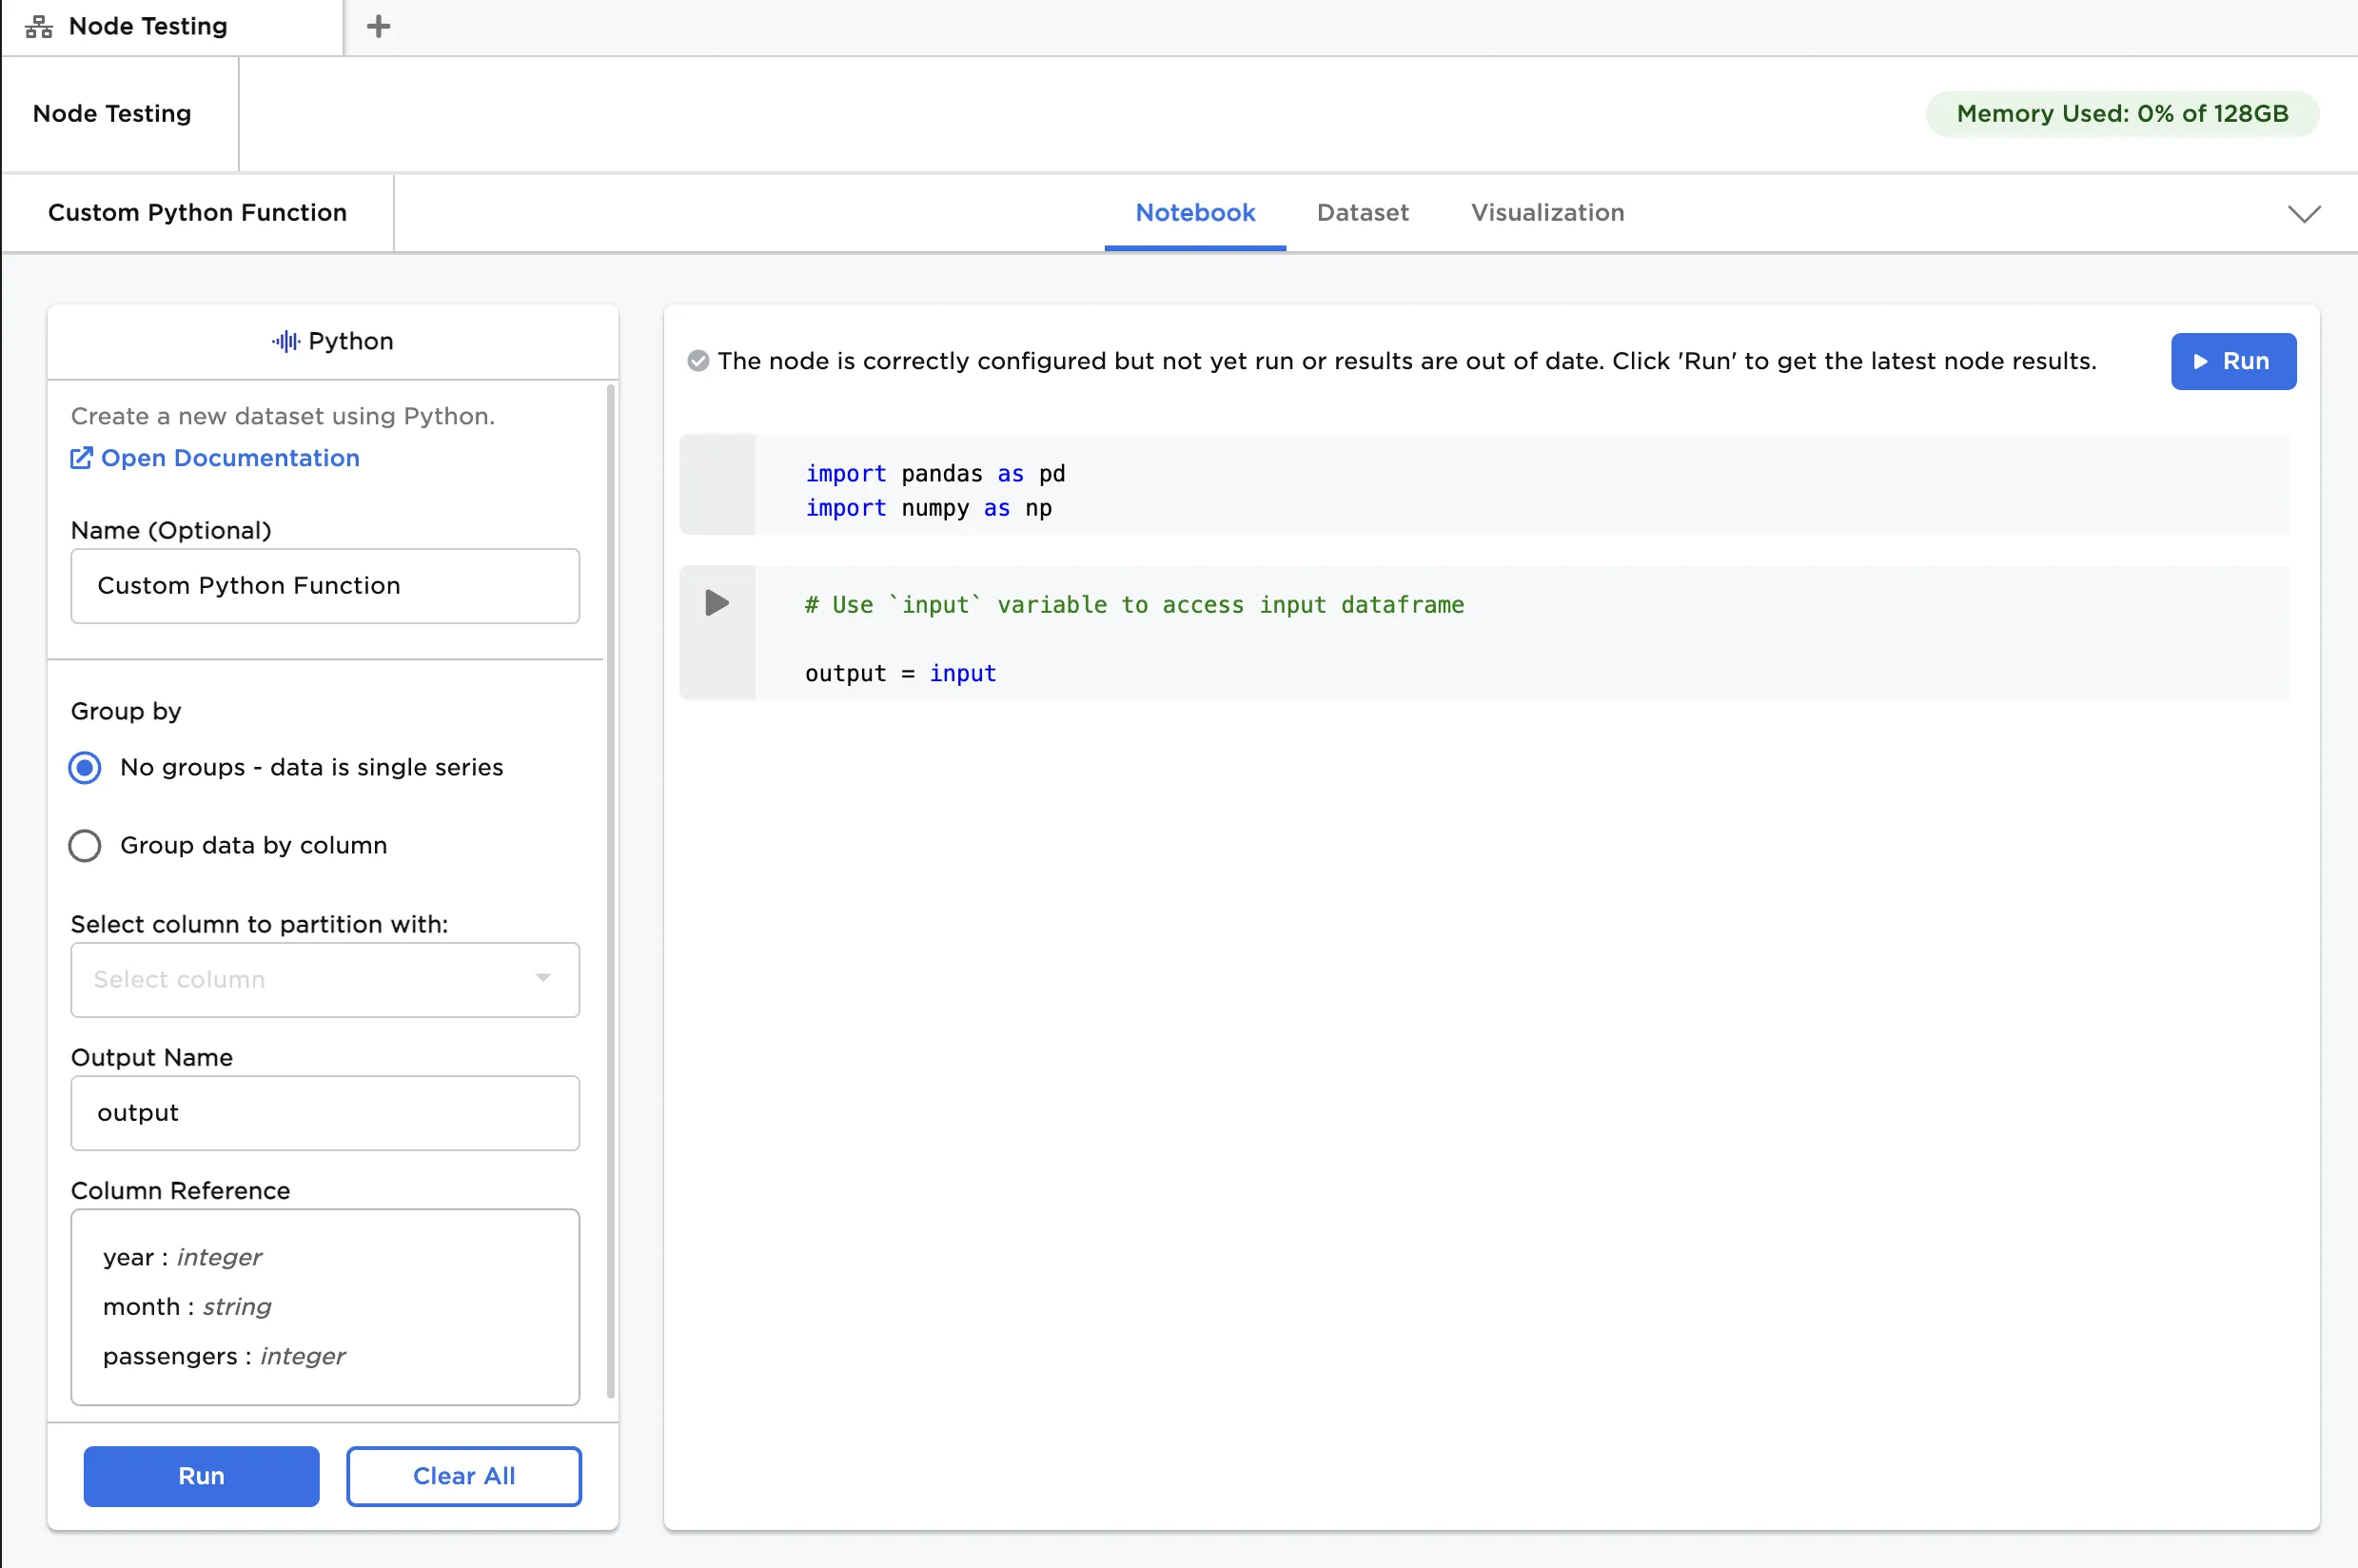 Figure 1: Example notebook
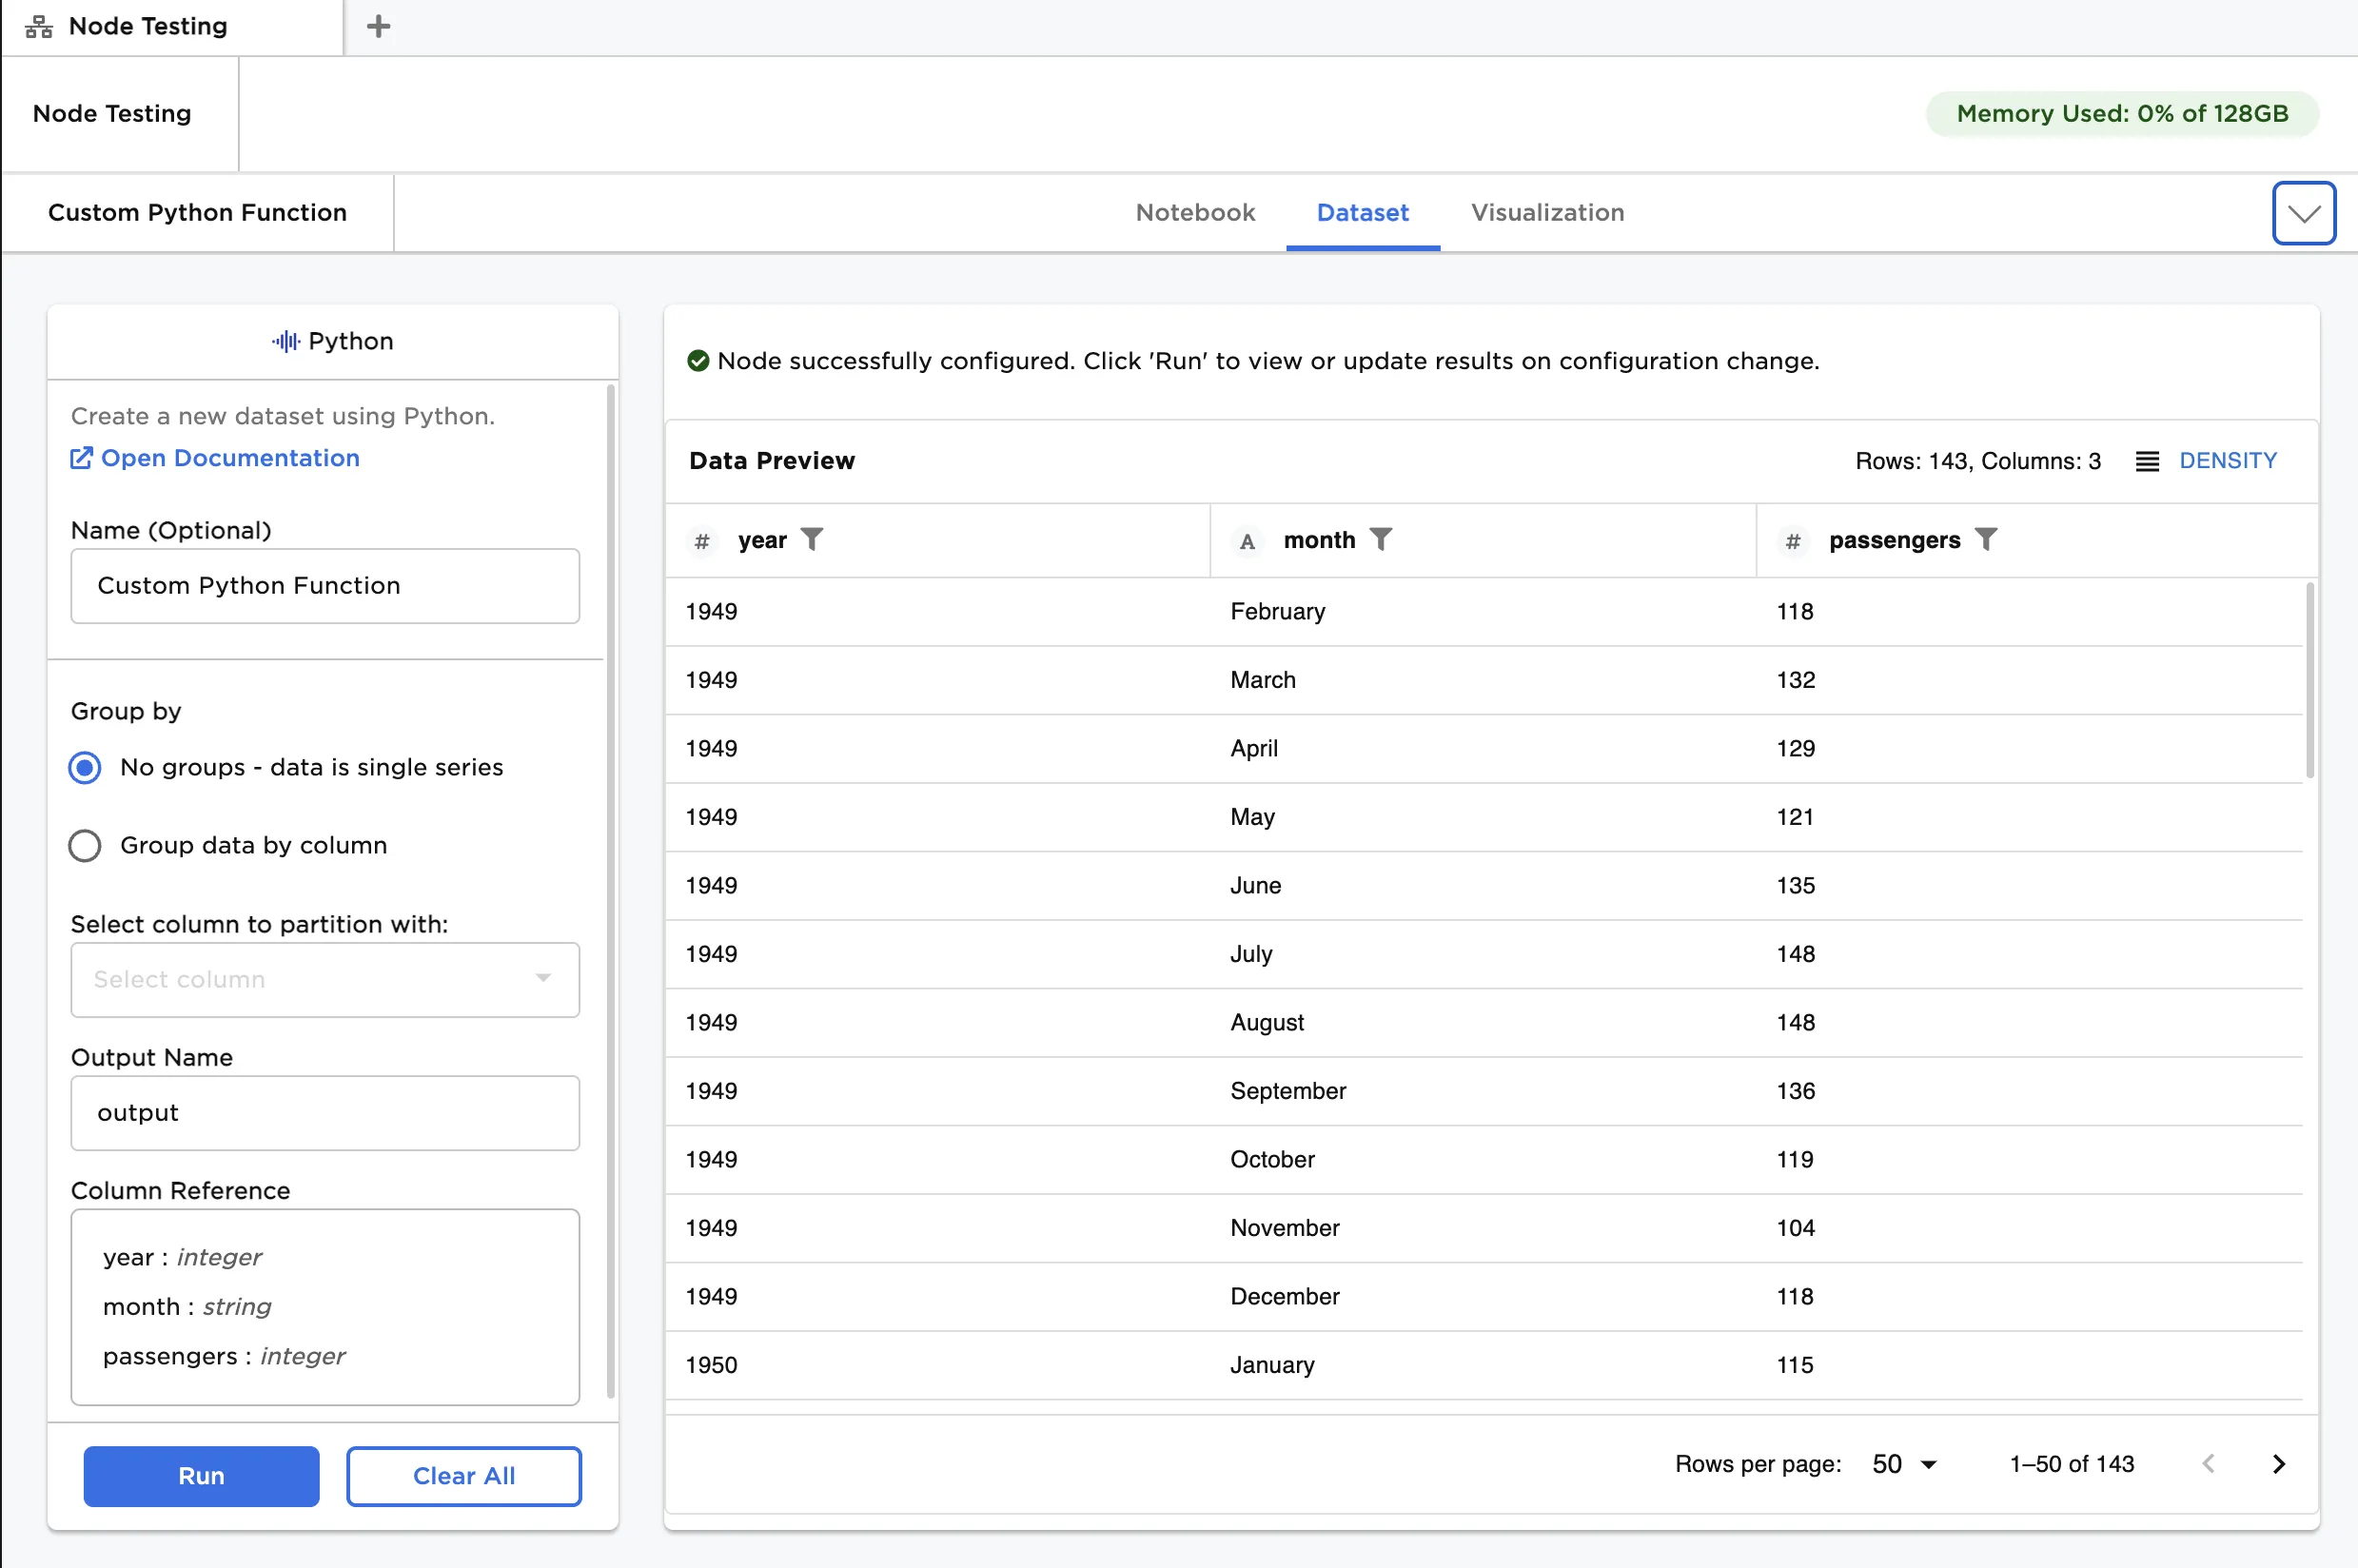 Figure 2: Example dataframe output
Examples
The data shown in Figure 3 is used in this example. It contains HR analytics for employees of a particular company. We would like to group Age into 10-year buckets as a data preprocessing step.
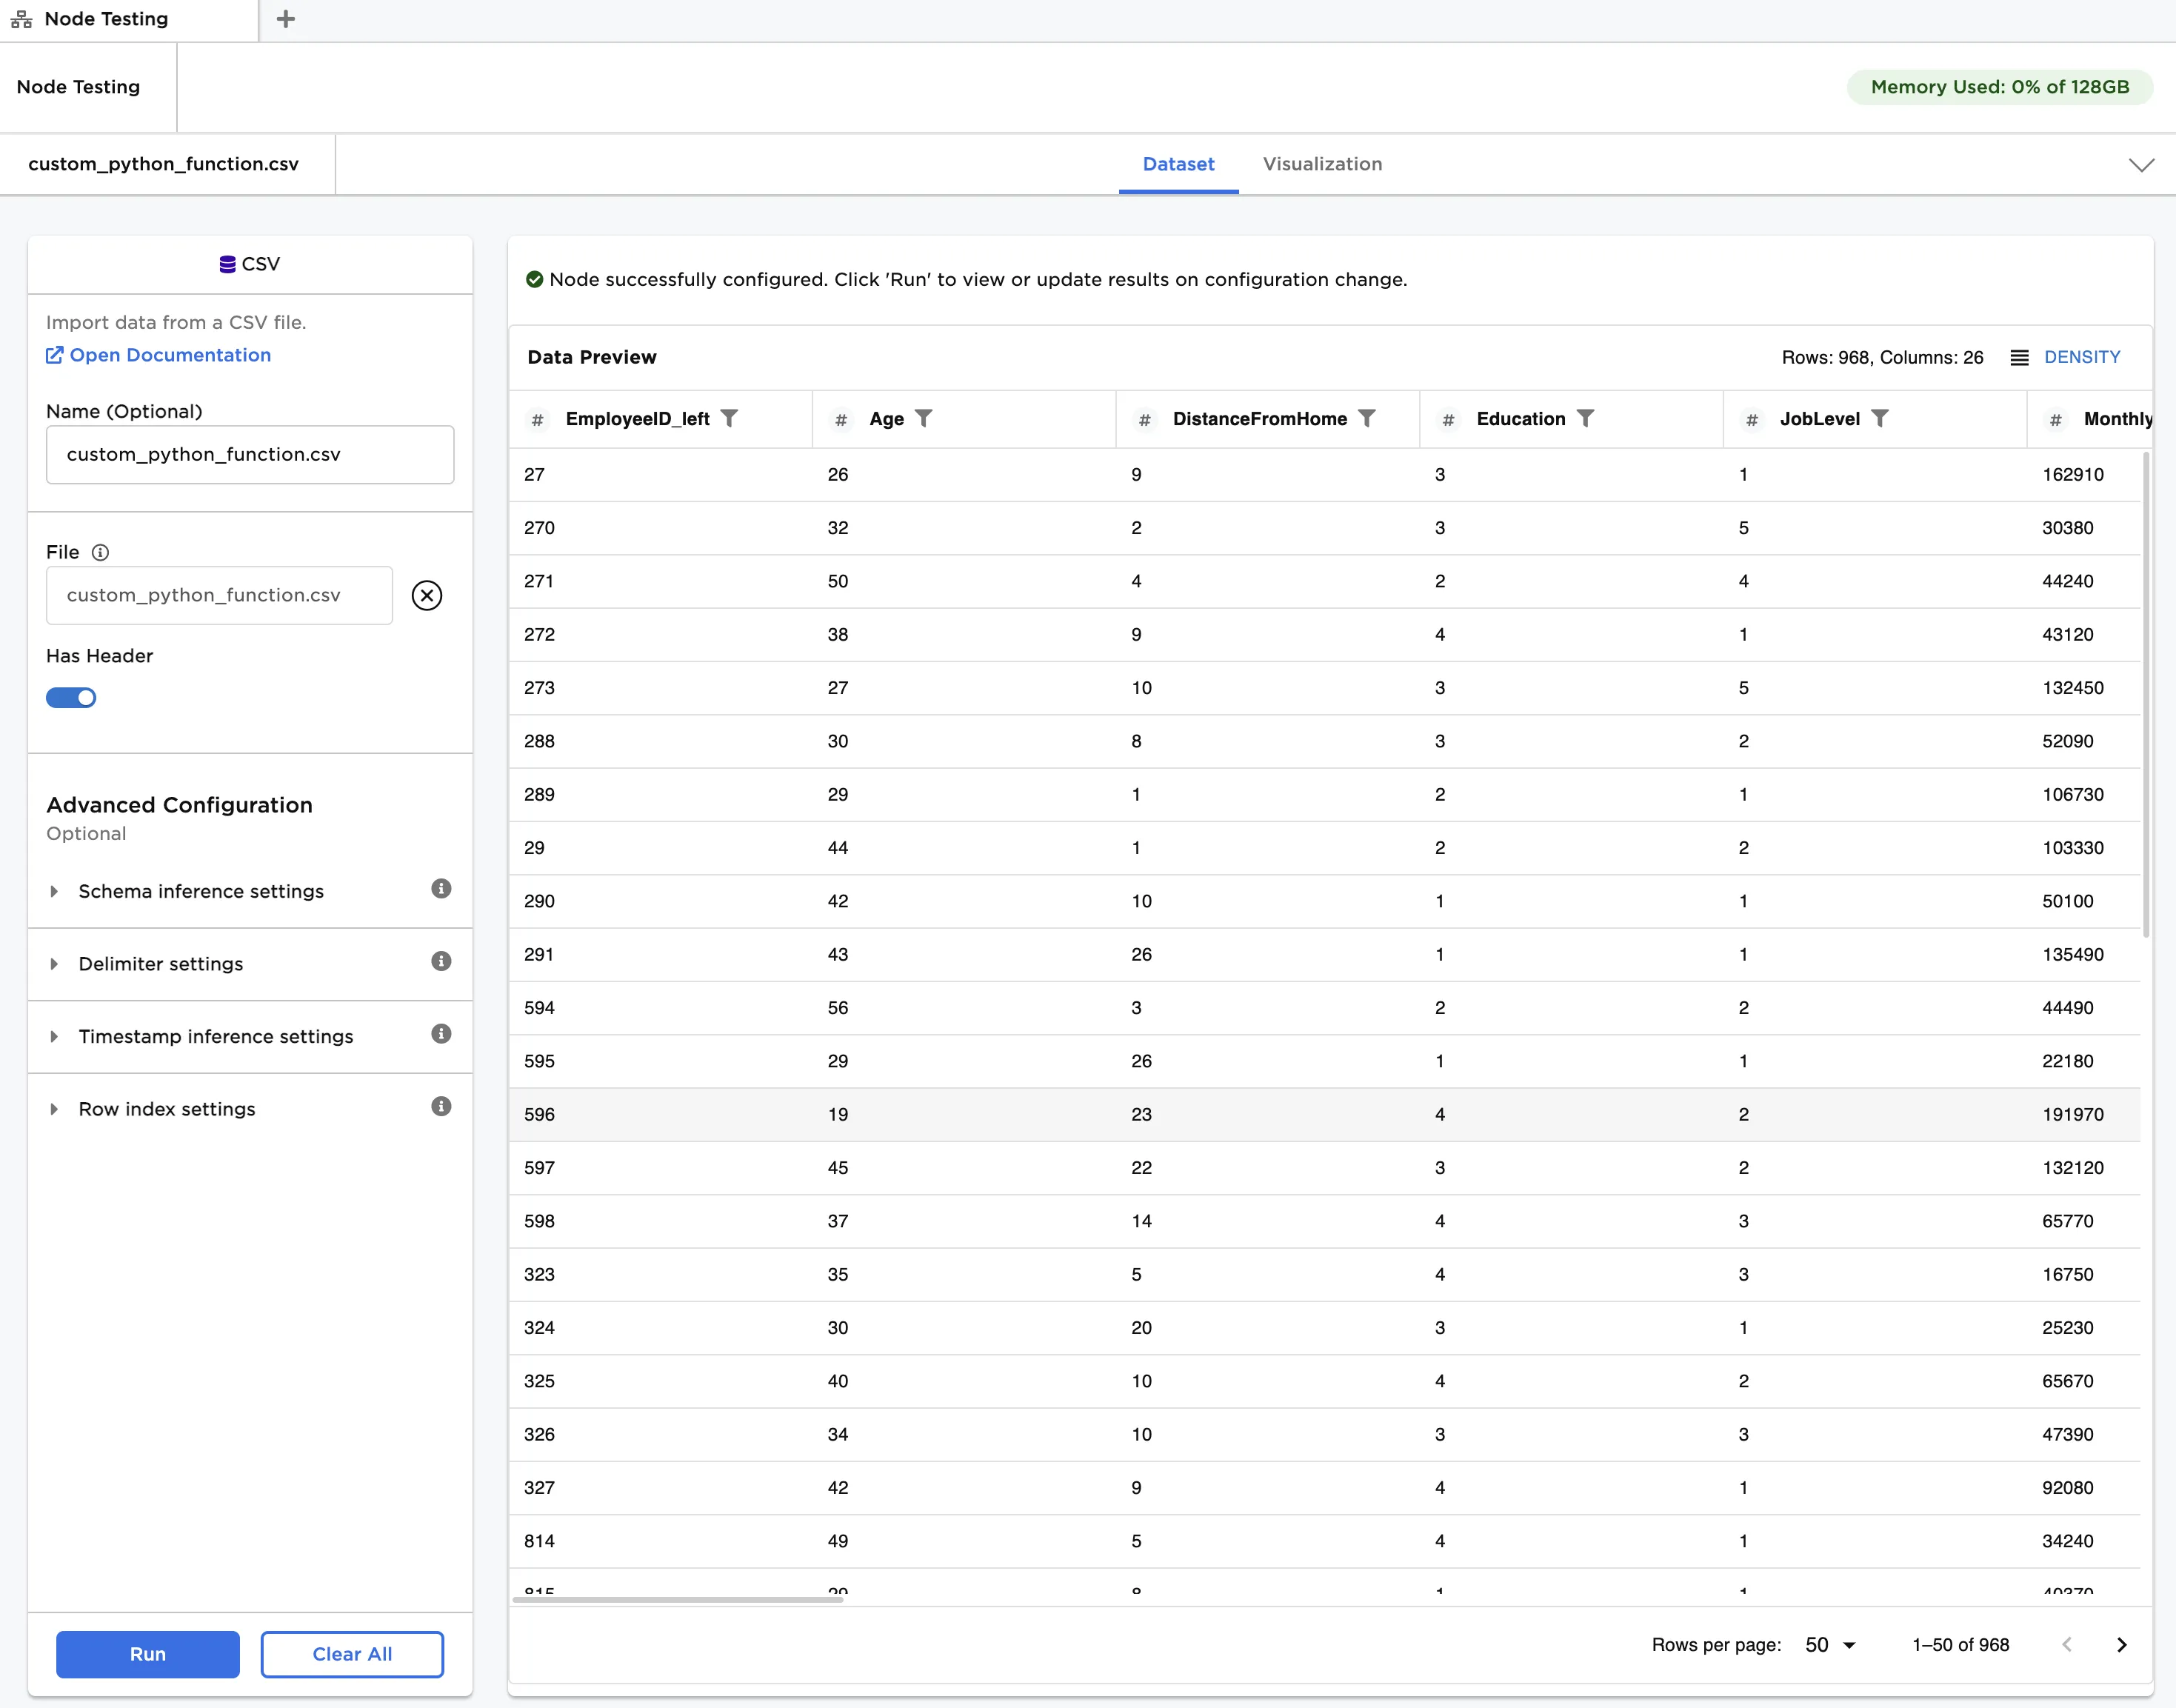
Figure 3: Example input data
Follow the steps below to create the age buckets using a custom Python function:
Connect a Python node to the example input data. Ensure
outputis entered in Output Name.Copy the code below and paste it into the Notebook tab, as shown in Figure 4. Click Run at the top right of the notebook.
- If you enter an invalid Python function, Visual Notebooks presents an error.
- Notice that Visual Notebooks displays a list of column names and types as a reference.
output = inputlabels = ["{0} - {1}".format(i, i + 9) for i in range(0, 100, 10)]output['Age_Group'] = pd.cut(output['Age'], range(0, 105, 10), right=False, labels=labels).astype(pd.StringDtype())
Click Run at the bottom of the configuration sidebar to create the
Age_Groupcolumn with the output of the custom Python function.
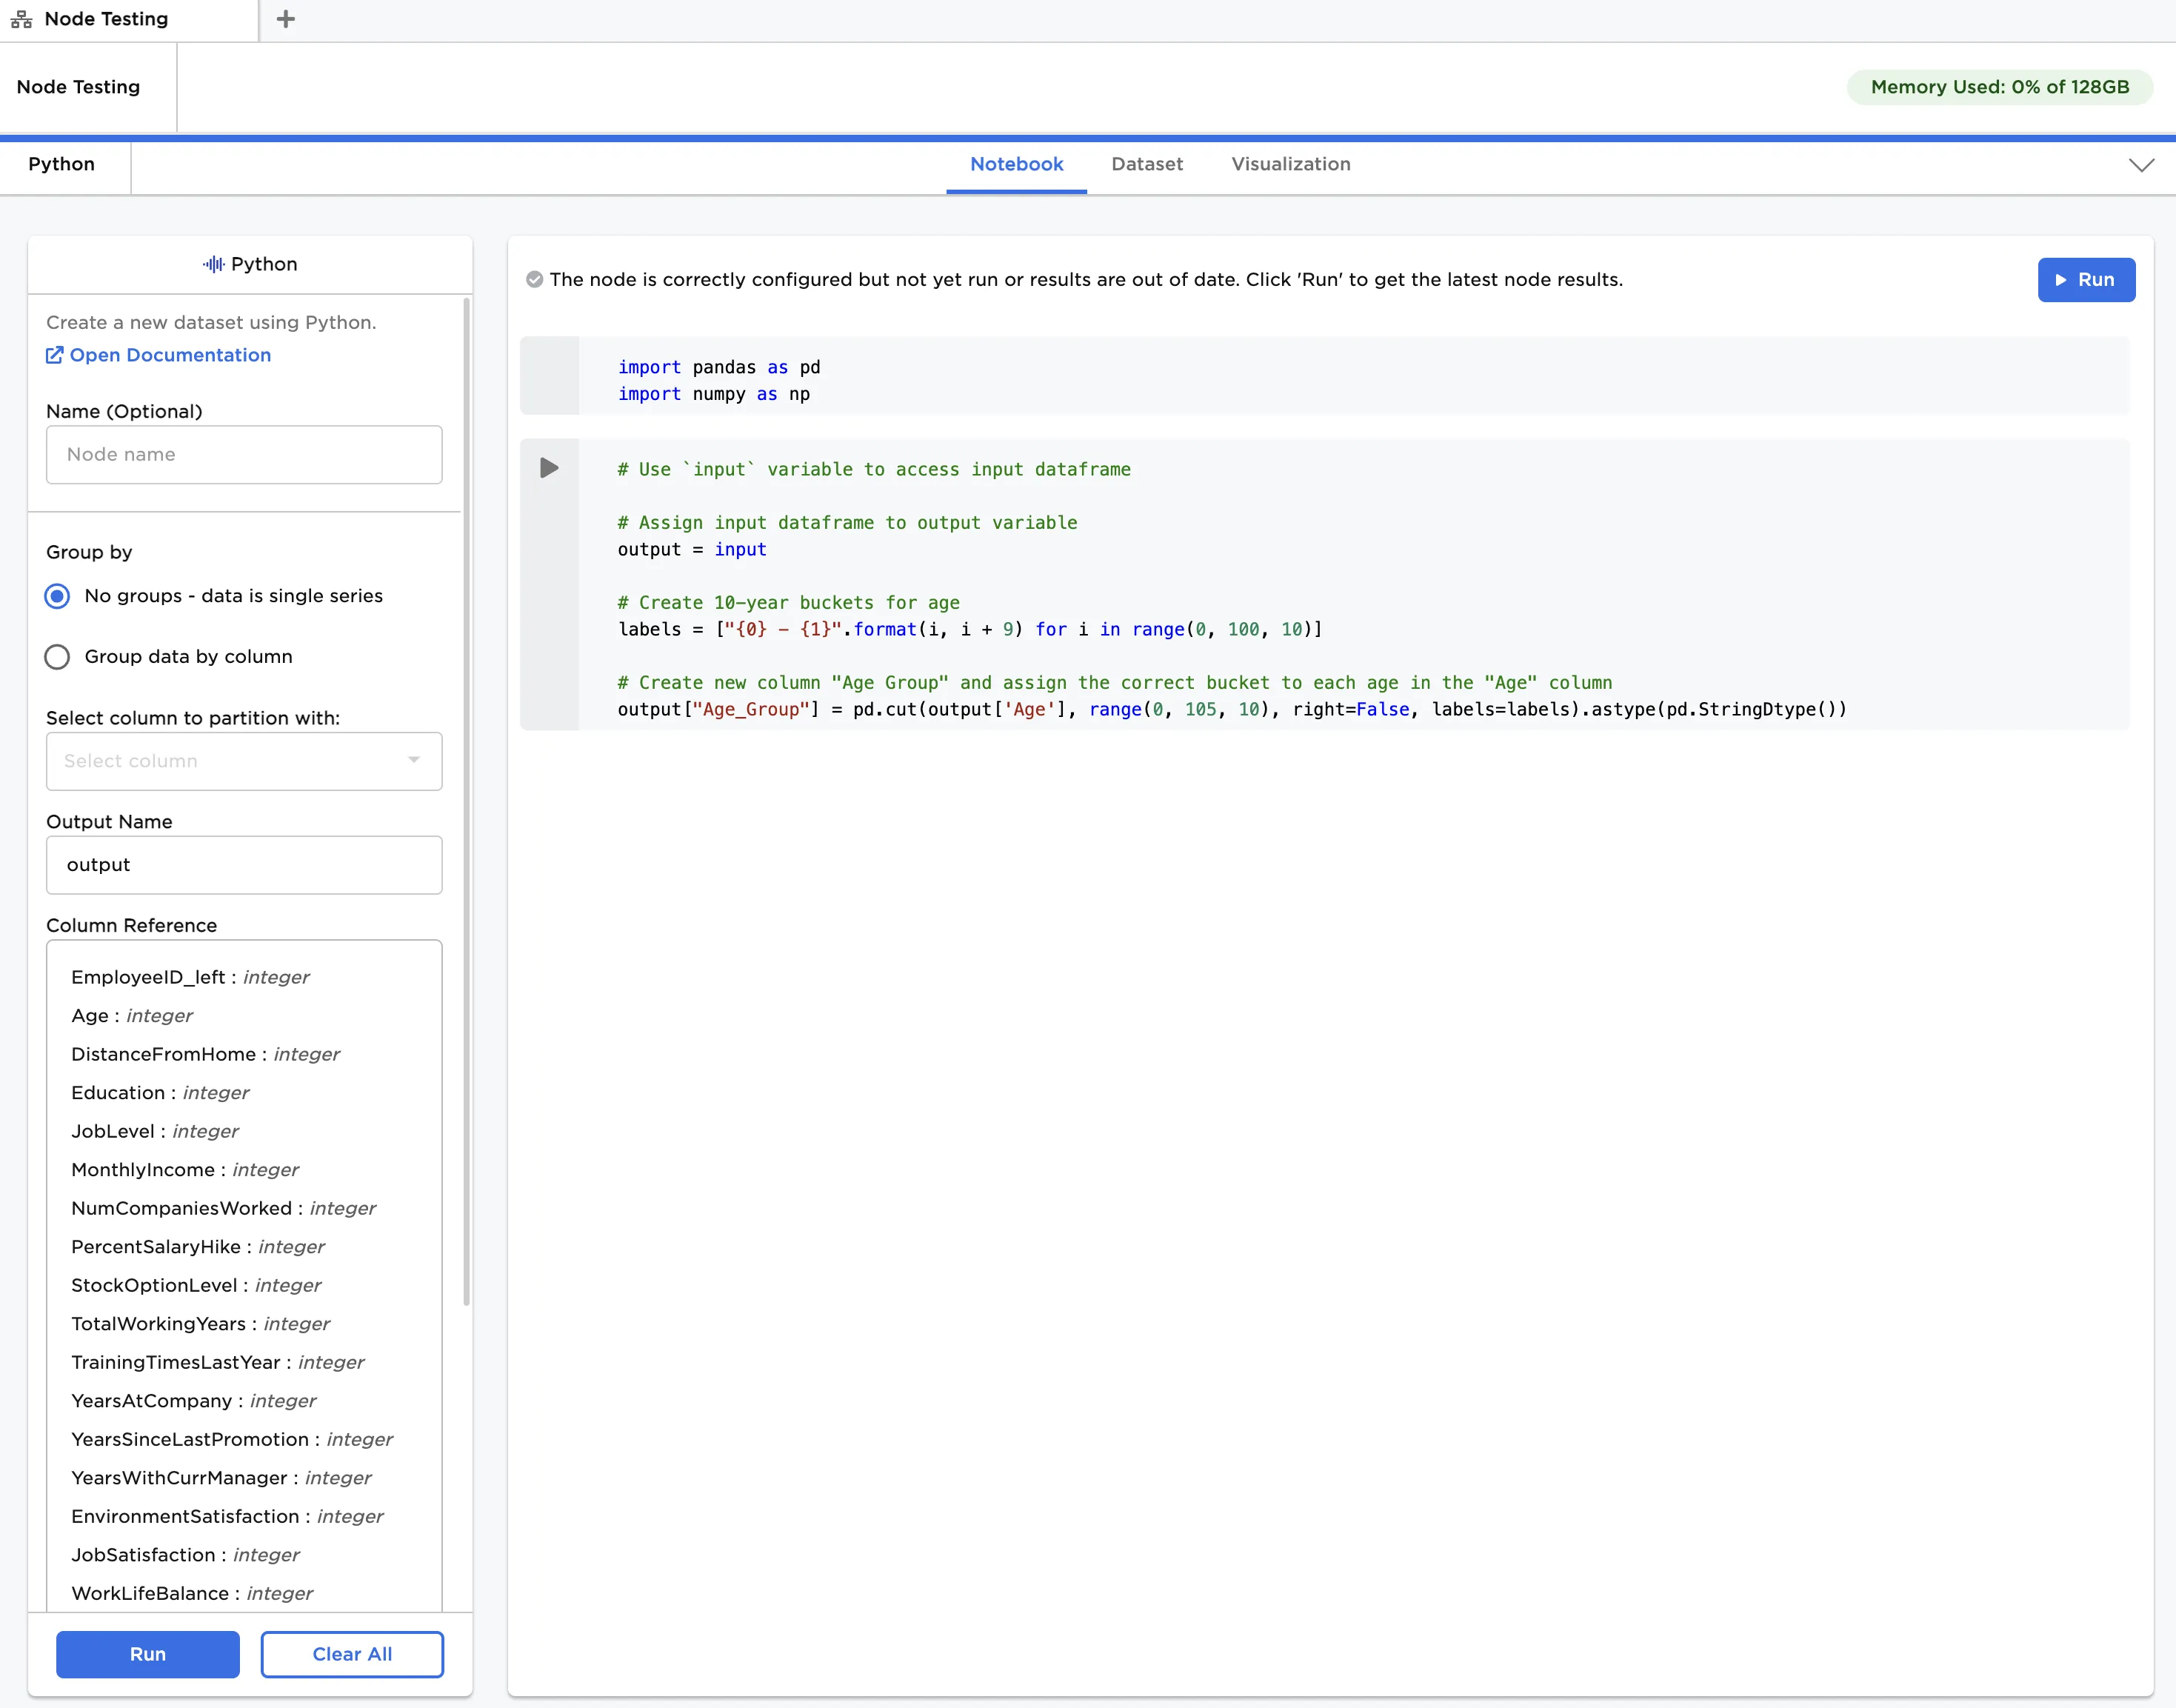 Figure 4: Example notebook with custom Python function
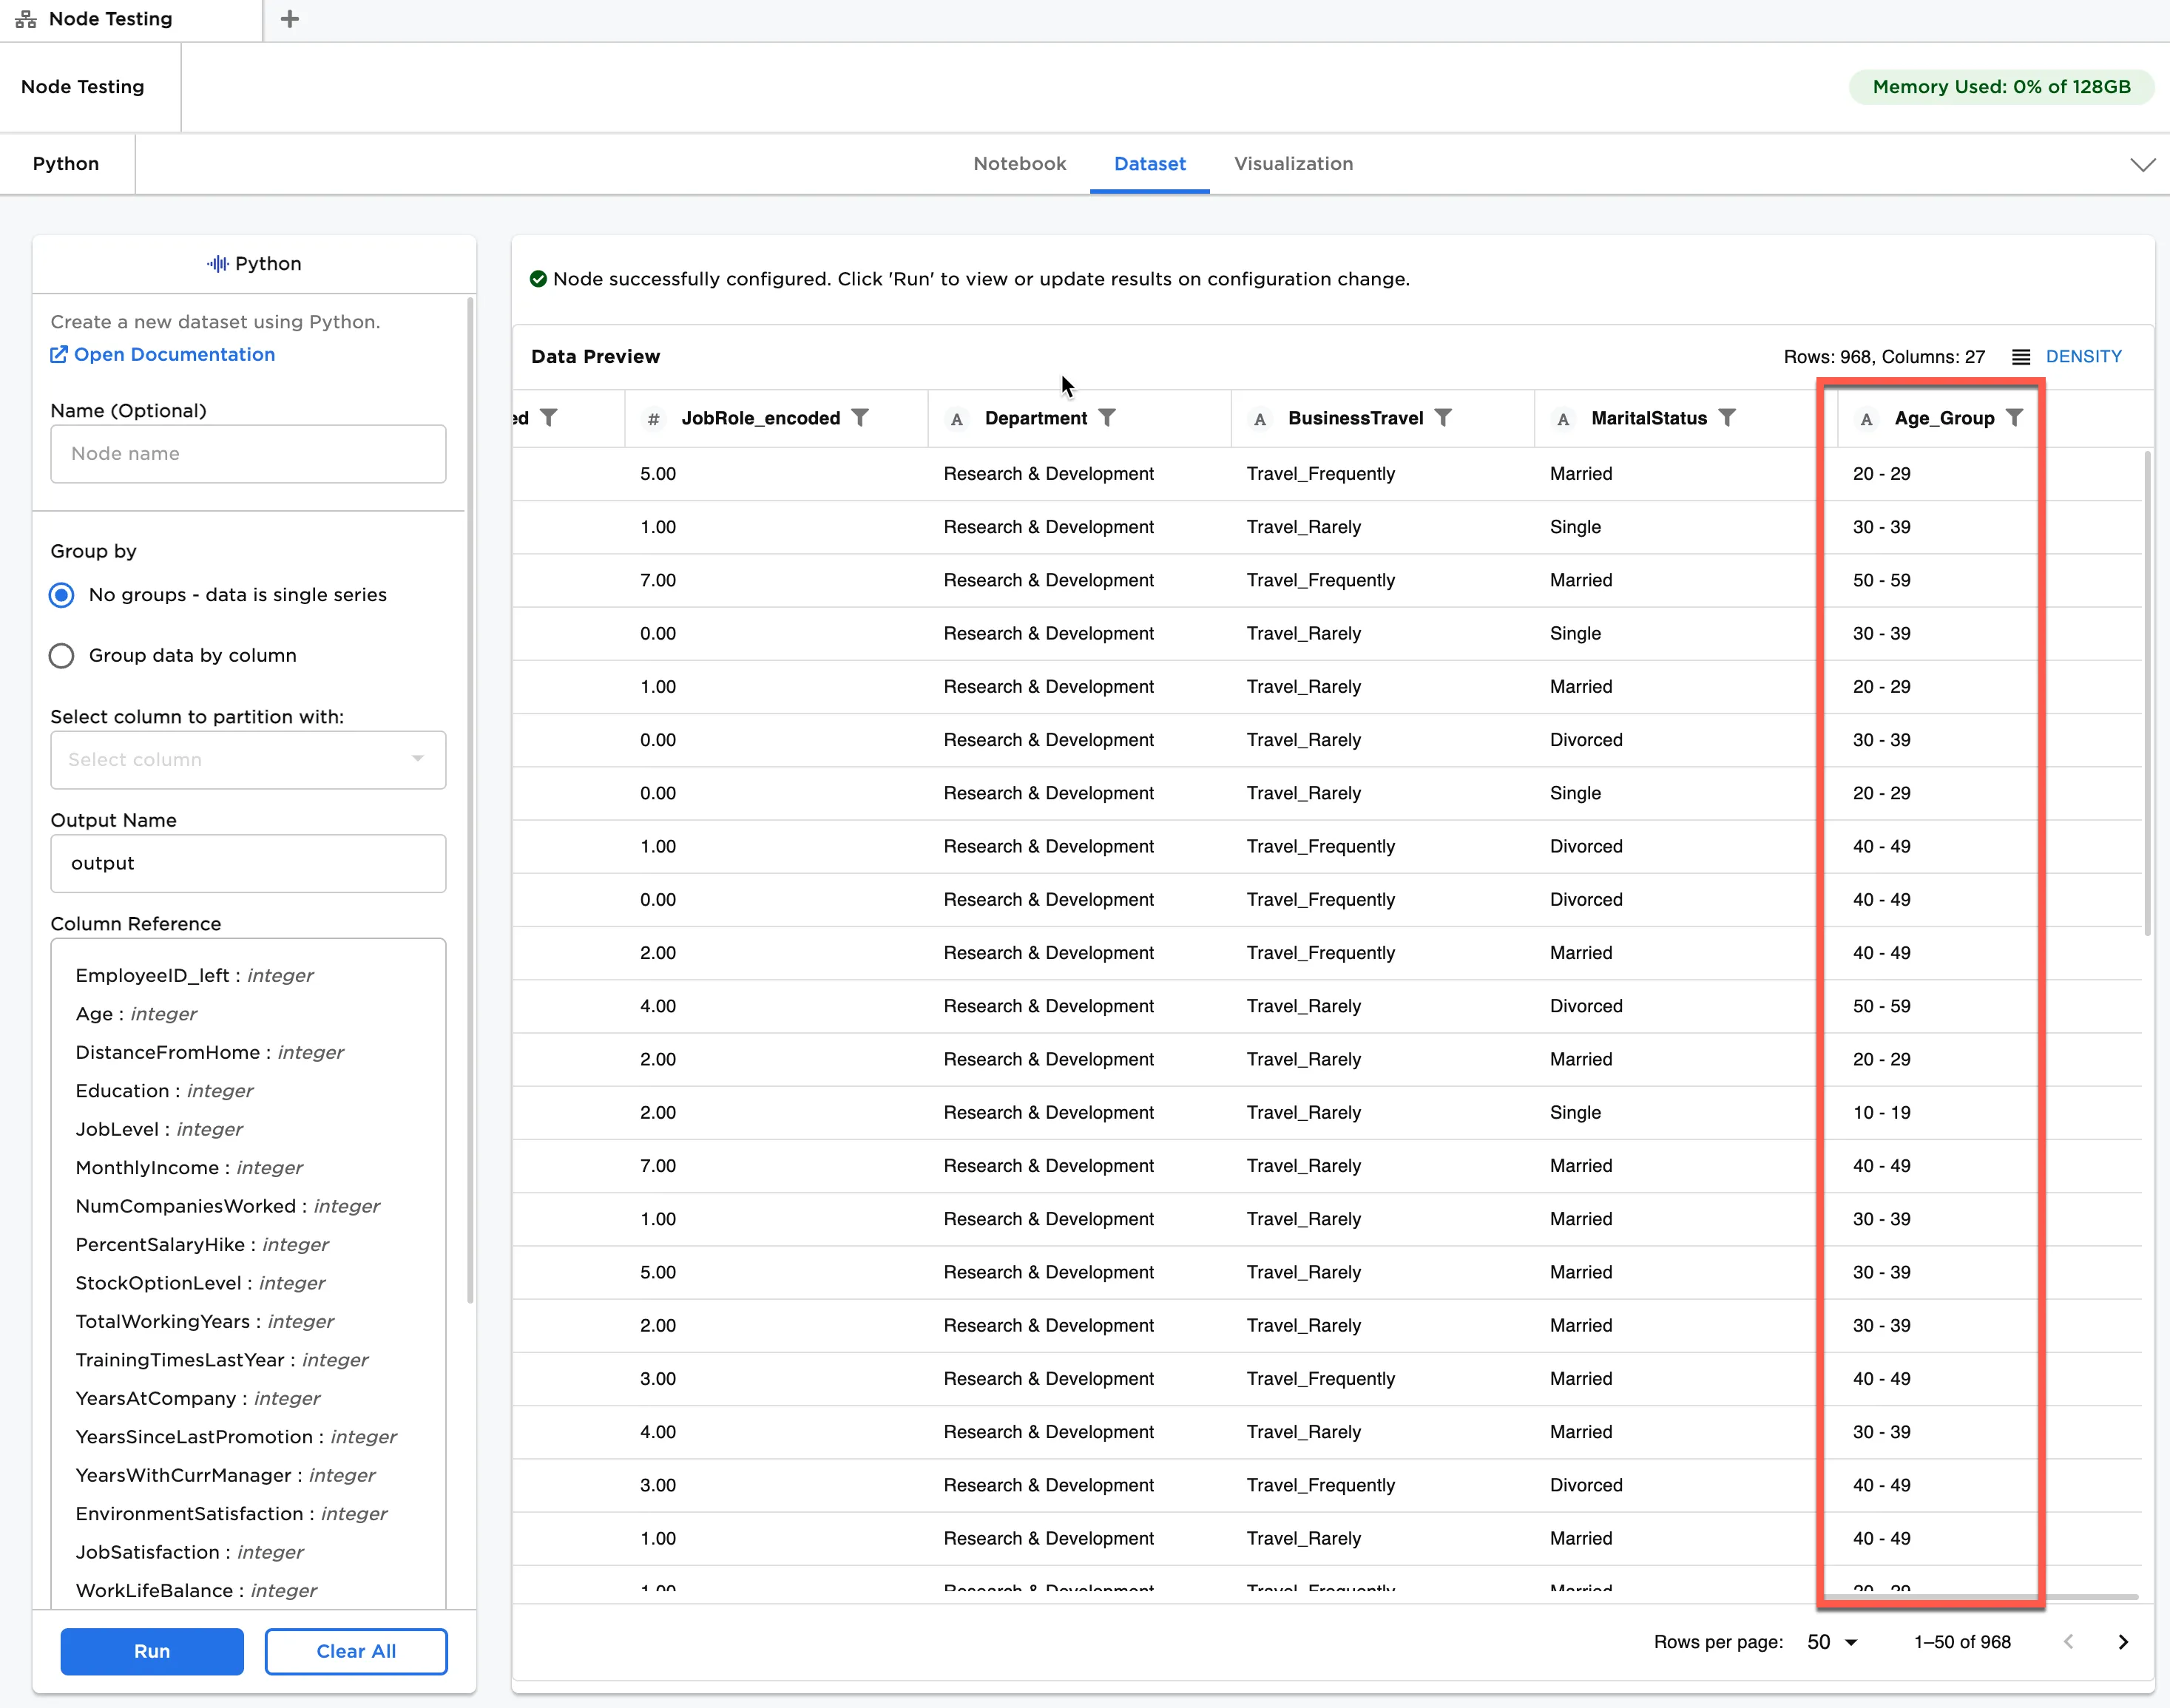
Figure 5: Example dataframe with the output of the custom Python function