Random Split
The Random Split node splits a dataset in Visual Notebooks. The dataset can be split into two datasets (training and test) after selecting one of three possible data sampling strategies.
The available Sampling Strategies are:
- Uniform: Random distribution to create train and test datasets for use cases where the split is not dependent on any particular column information.
- Stratified: Locks the distribution of classes in train and test datasets. The split of the data is based on a user-selected column in the dataset.
- Rebalanced: Rebalances the dataset in cases where there is overrepresentation or underrepresentation of a particular type of data in a column.
Configuration
| Field | Description |
|---|---|
| Name Default=none | Field to name the node An optional user-specified node name displayed in the workspace, both on the node and in the dataframe as a tab. |
Sampling Strategy Default=Uniform, 70%/30% | Select the strategy to sample the data The different strategies are used to split the datasets into train and test datasets for the user's needs. The strategy selections are: Uniform (random split of training and test), Stratified (split of training and test on the column data specified by the user), Rebalanced (compensates for over-/underrepresentation of data in a column). Note: The split percentages must equal 100% (70%/30%, 75%/25%, 80%/20%, and so forth). To work optimally, the training dataset (First Dataset) must be larger than the test dataset (Second Dataset). |
Node Inputs/Outputs
| Input | A Visual Notebooks dataframe |
|---|---|
| Output | Create two datasets: one training and one test that can be used for machine learning |
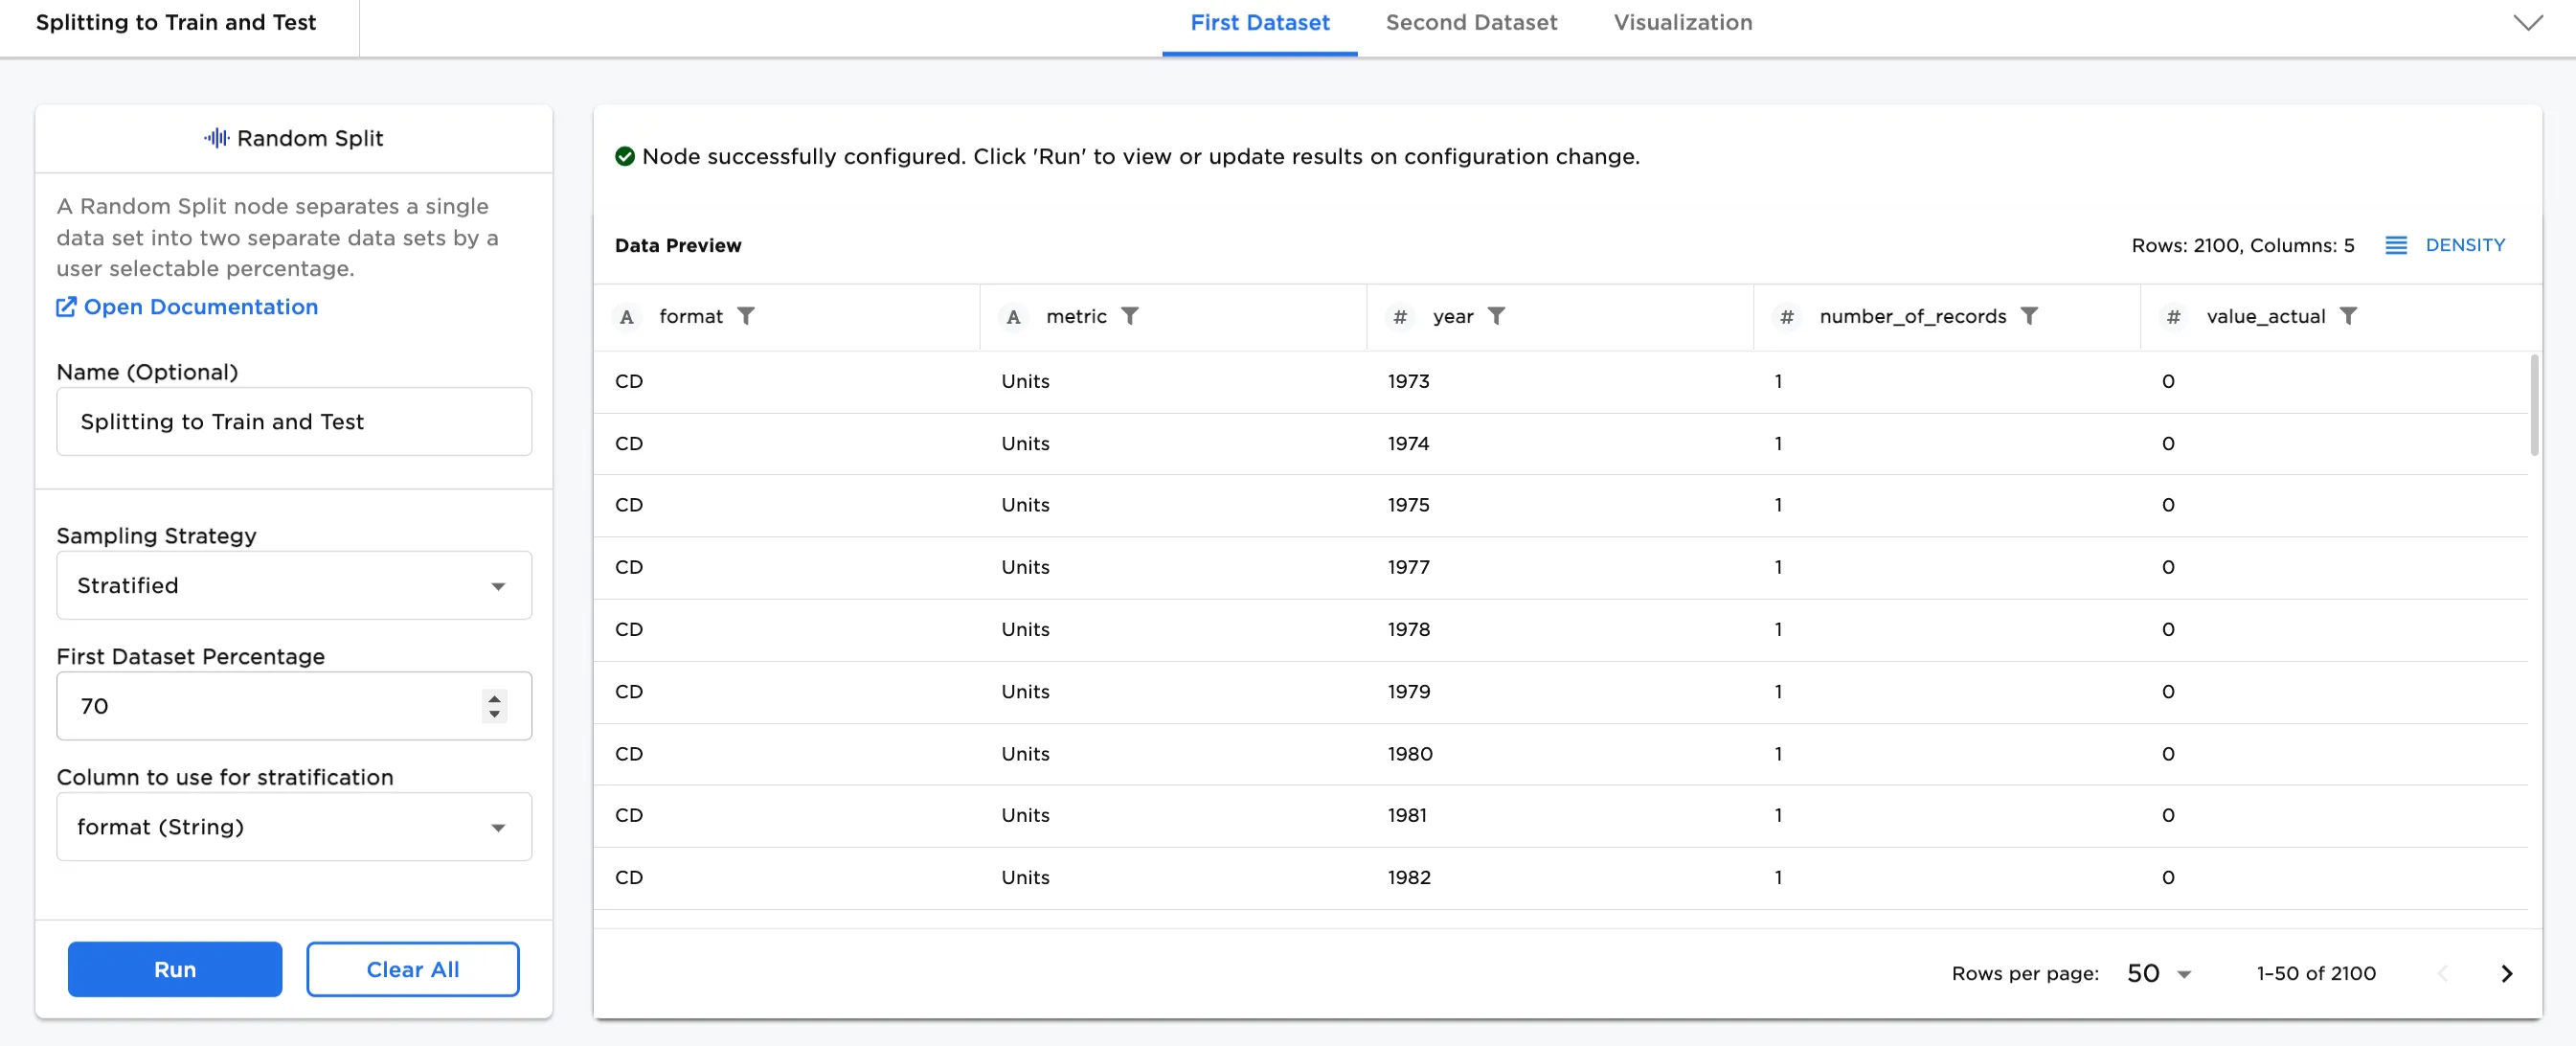
Figure 1: Example output
After creating both datasets, AutoML nodes or ML Pipelines can be added to the workspace to train the First Dataset and test the Second Dataset, respectively.
Examples
Historical data offers context and insight for future predictions. Larger datasets over longer periods of time can provide insights for future trends compensating for evolving technologies or trends, or even random anomalies. Therefore, a best practice for training and testing data is using a larger dataset with a lot of data and criteria.
In the following examples, music sales by format is used. To download the data and follow along in the examples. Figure 2a shows an input node with the example data. You'll notice in the bottom right corner that there are 3008 rows in the dataset. The dataset shows the number and dollar amount of sales by format (8-Track, Cassette, CD, and other formats) between 1973 and 2019.
Note: The data comes from Kaggle compiled from data available at Visualcapitalist and Riaa. A license was not specified at the source.
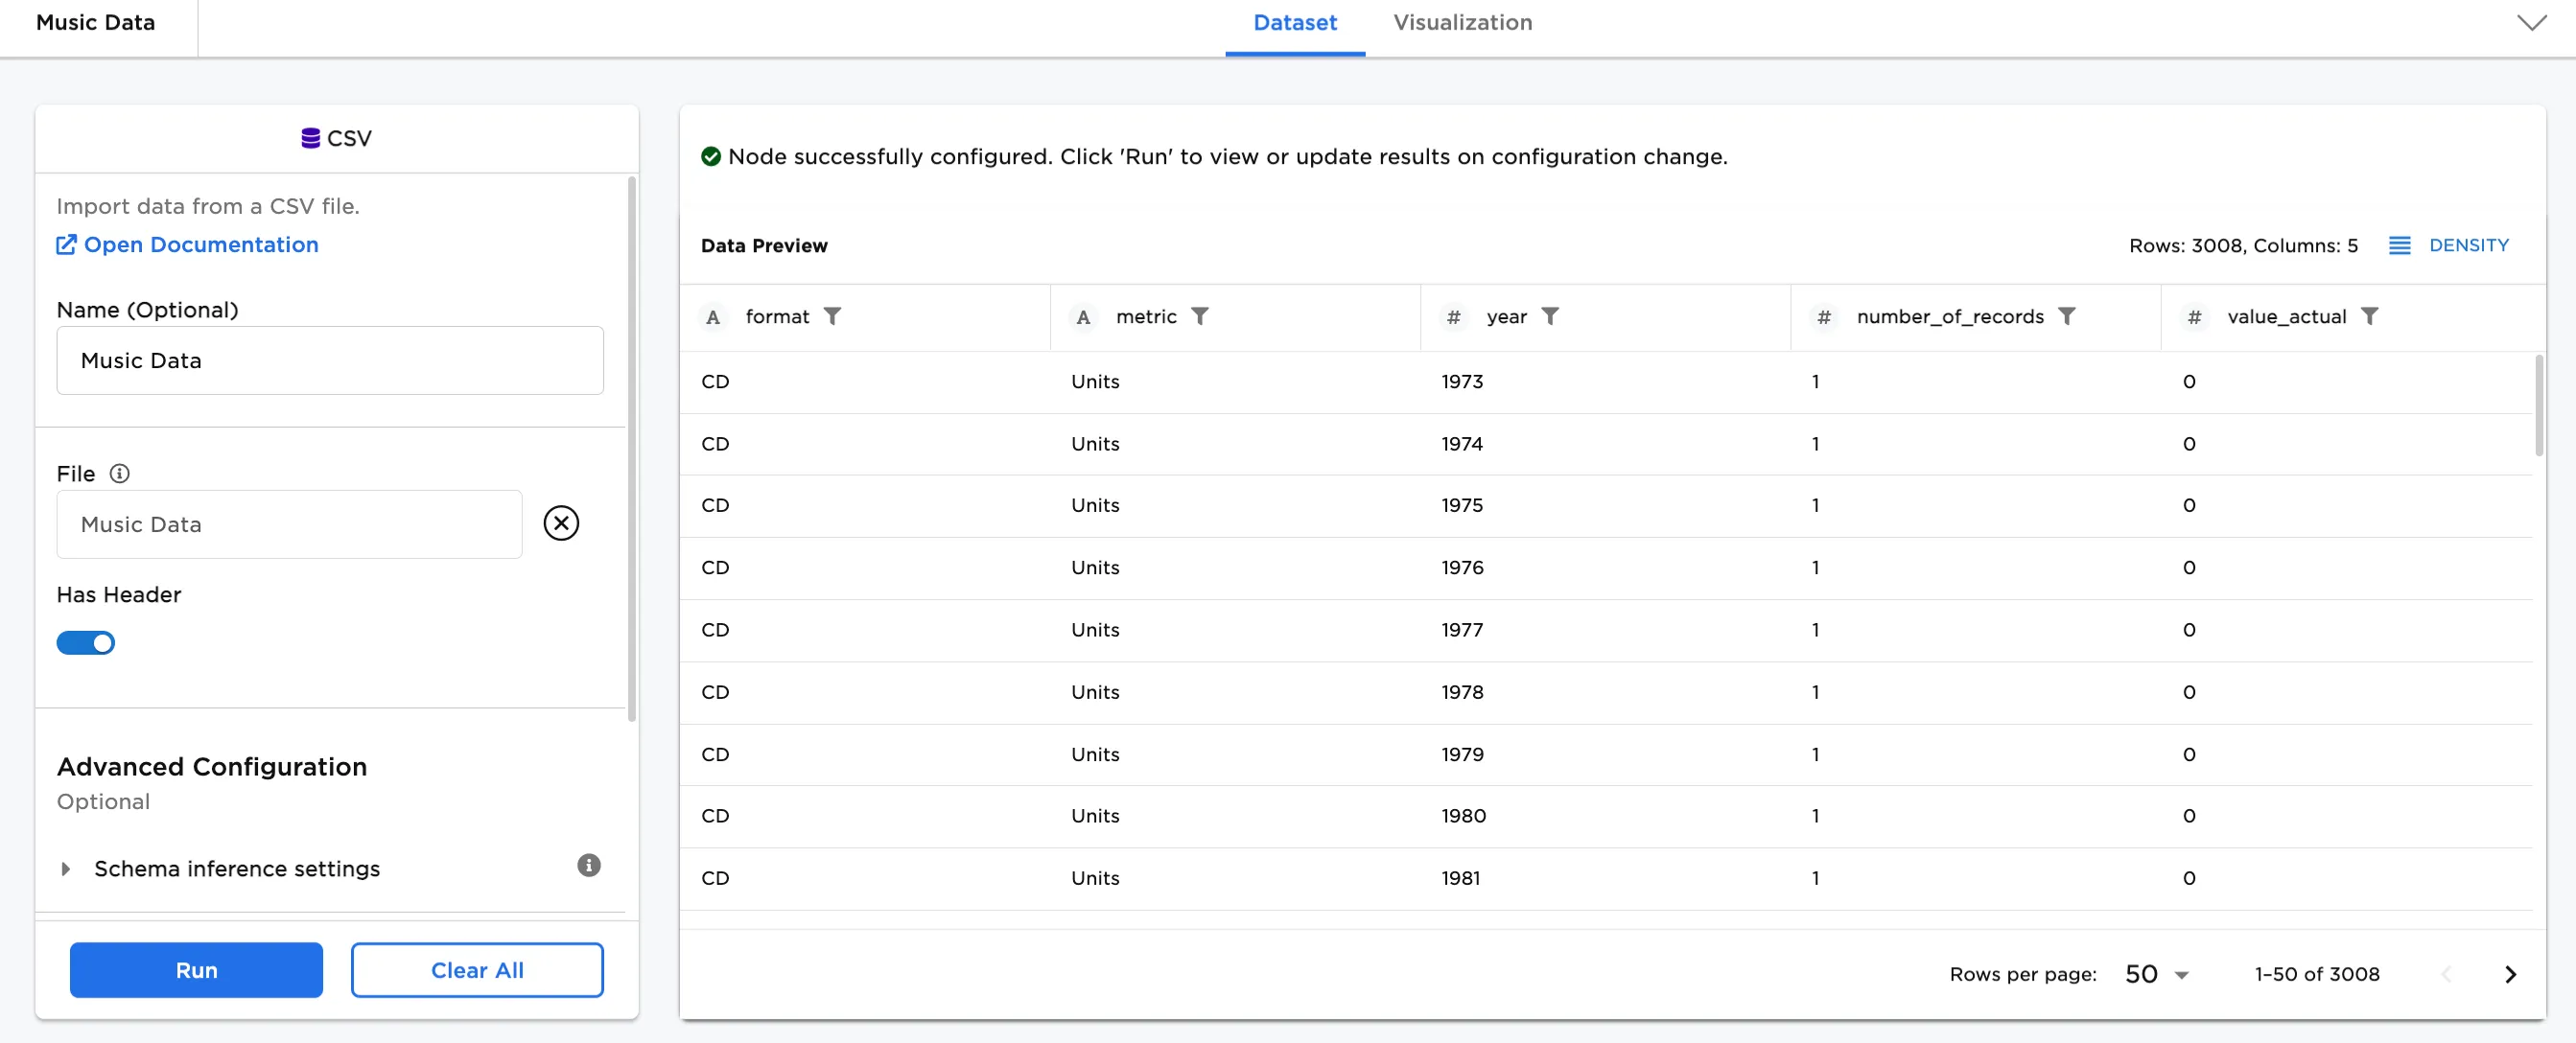
Figure 2a: Example input data
For reference, this is what the workspace would look like in Figure 2b.
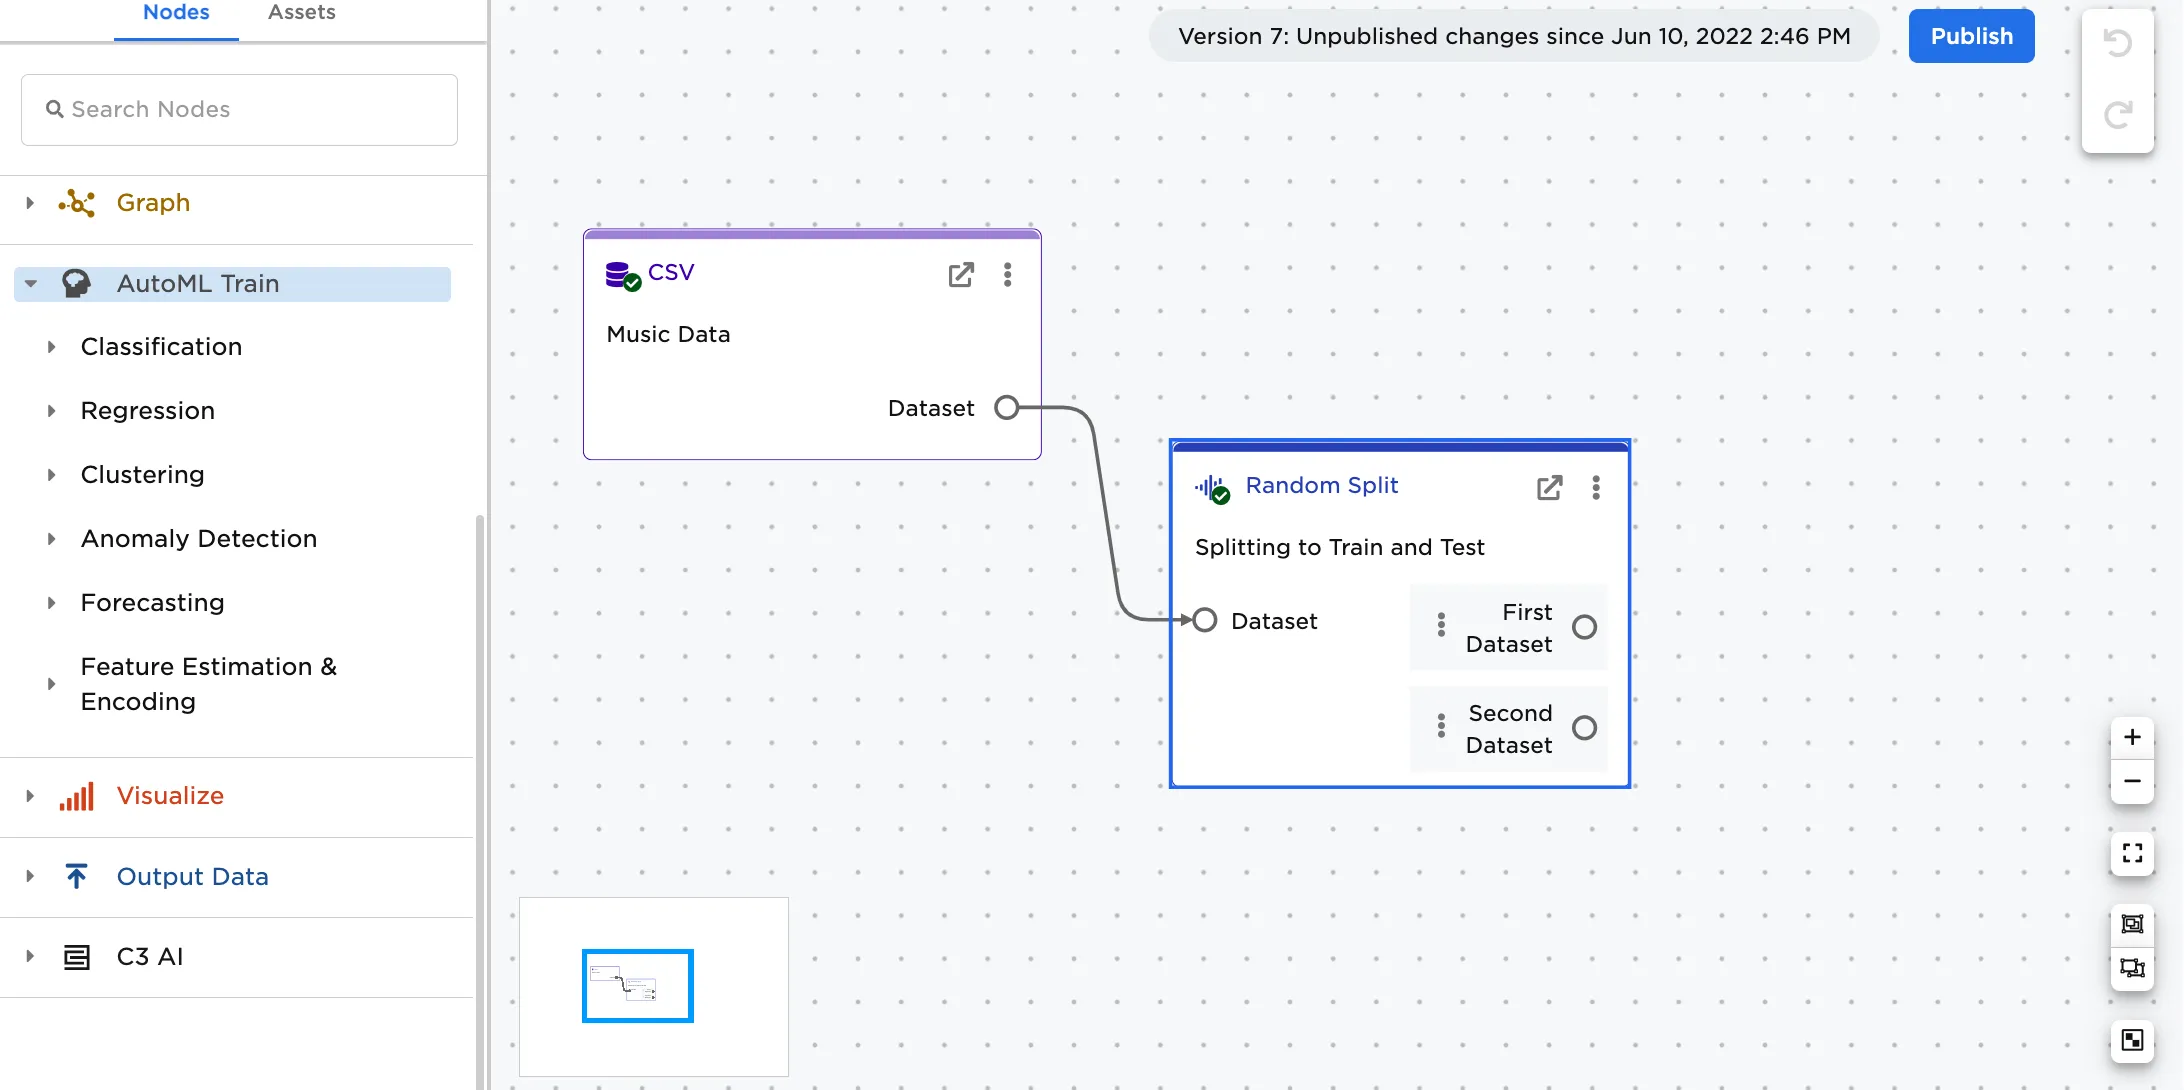
Figure 2b: Example workspace
- Connect an existing node to the Random Split node.
- Optionally, add a name to the node. In Figure 3a, the node is named, "Splitting to Train and Test".
- To continue, select a Sampling Strategy. In this case, Stratified has been chosen.
- The default is 70% for the First Dataset Percentage.
- Select a Column to use for stratification. In this case,
format (String)has been selected. This means that the format of the music is used as the basis for the 70%/30% split of the dataset. - Select Run.
Note: The first and second dataset must equal 100%. To train your data for machine learning (ML), the first dataset should be > 50%. The second dataset is used for testing.
In Figure 3a, notice that there are now 2100 rows (70%) of data in the First Dataset. There is also a tab for the Second Dataset that contains the remainder (30%) of the data.

Figure 3a: Example stratified, 70% dataset
- In Figures 3b and 3c, the First Dataset Percentage is changed to 80% and shows 2420 rows in the First Dataset, and shows 20% (588) rows in the Second Dataset.
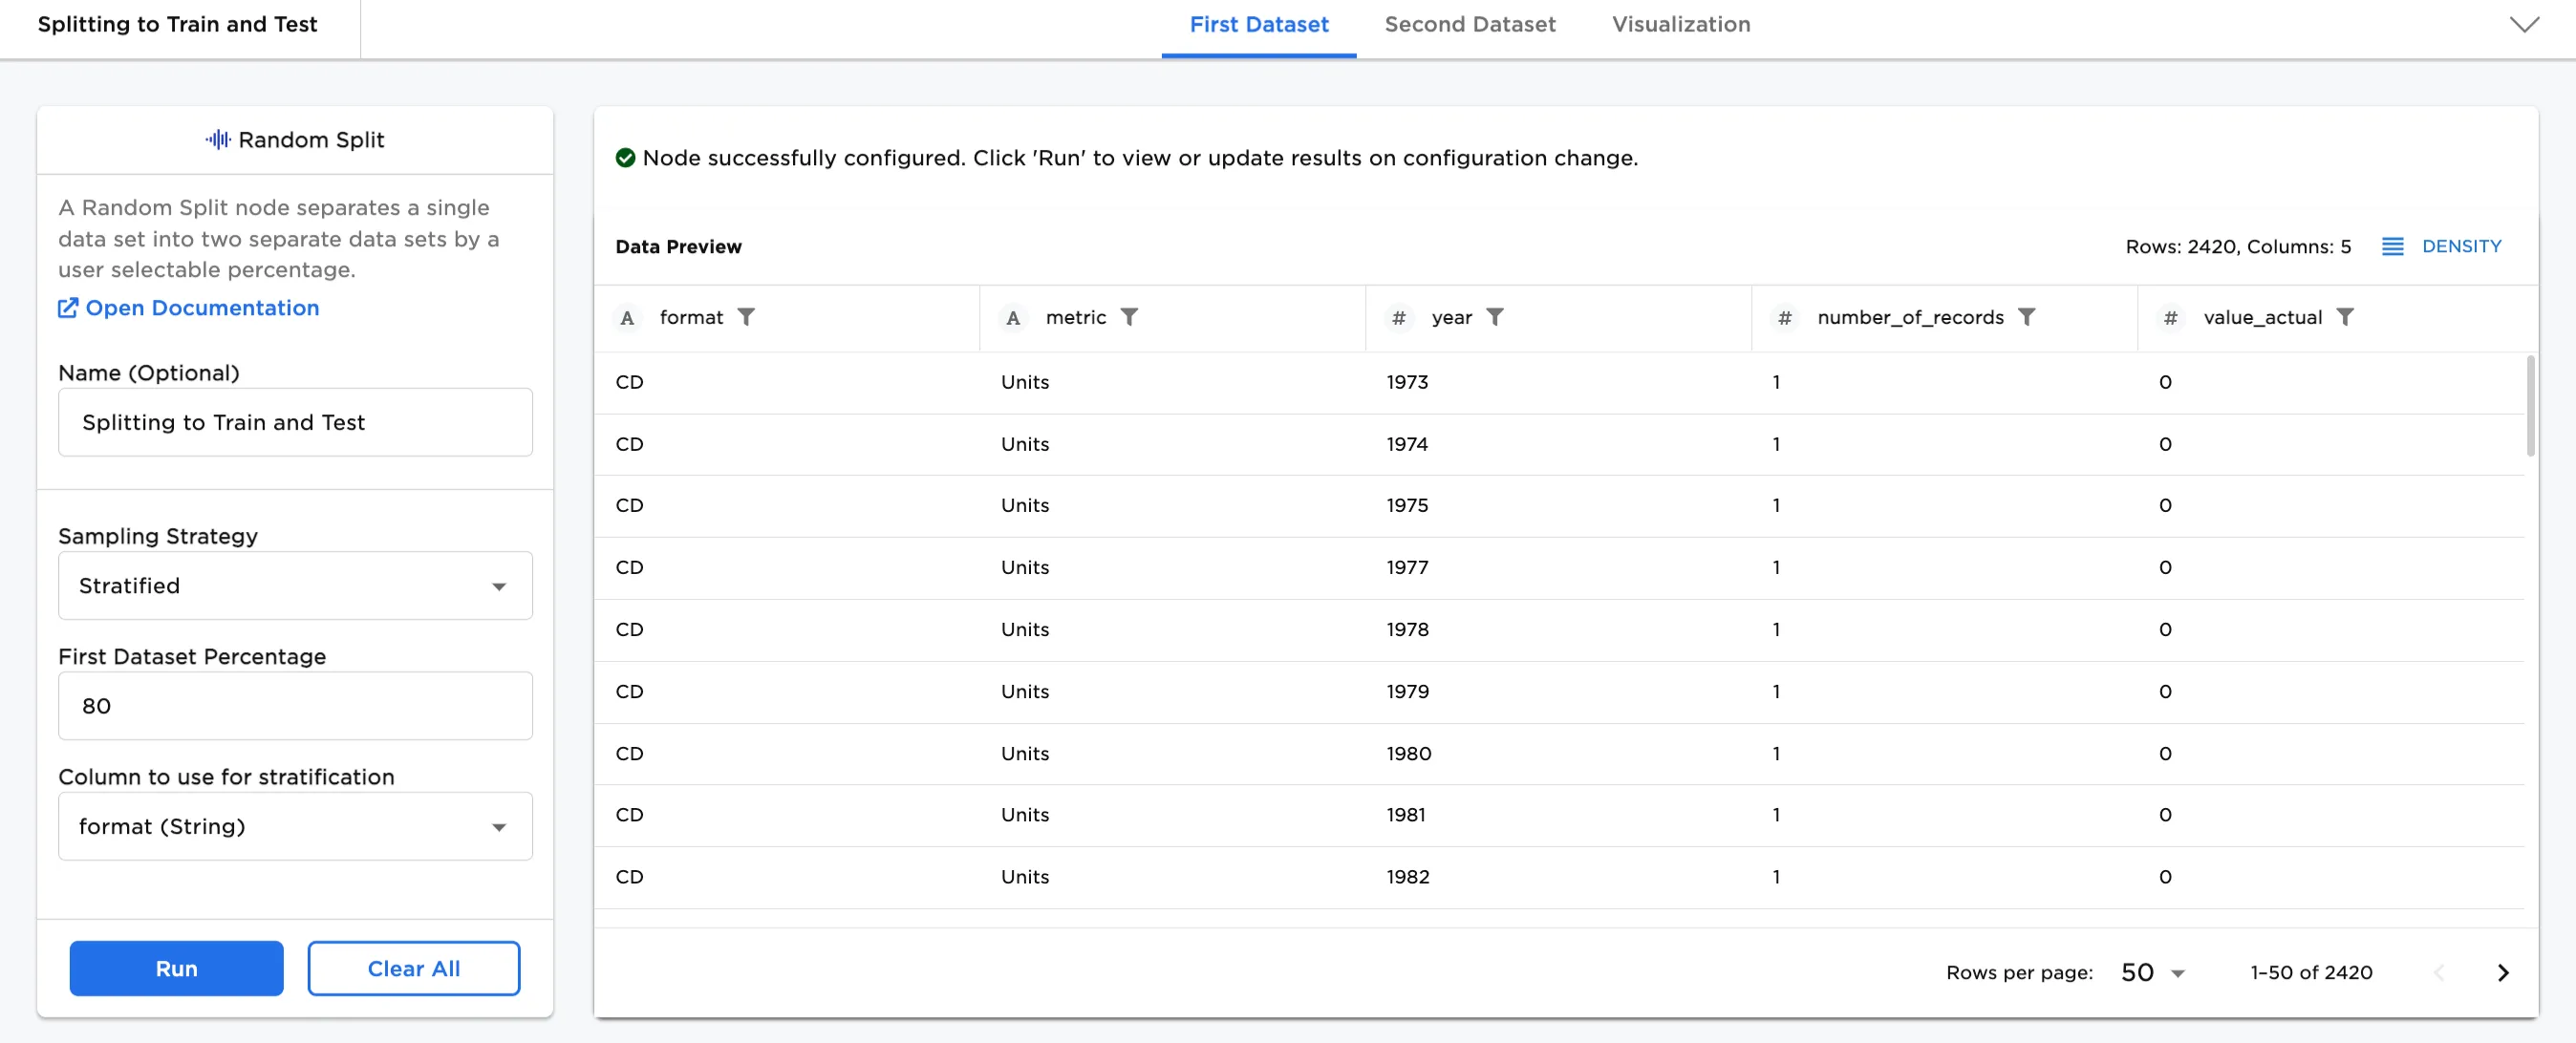 Figure 3b. Example Stratified, 80% in the First Dataset
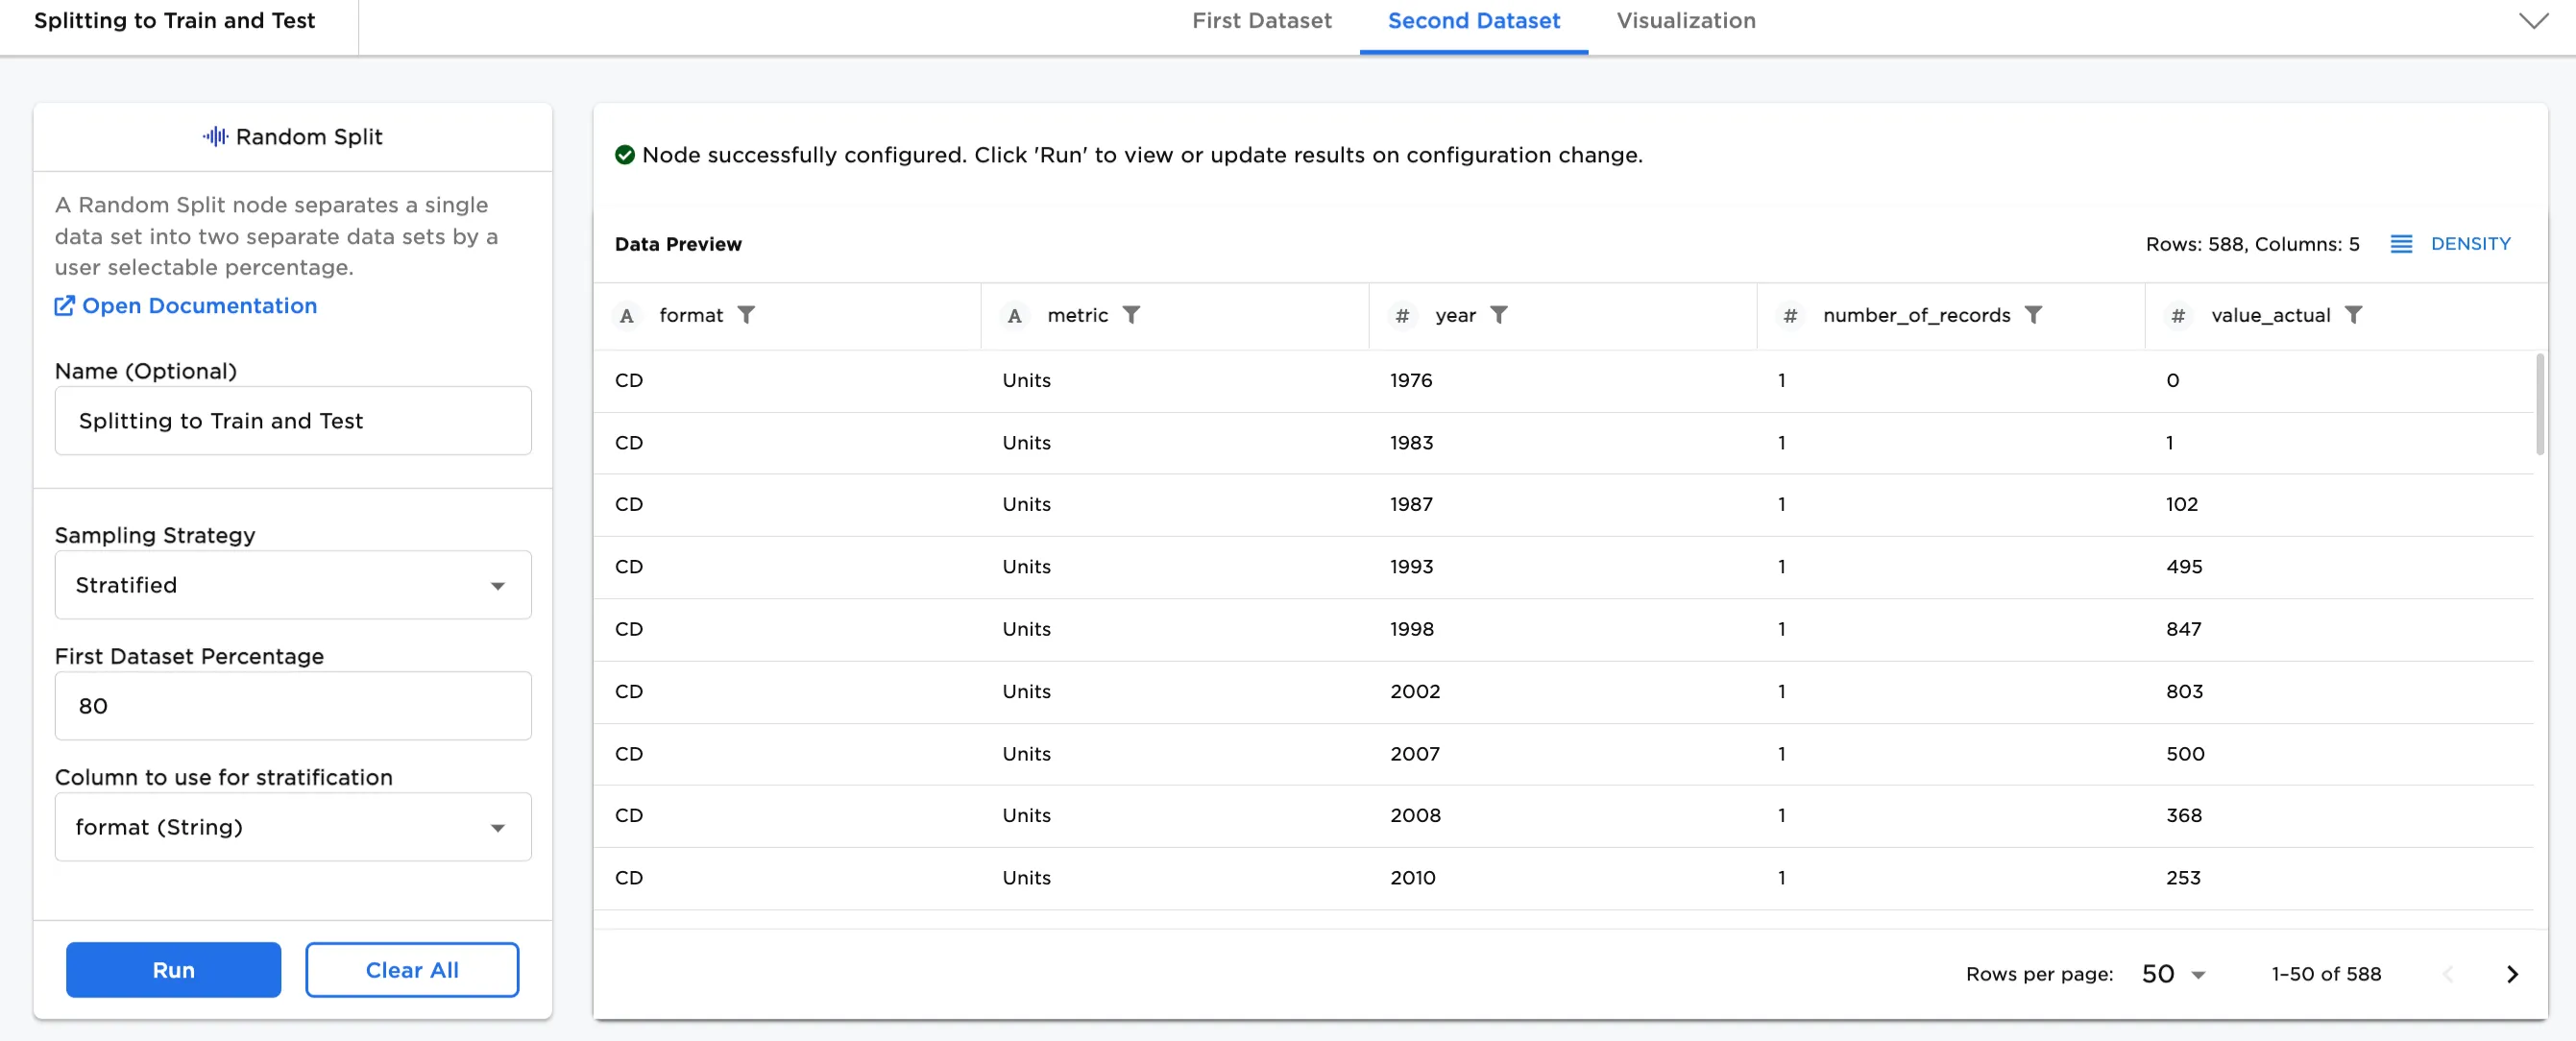 Figure 3c. Example Stratified, 20% in the Second Dataset
Figure 4 shows the data using Uniform as the Sampling Strategy. This sampling strategy is a random split of the data, which means there is no column selected for the 80%/20% split. Uniform (random) is generally used to split the dataset regardless of column. The format column selected in Figures 3a, 3b, and 3c is not used in this sampling strategy. The split is random, instead.
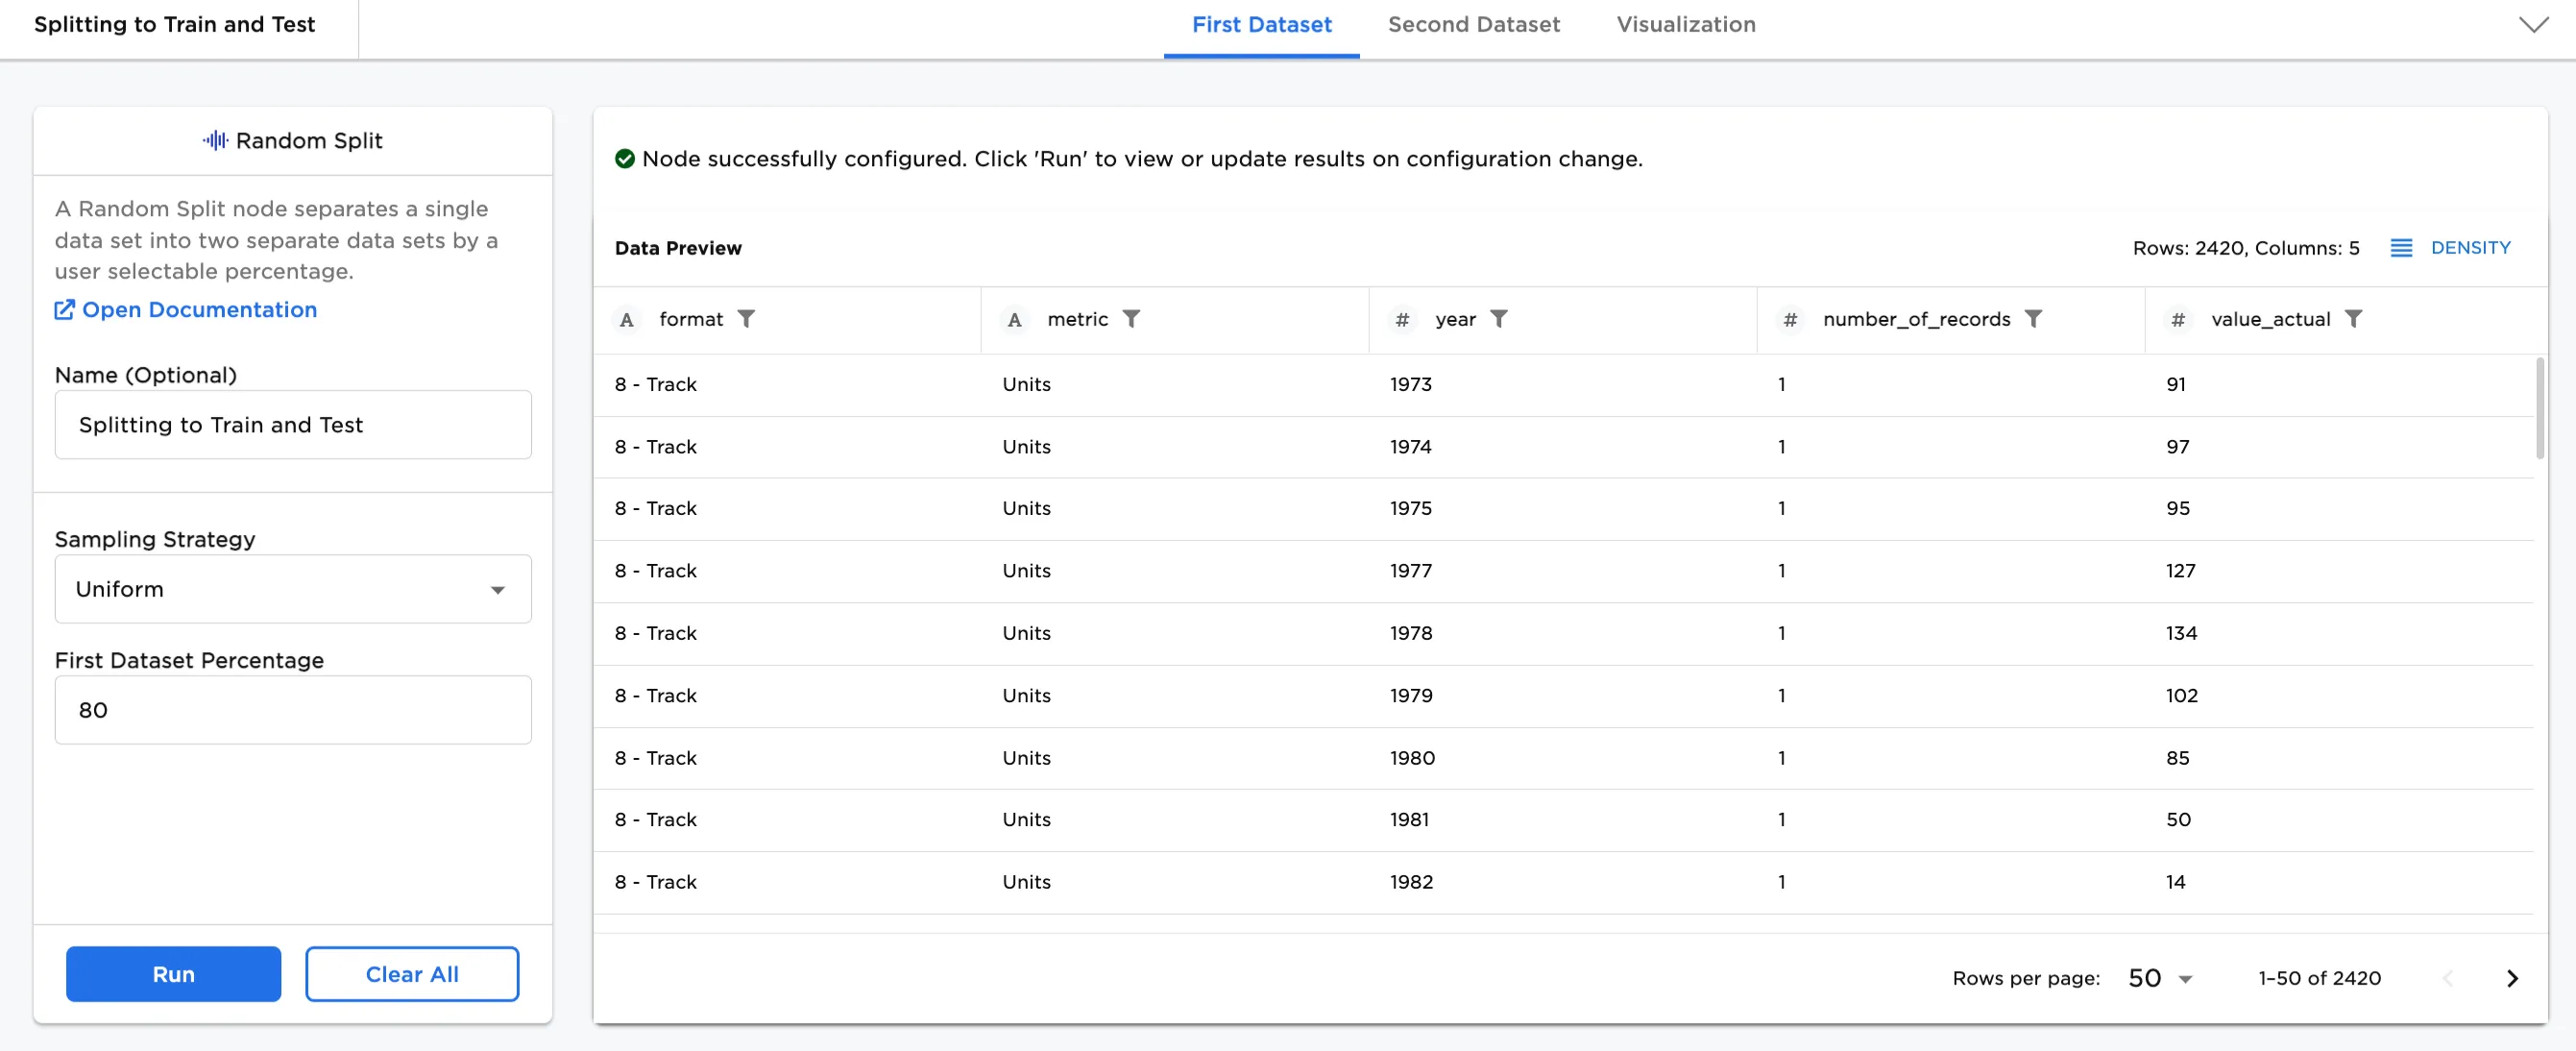
Figure 4: Example uniform (random) split
The next example in Figure 5a to 5d shows Rebalanced as the Sampling Strategy. This is an effective tool to use when there is an imbalance in the datasets (overrepresentation or underrepresentation within a column and each label). Earlier, in Figures 3a, 3b, and 3c, the format (String) was selected as the Column to use for stratification. After this, in Figure 4, the dataset was split randomly (Uniform). The column for format string shows that there isn't an imbalance in the data on that column. For this example, we select the column that is imbalanced, value_actual (Integer).
To understand this imbalance, compare Figure 5a and 5b. Returning to the CSV node, and clicking on first the format column and scrolling down to the Unique Values section, Figure 5a shows the spread by format (String) is close to equal in the dataset--there happen to be 141 of each type of format. Whereas, selecting the value_actual column and scrolling to the Unique Values section, Figure 5b shows the spread by value_actual (Integer) to be imbalanced--there is much more variation in unique values.
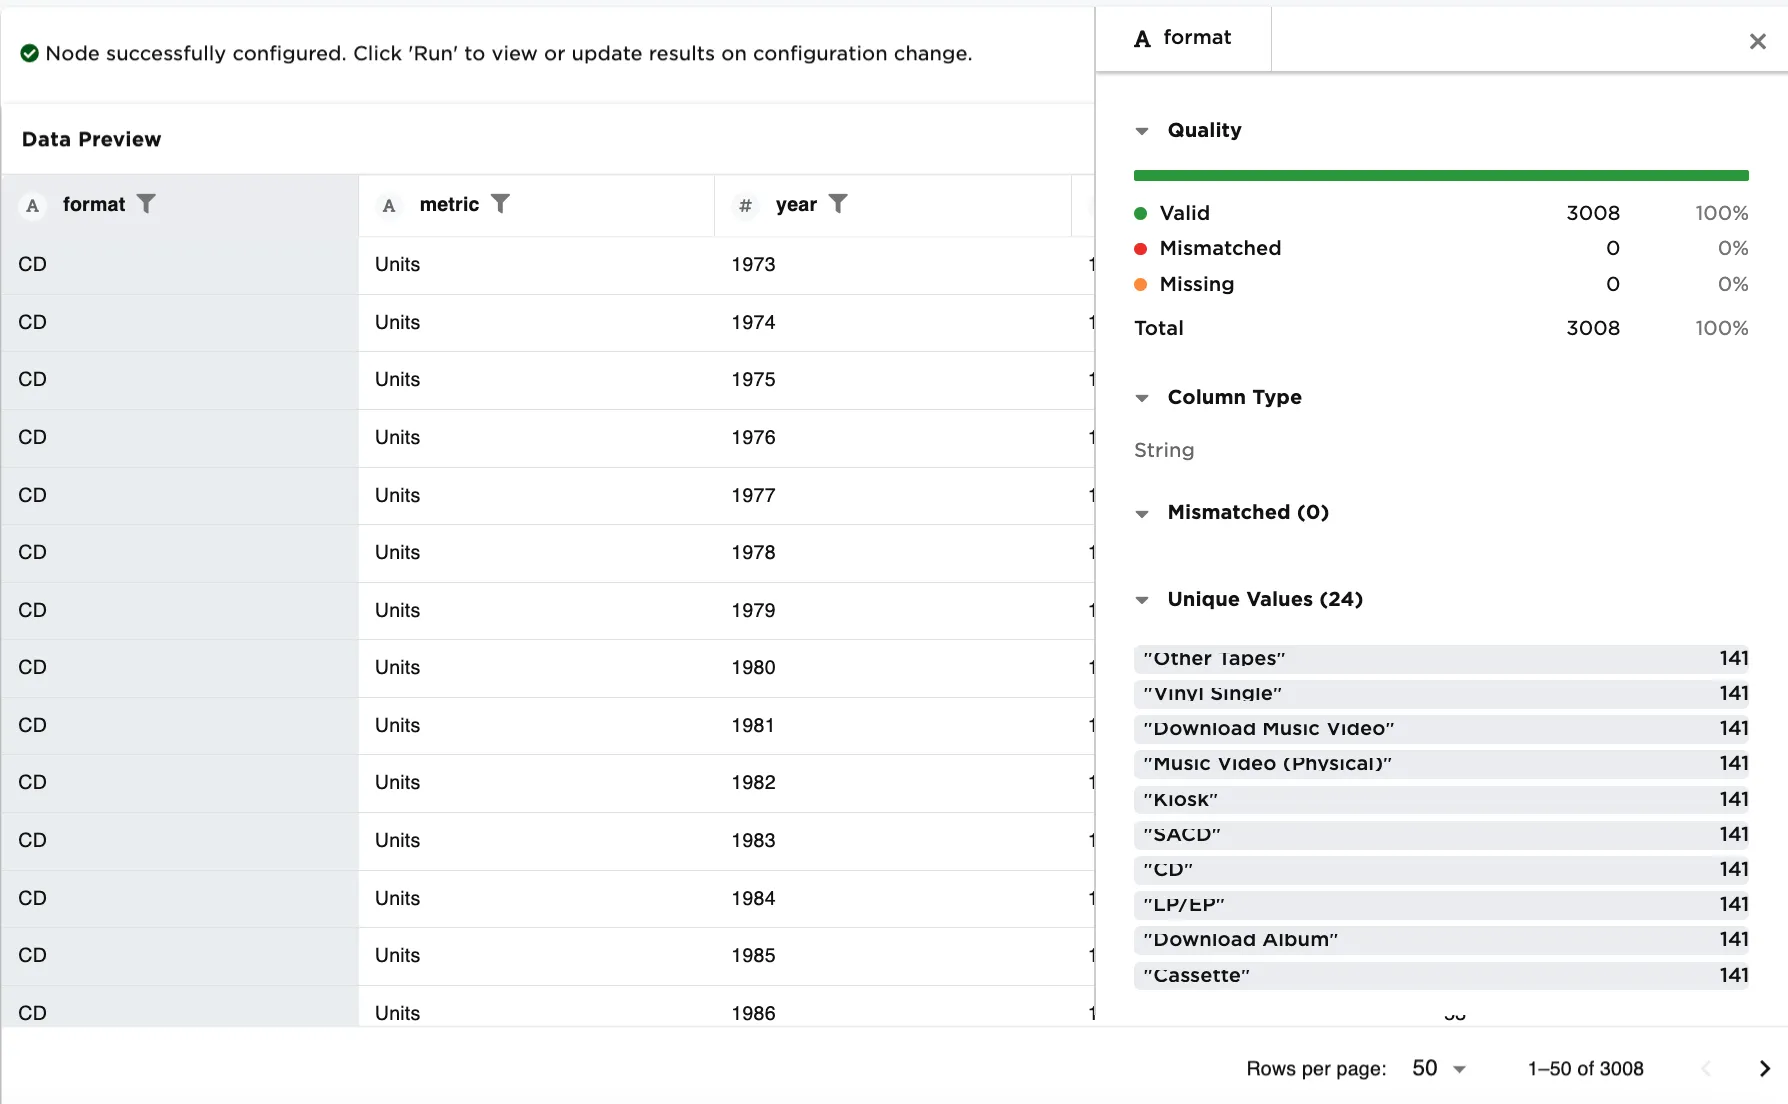 Figure 5a. Example no imbalance in the column data
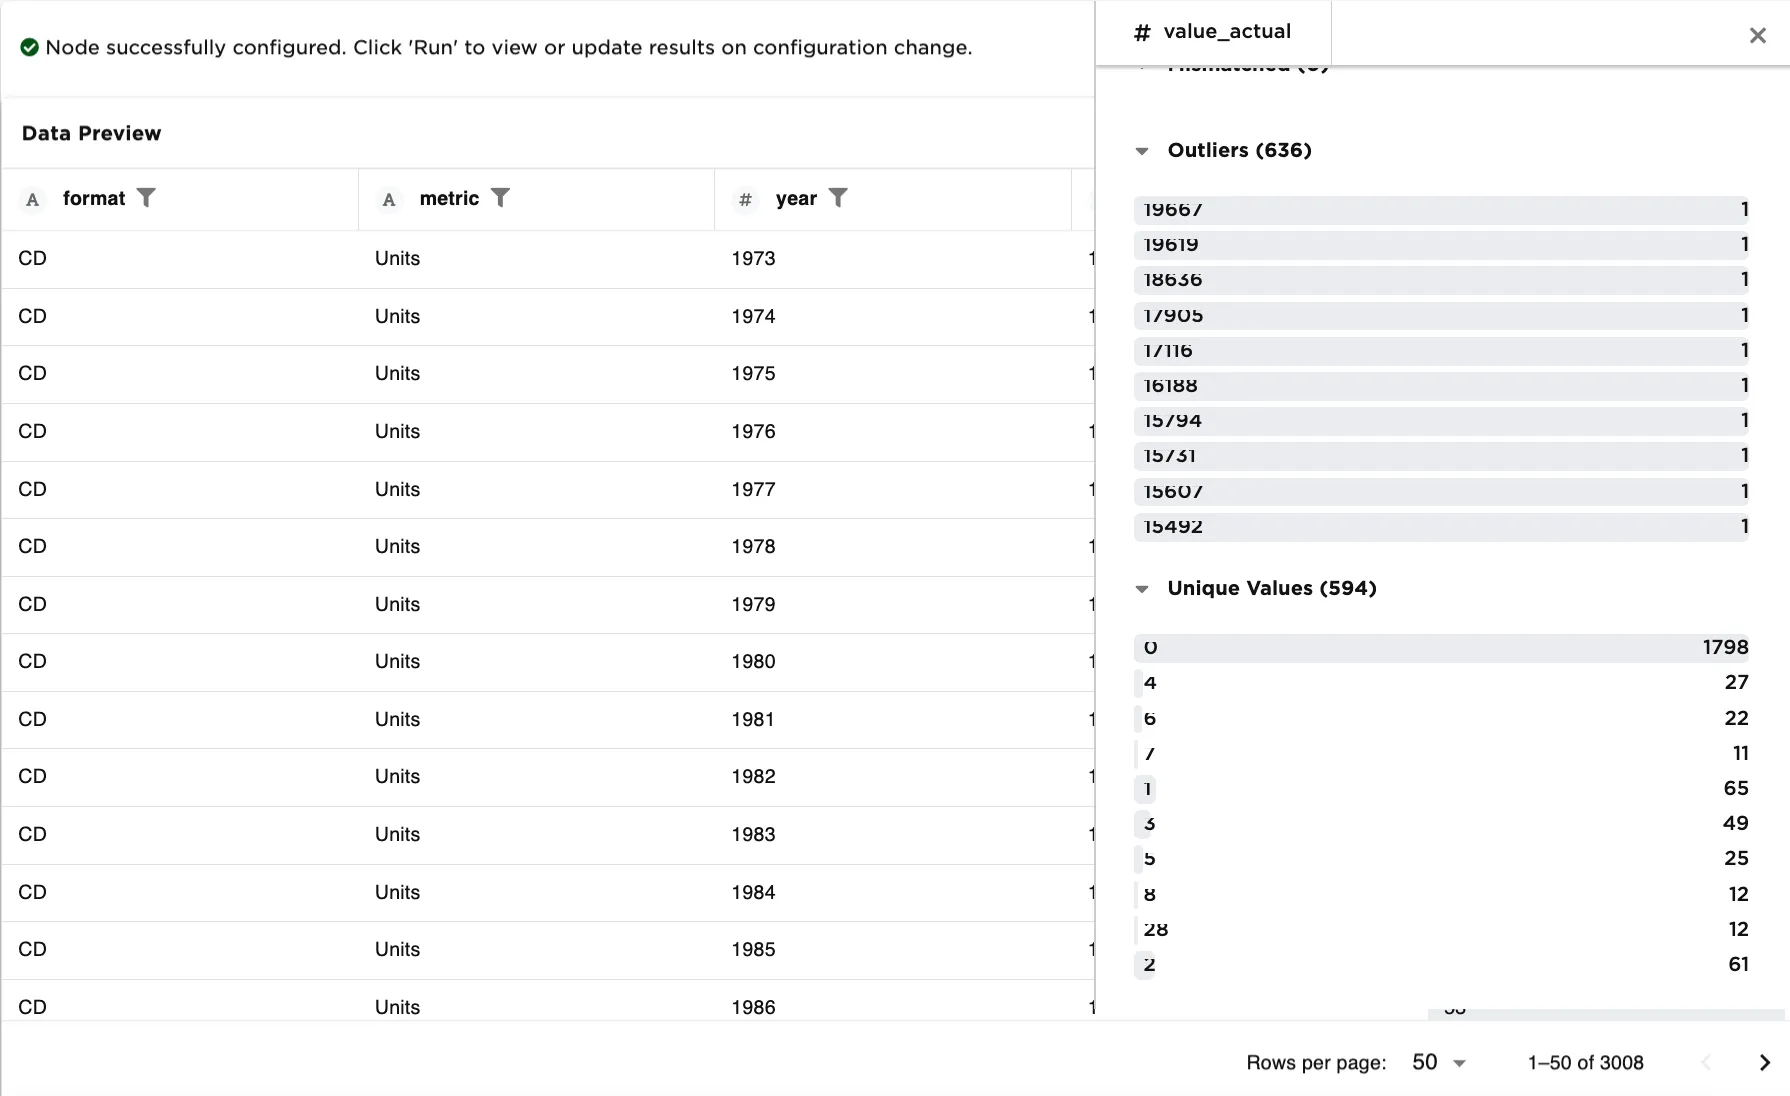 Figure 5b. Example with imbalance in the column data
Returning to the Random Split node, to rebalance the dataset on the value_actual (Integer) column, select Rebalanced as the Sampling Strategy and select the value_actual (Integer) column. In Figures 5c an 5d, the dataset is rebalanced on the value_actual (Integer) column. Select the value_actual column in both the first and second dataset and view the Unique Values section.
The First Dataset in Figure 5c shows roughly 3 of each value_actual. The Second Dataset in Figure 5d still shows variation in the column. After rebalancing the dataset, the First Dataset for training is more uniform.
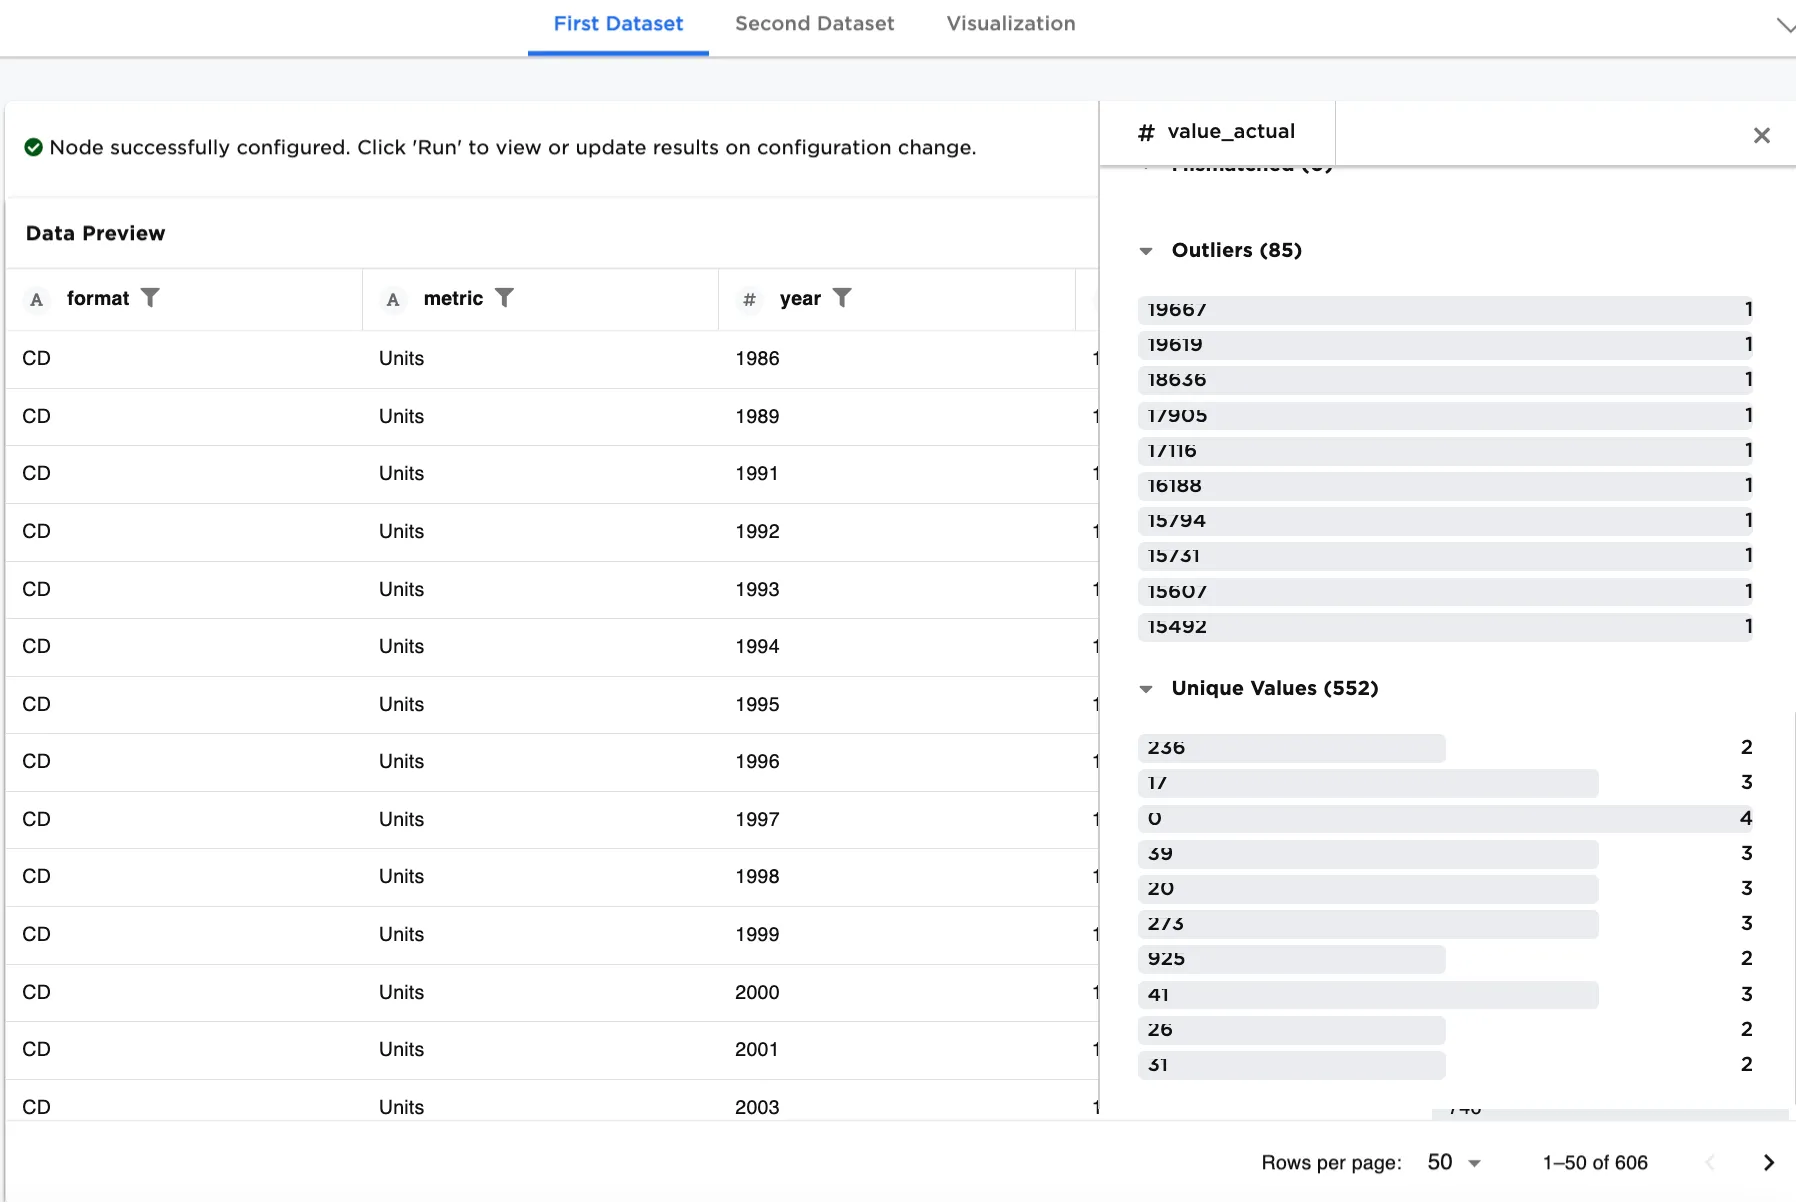 Figure 5c. Example rebalanced First Dataset for training
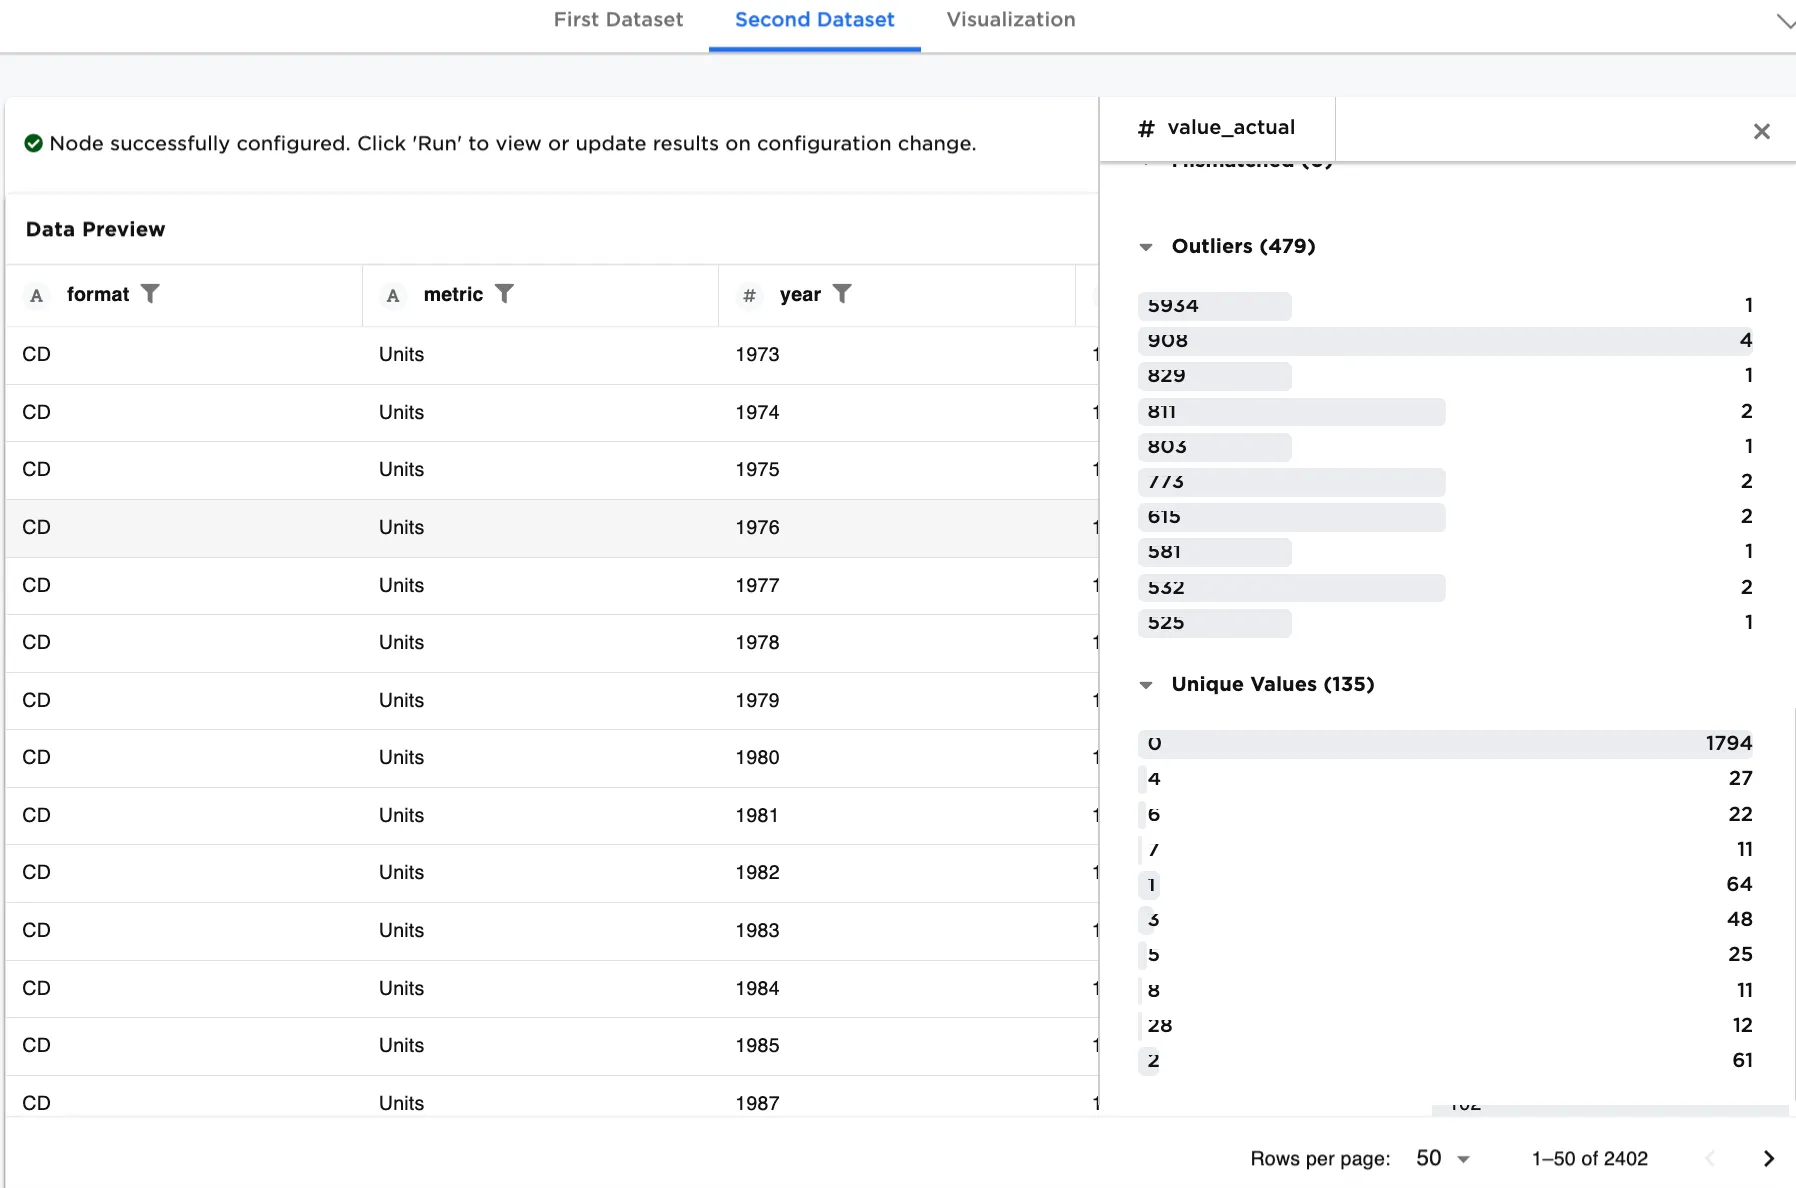 Figure 5d. Example of Second Dataset for testing