Limit
Set the maximum number of rows in a dataset in Visual Notebooks.
Configuration
| Field | Description |
|---|---|
| Name default=none | Field to name the chart |
| An optional user-specified node name displayed in the workspace, both on the node and in the dataframe as a tab. | |
Limit default=1000 | Number of rows |
| Set the number of rows to be included in the output dataset. |
Node Inputs/Outputs
| Input | A dataset from a preceding node. |
|---|---|
| Output | A dataset containing the specified number of rows. |
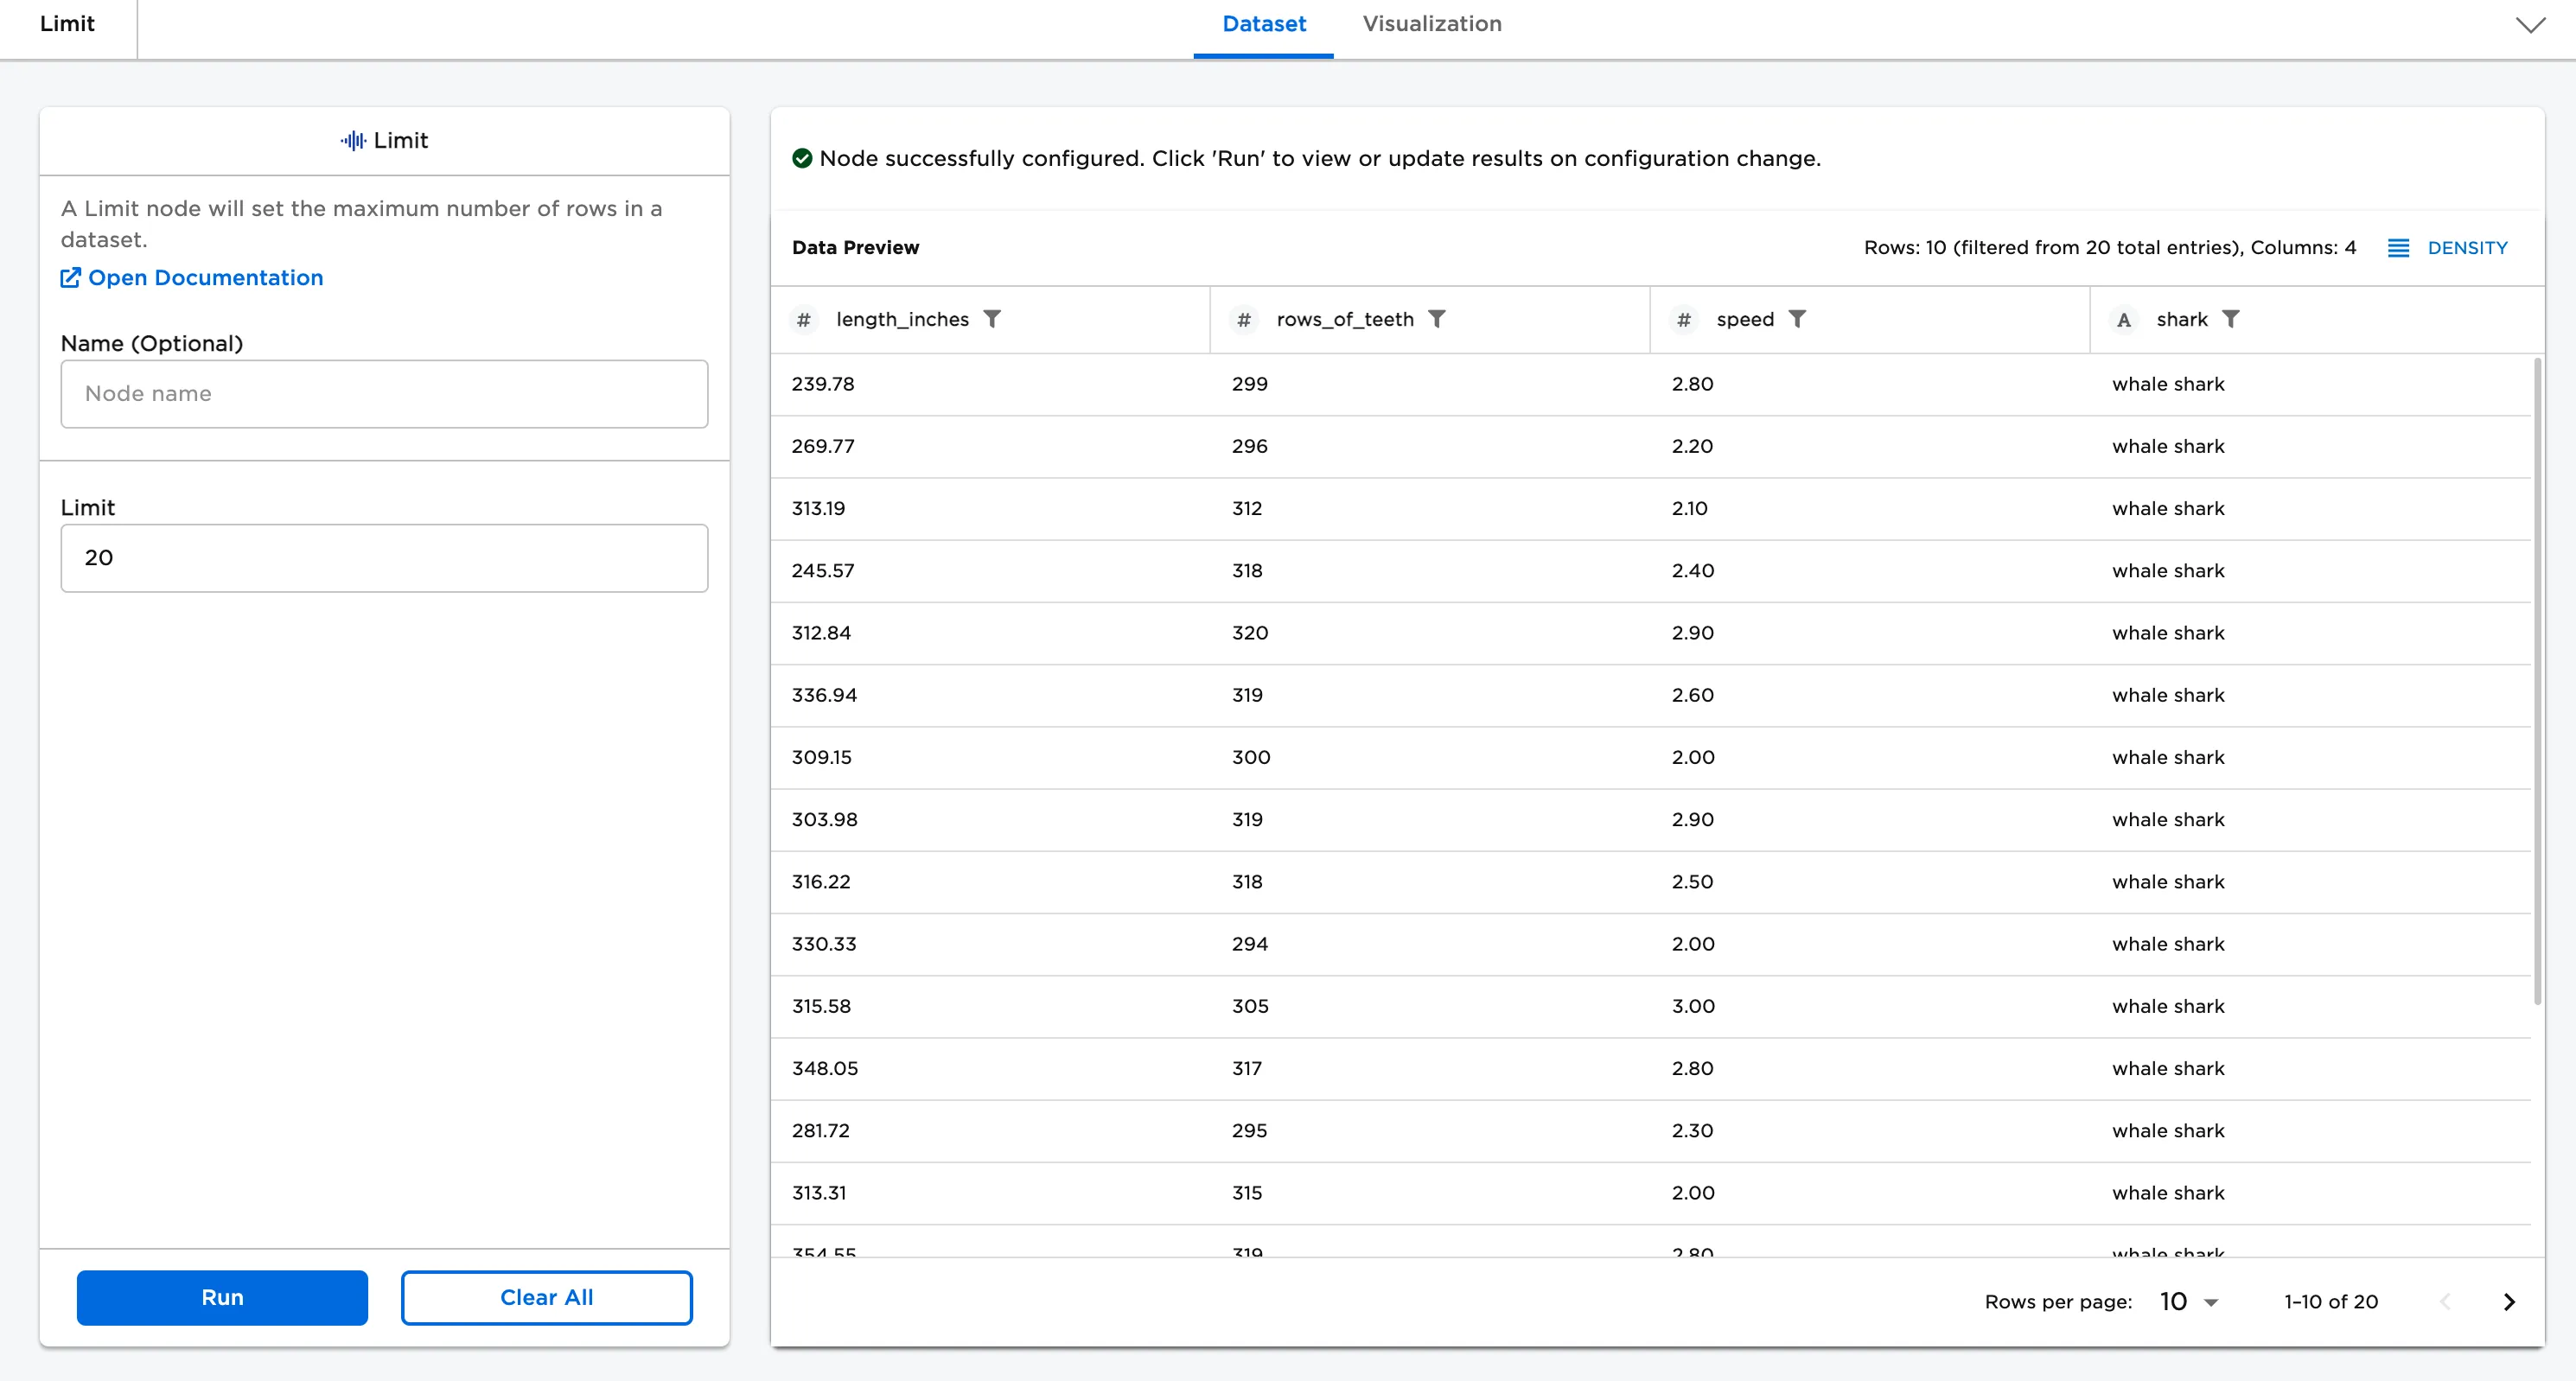
Figure 1: Example output
Examples
The input data used in this example contains 700 rows of information about sharks.
The dataframe shown in Figure 2 is used in this example. Use the Limit node to specify the desired number of rows that are shown.
First, run the node with the default settings:
- Connect the Limit node to an existing node. In this case, it has been connected to the example CSV, sharks.csv.
- Select the Limit node to configure it.
- For the Limit, enter the number of rows desired to be shown. For example, in Figure 2 "20" is entered in order to showcase 20 rows of data.
- Select Run.
Figure 2: Example limit node