Spark Node
Load data from Apache Spark into Visual Notebooks.
Prerequisites
Follow the steps below to add credentials for Spark using Databricks.
- Sign into Databricks
- Hover over left-hand navigation menu, select the Datascience and Engineering workspace, then select Compute
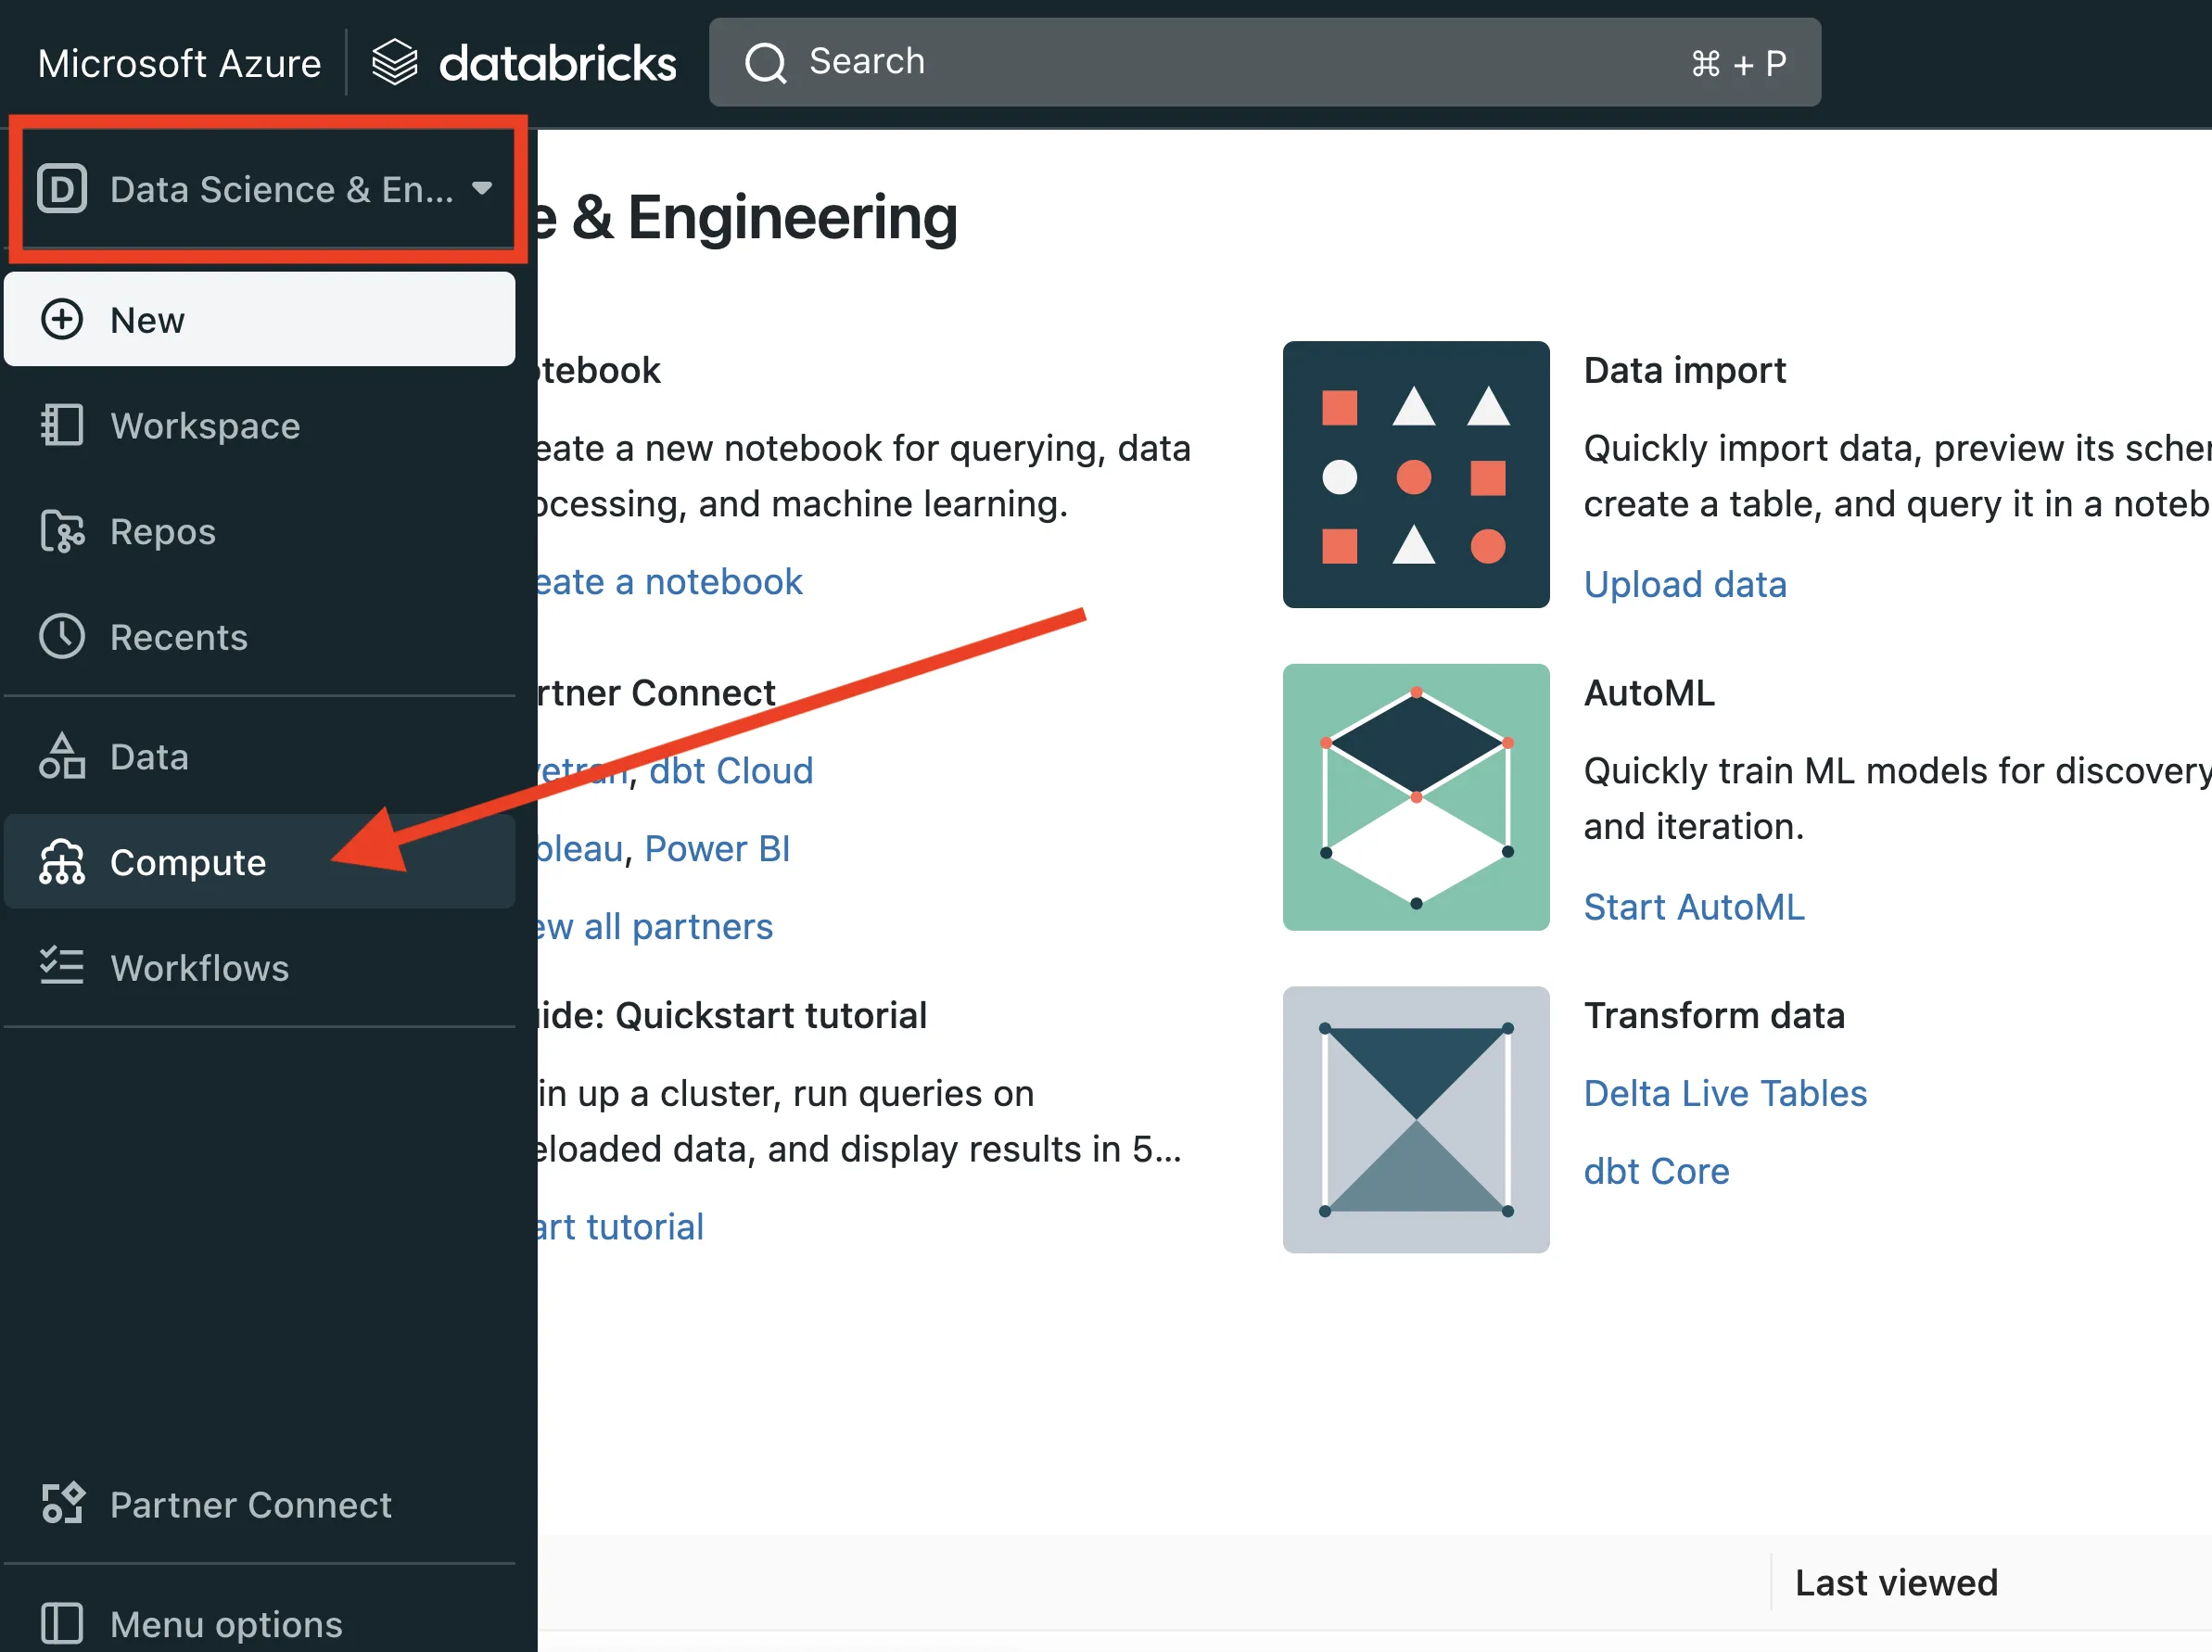
- Select a running cluster
- Scroll to the bottom of the cluster configuration, expand Advanced Options, and click the JDBC/ODBC tab
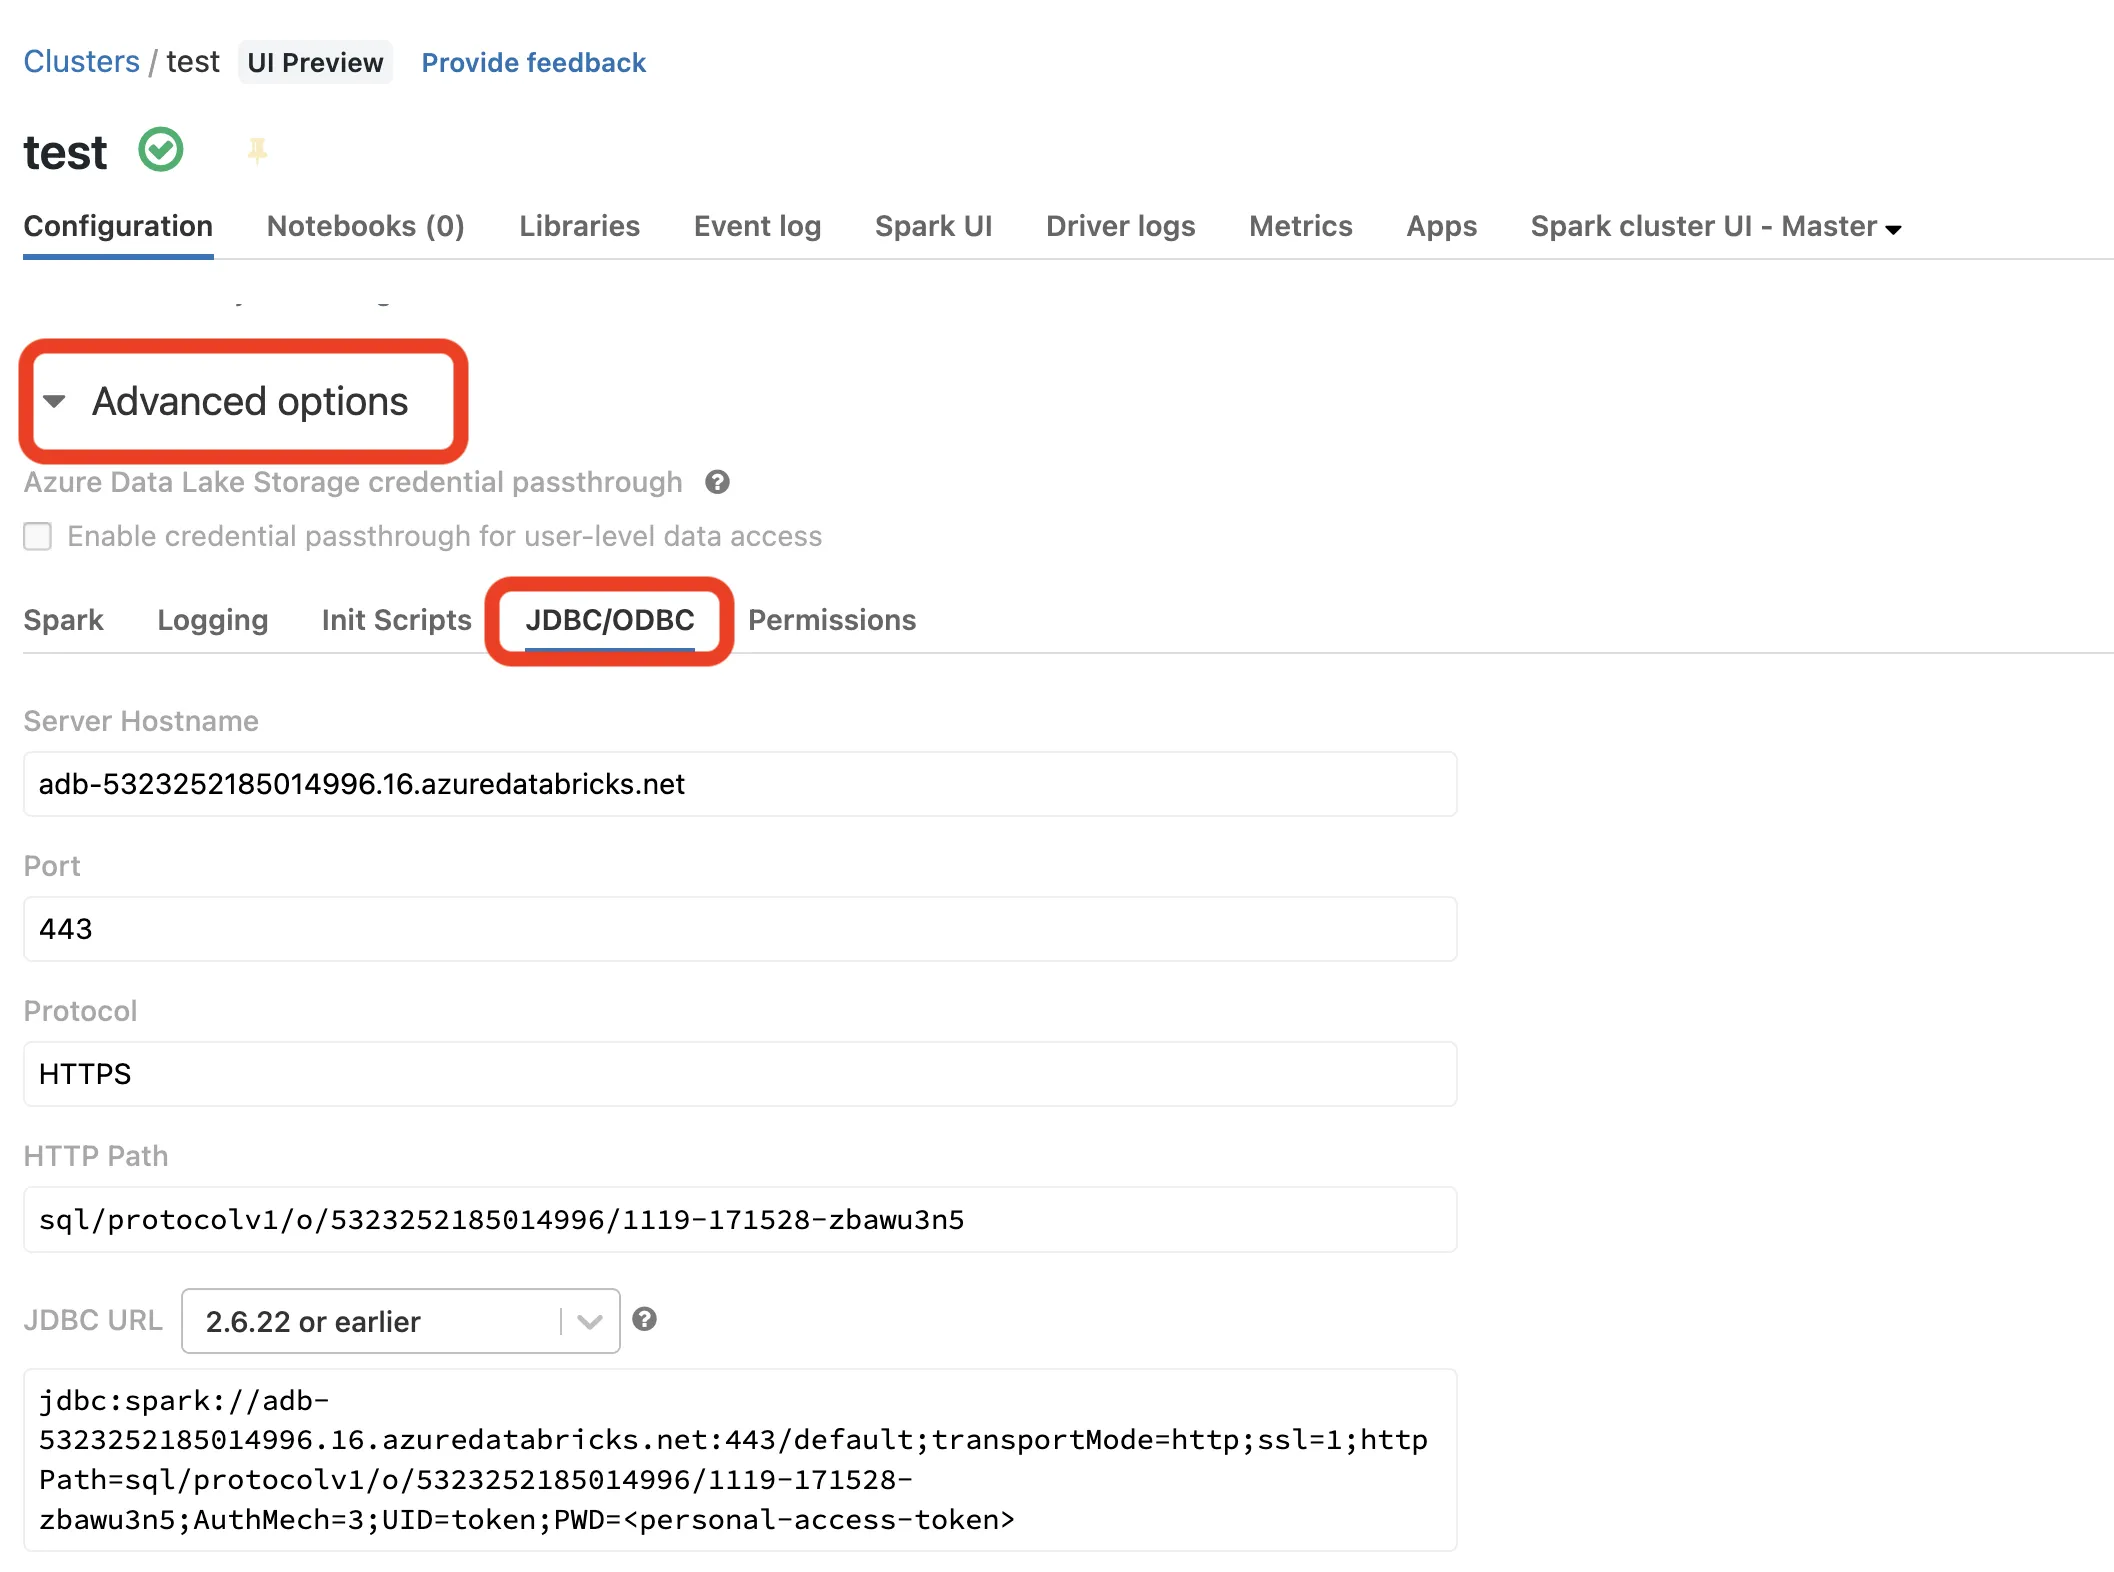
- Copy the values for Server Hostname, Port, and HTTP Path into a notepad
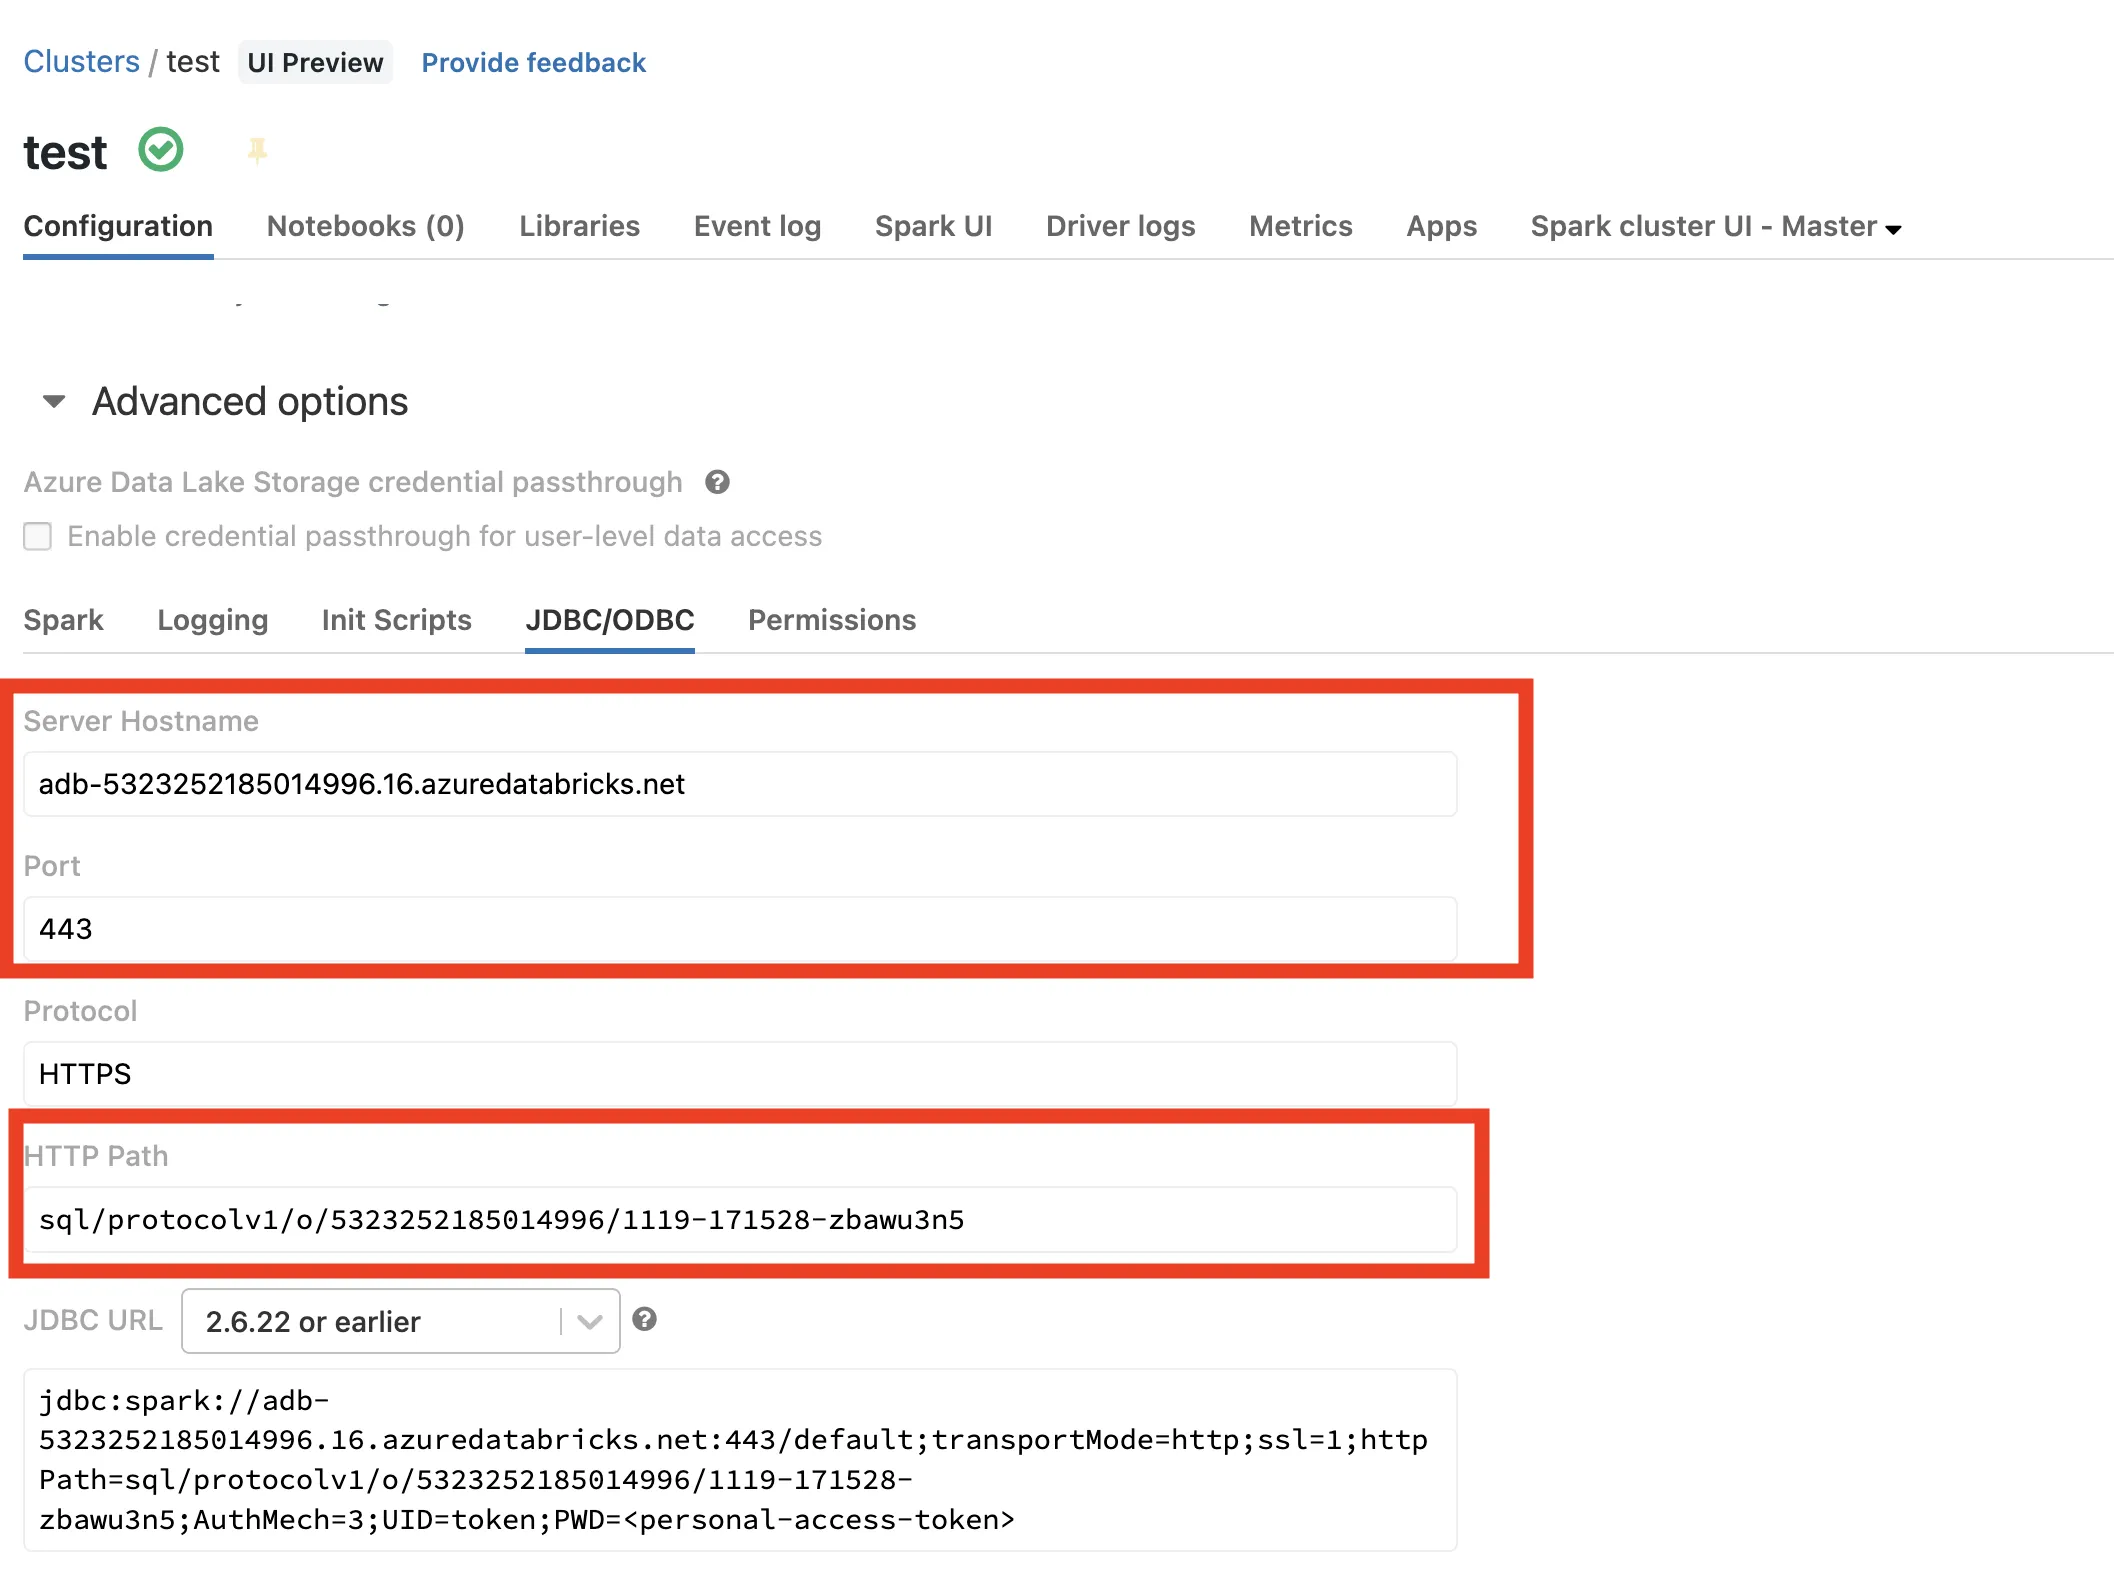
- Click your username in the top right-hand corner and select User Settings
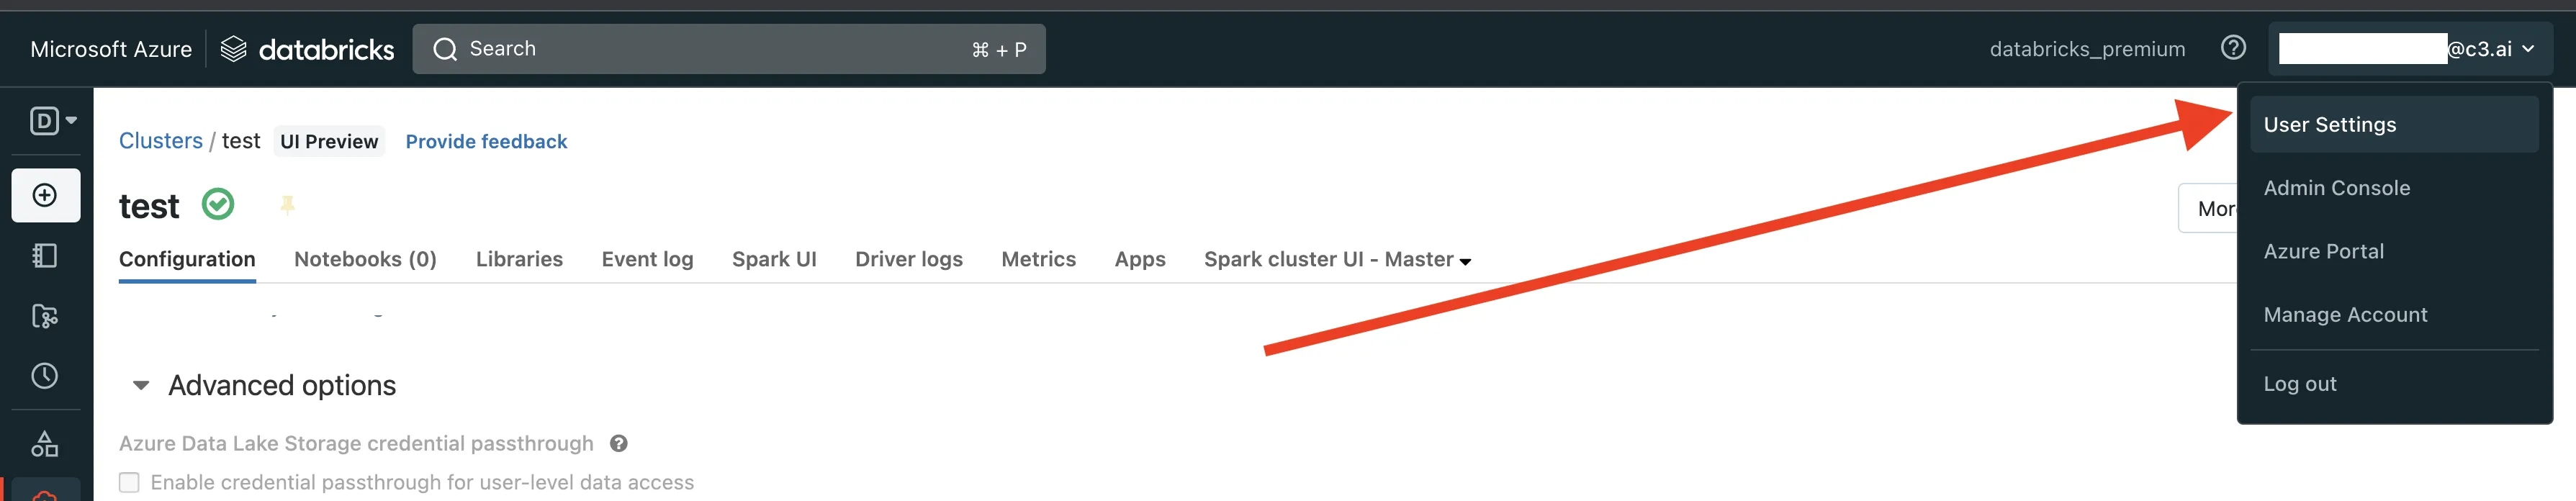
- Select the Access Tokens tab and click Generate new Token
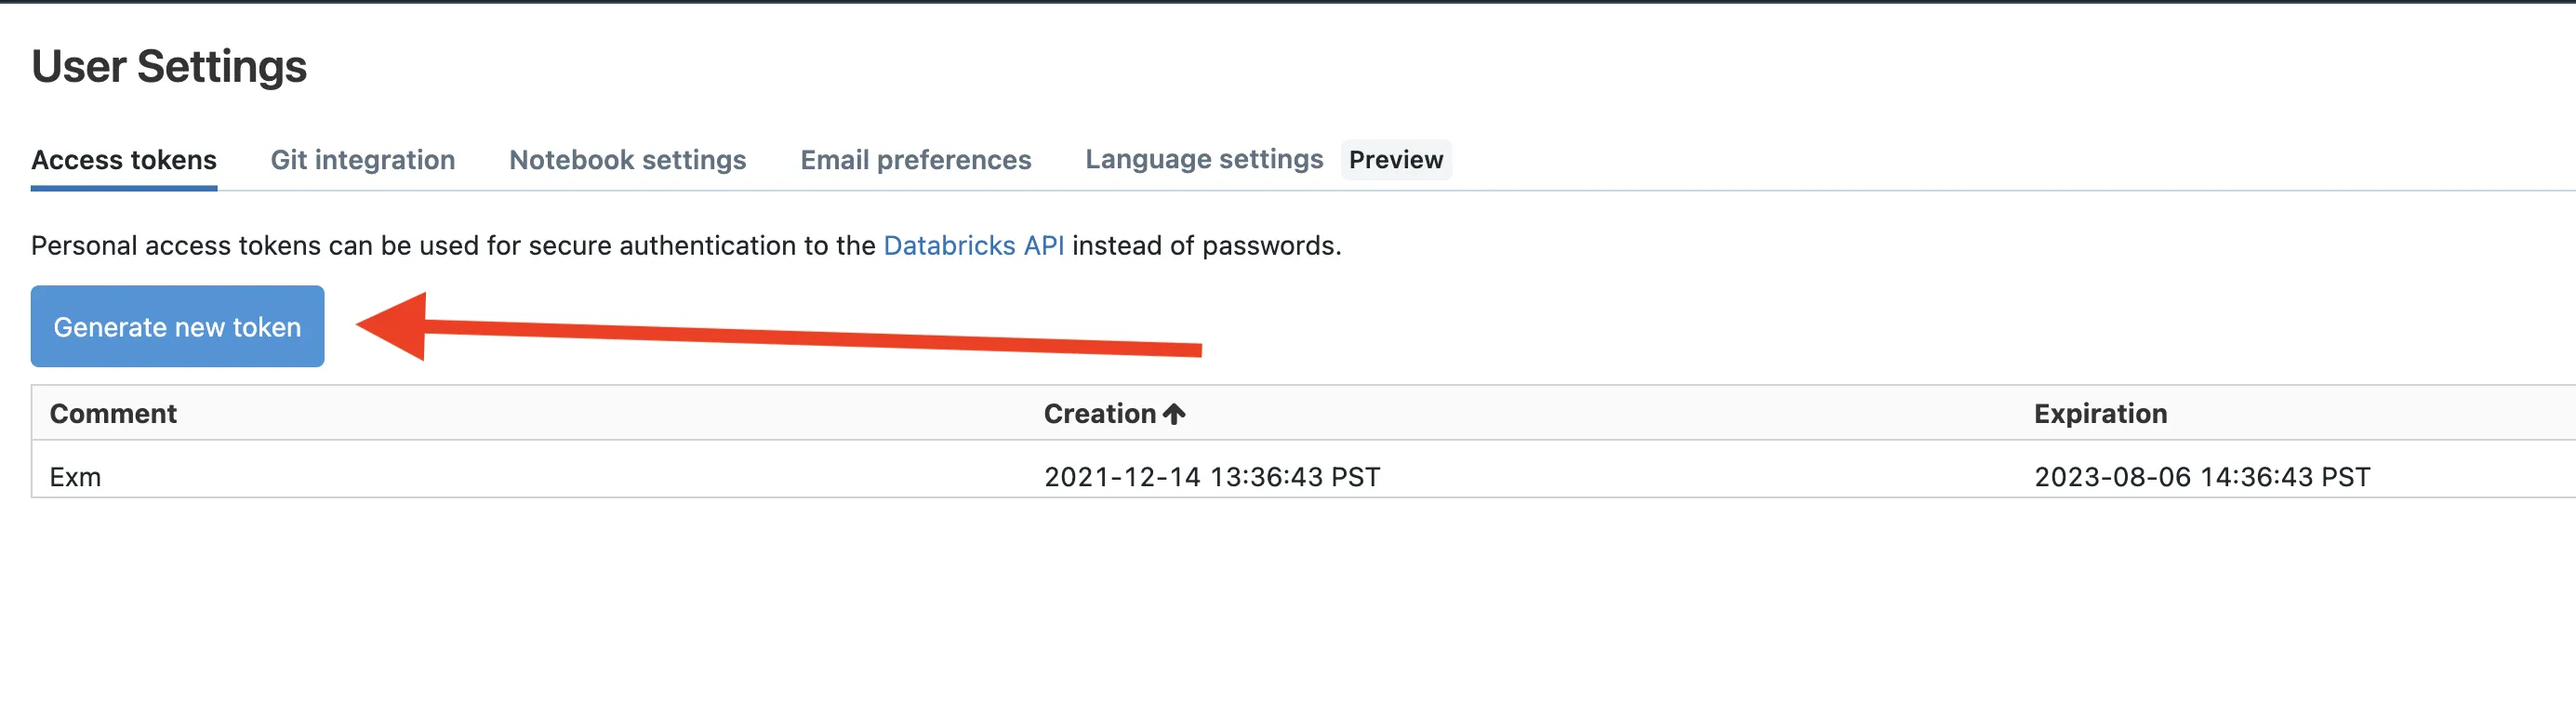
- Copy the token into your notepad
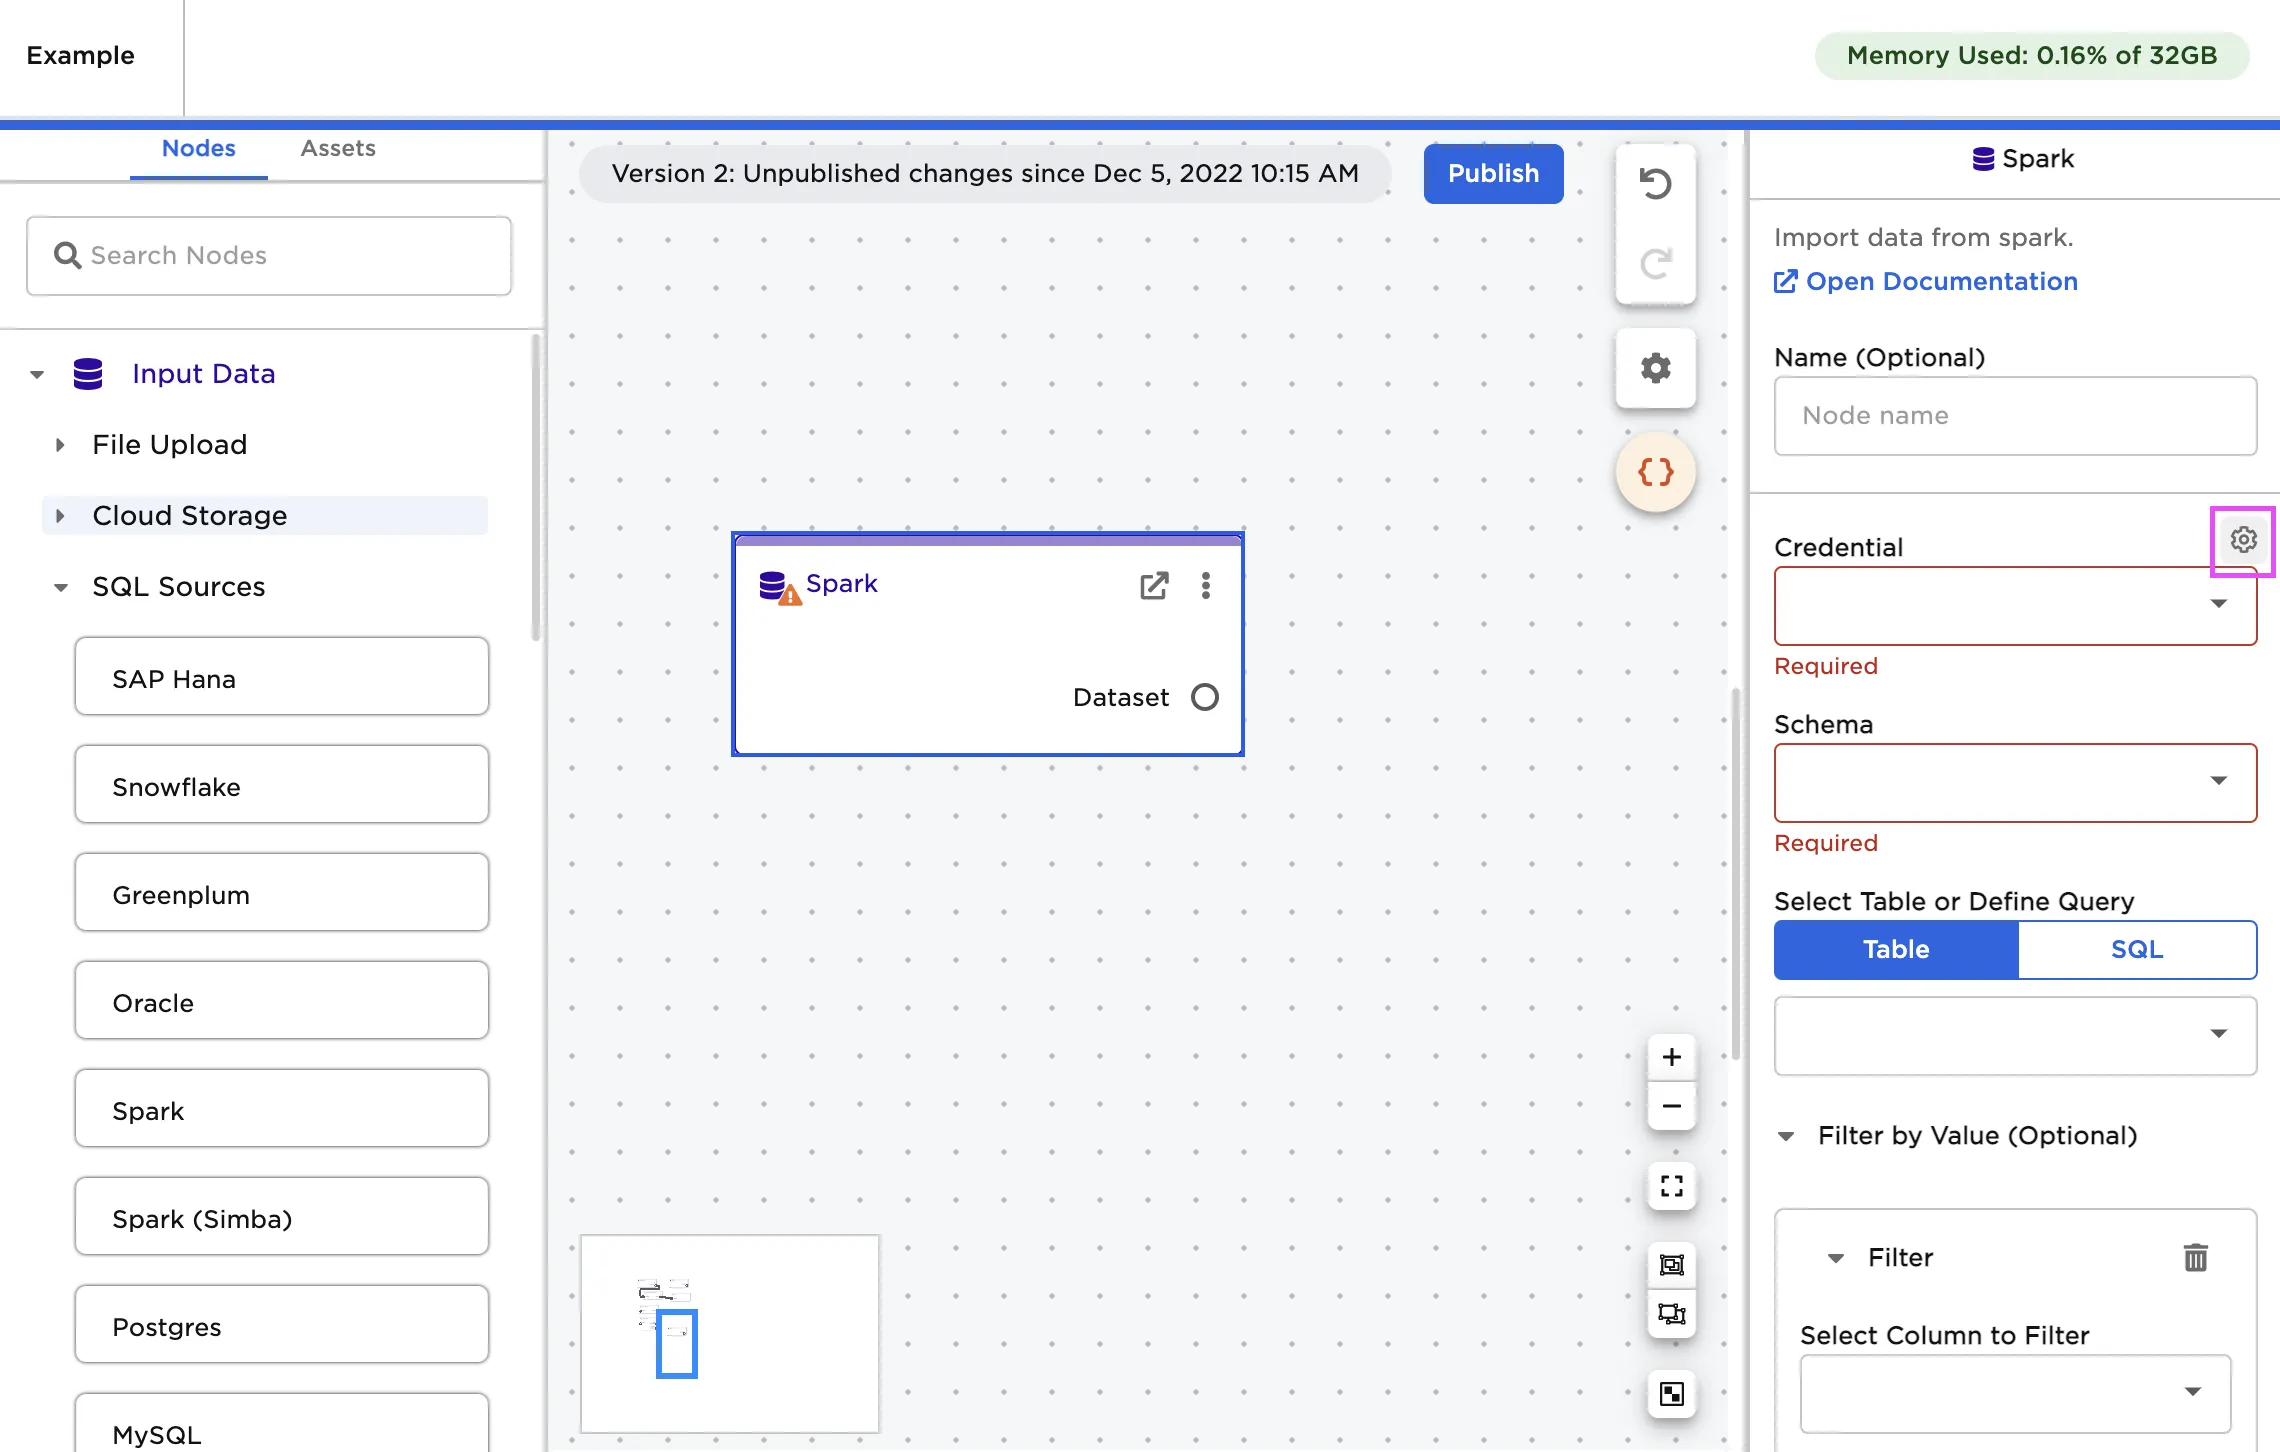
- In Visual Notebooks, drag a Spark node onto the canvas
- Select the gear icon beside the Credential field
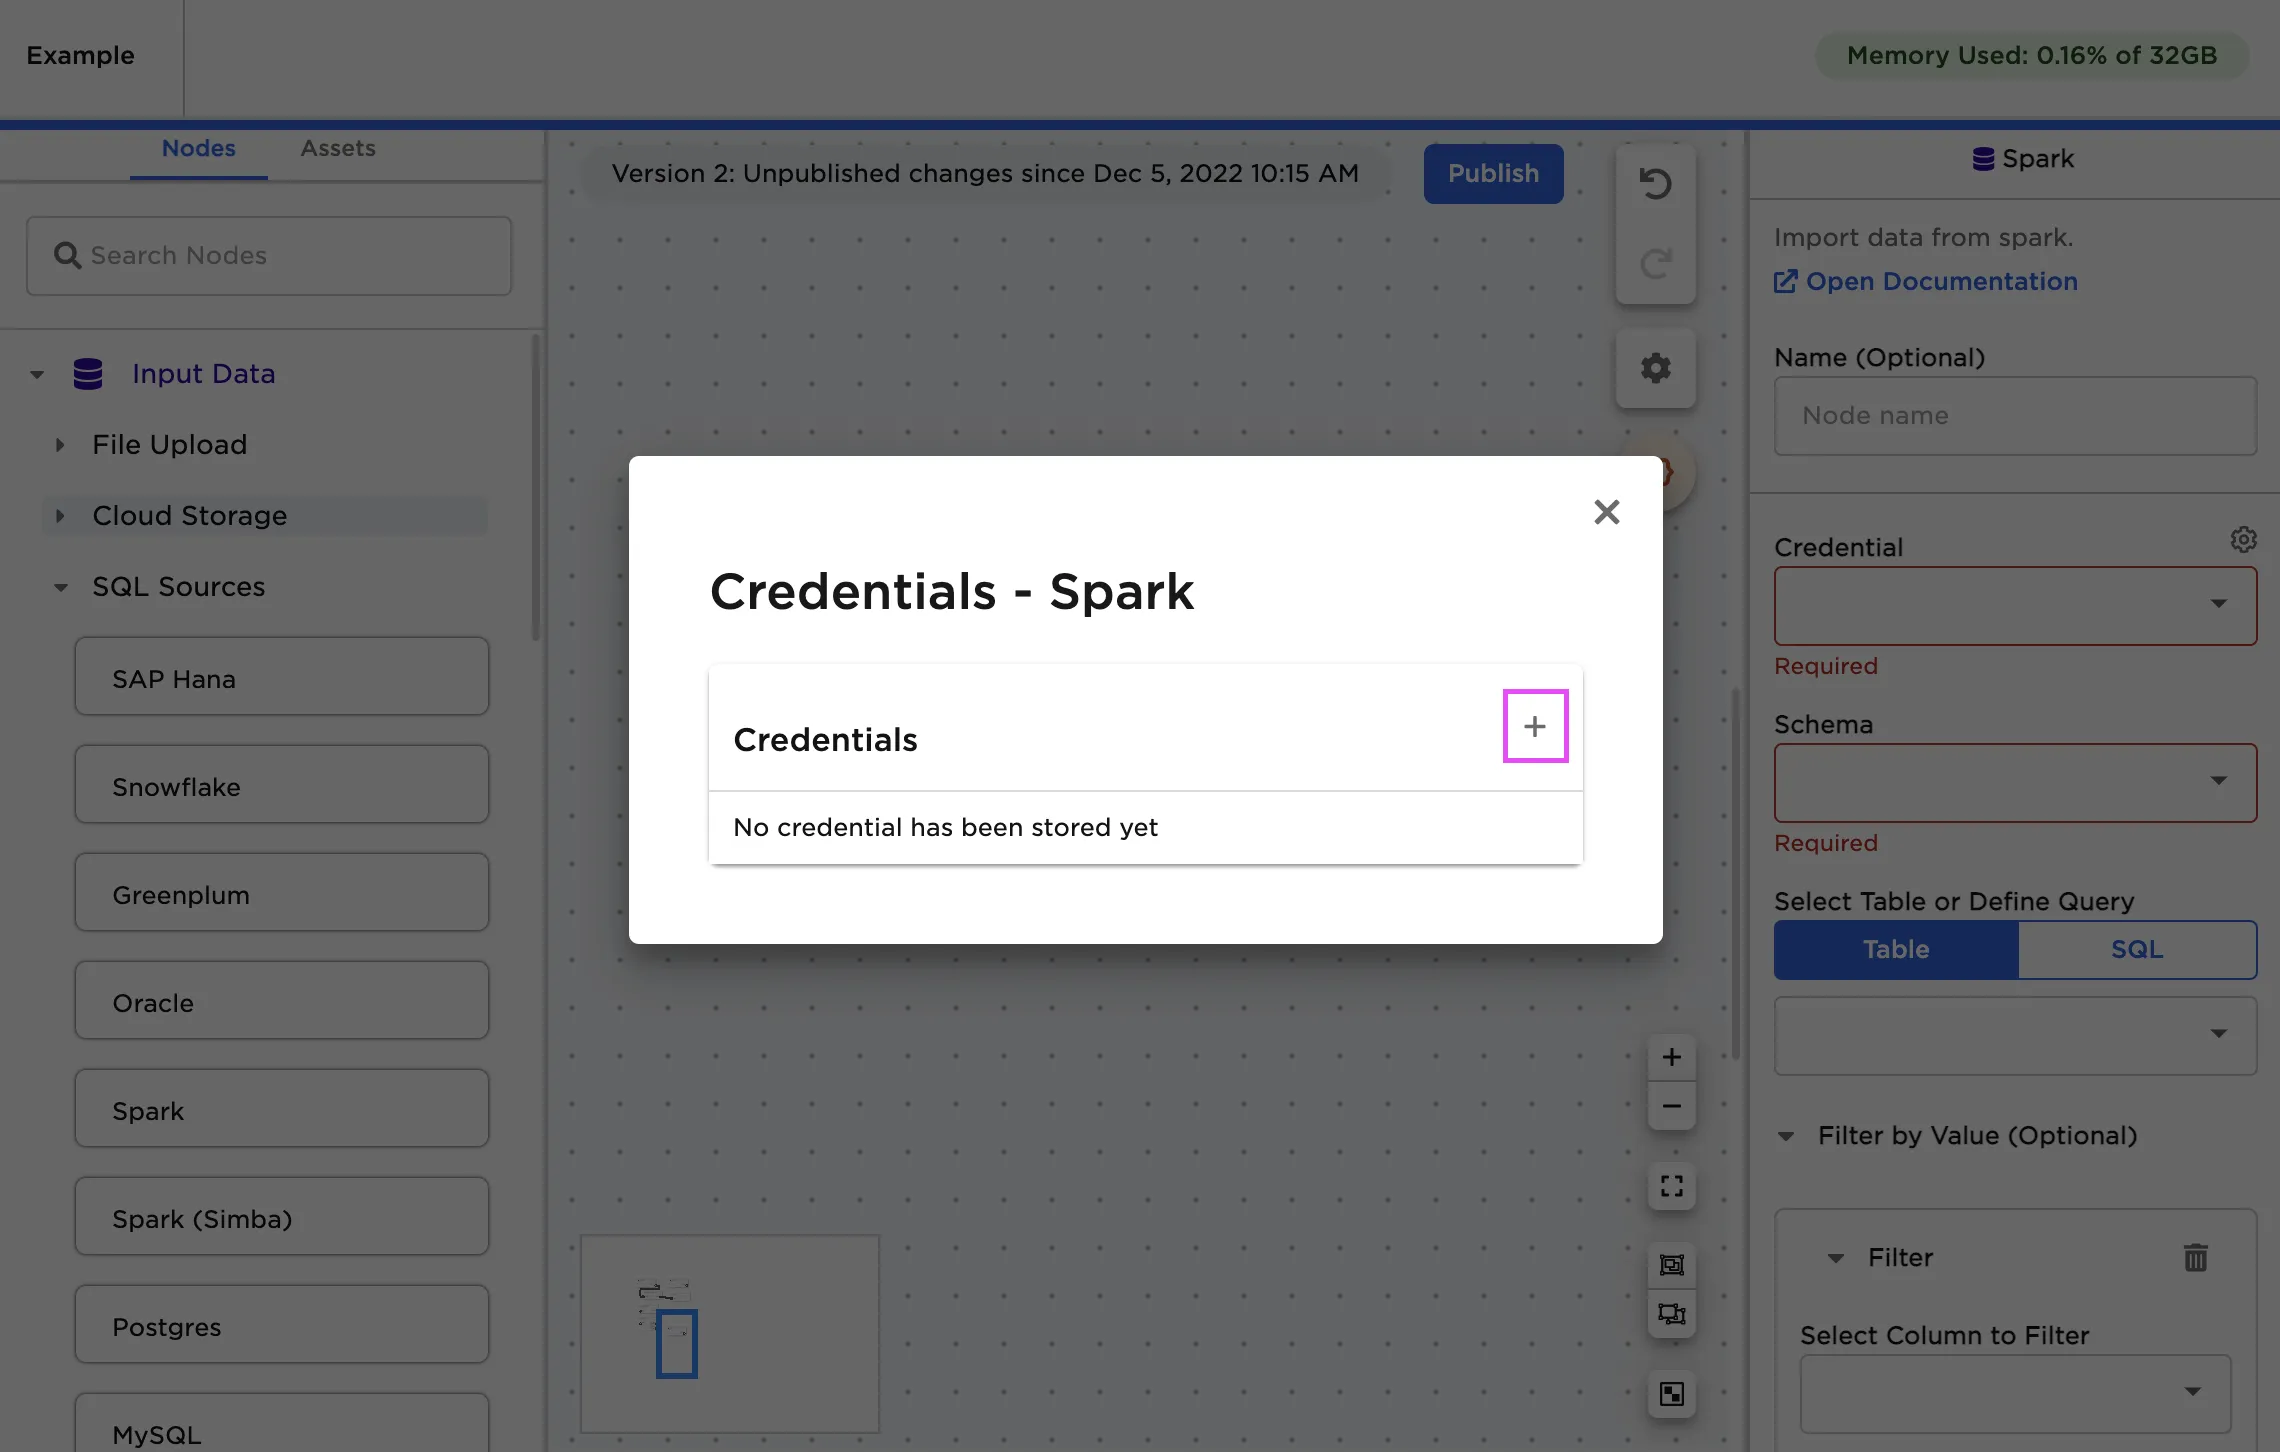
- Select the plus sign in the upper right corner
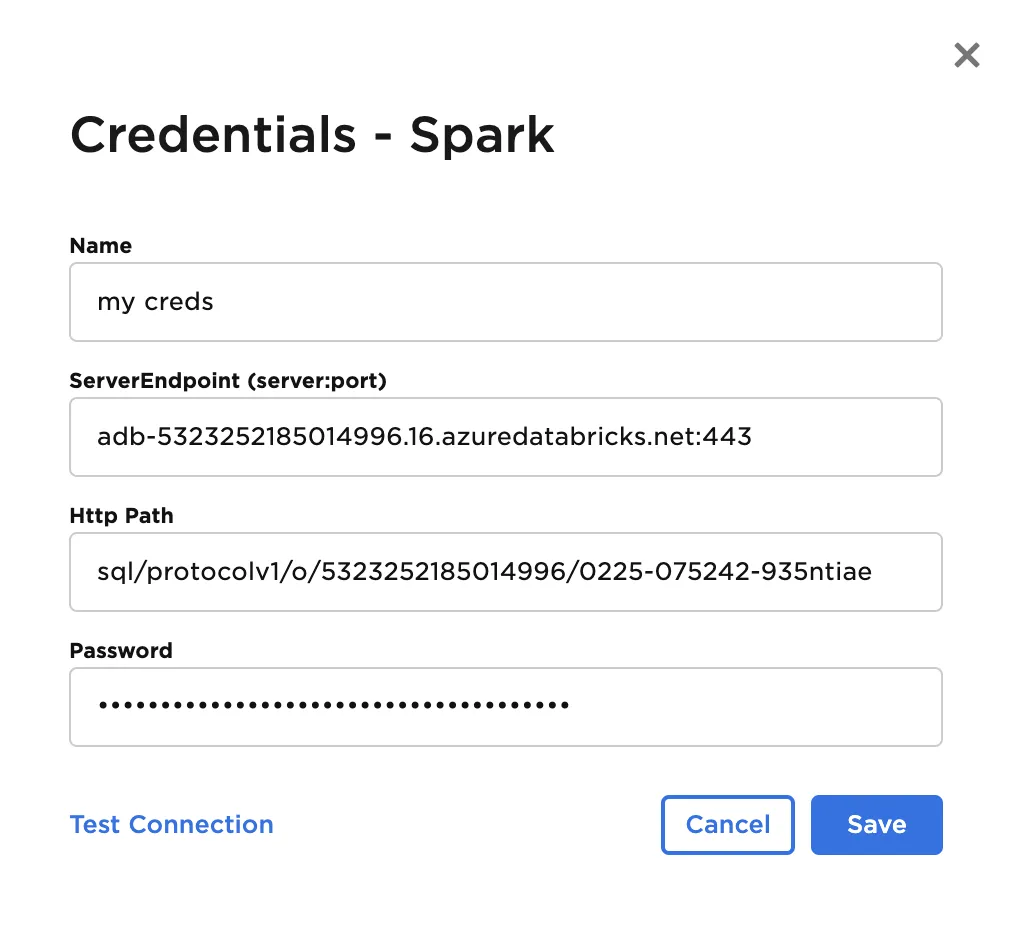
- Paste the contents for Server Hostname:Port into the ServiceEnpoint input, HTTPath, and your token as the Password
Configuration
| Field | Description |
|---|---|
| Name Optional | A user-specified node name displayed in the canvas |
| Credential Required | The information needed to access Spark data Select a saved credential from the dropdown menu. Select the gear icon to add a new credential or delete existing credentials. |
| Schema Required | The name of the desired Spark schema Select the schema from the auto-populated dropdown menu. |
| Select Table or Define Query Required | The data to upload Select the table you want to upload from the auto-populated dropdown menu or enter a SQL query that returns the desired data. |
| Filter by Value Optional | Configure filters to be applied to data Use the dropdown fields to filter results. Filter options include is null, is not null, is equal, is not equal, begins with, ends with, in between, is less than, is less than or equal to, is greater than, and is greater than or equal to. Filters can be applied on any column datatype. Add additional filters to create "And" conditional logic treatment. |
| Select column to partition with Optional | Column to use when partitioning the data Enter the name of a column in the table to use when partitioning the data. If a column is specified, Visual Notebooks partitions the file using the given column and creates multiple "parts" to speed up performance. |
| Number of partitions Default: 100 | Number of partitions to make when uploading the file Enter an integer. The data will be partitioned into this specified number of parts. |
Node Inputs/Outputs
| Input | None |
|---|---|
| Output | Visual Notebooks returns a table, called a dataframe, that contains all uploaded data. Columns are labeled and include a symbol that specifies the data type of that column. |
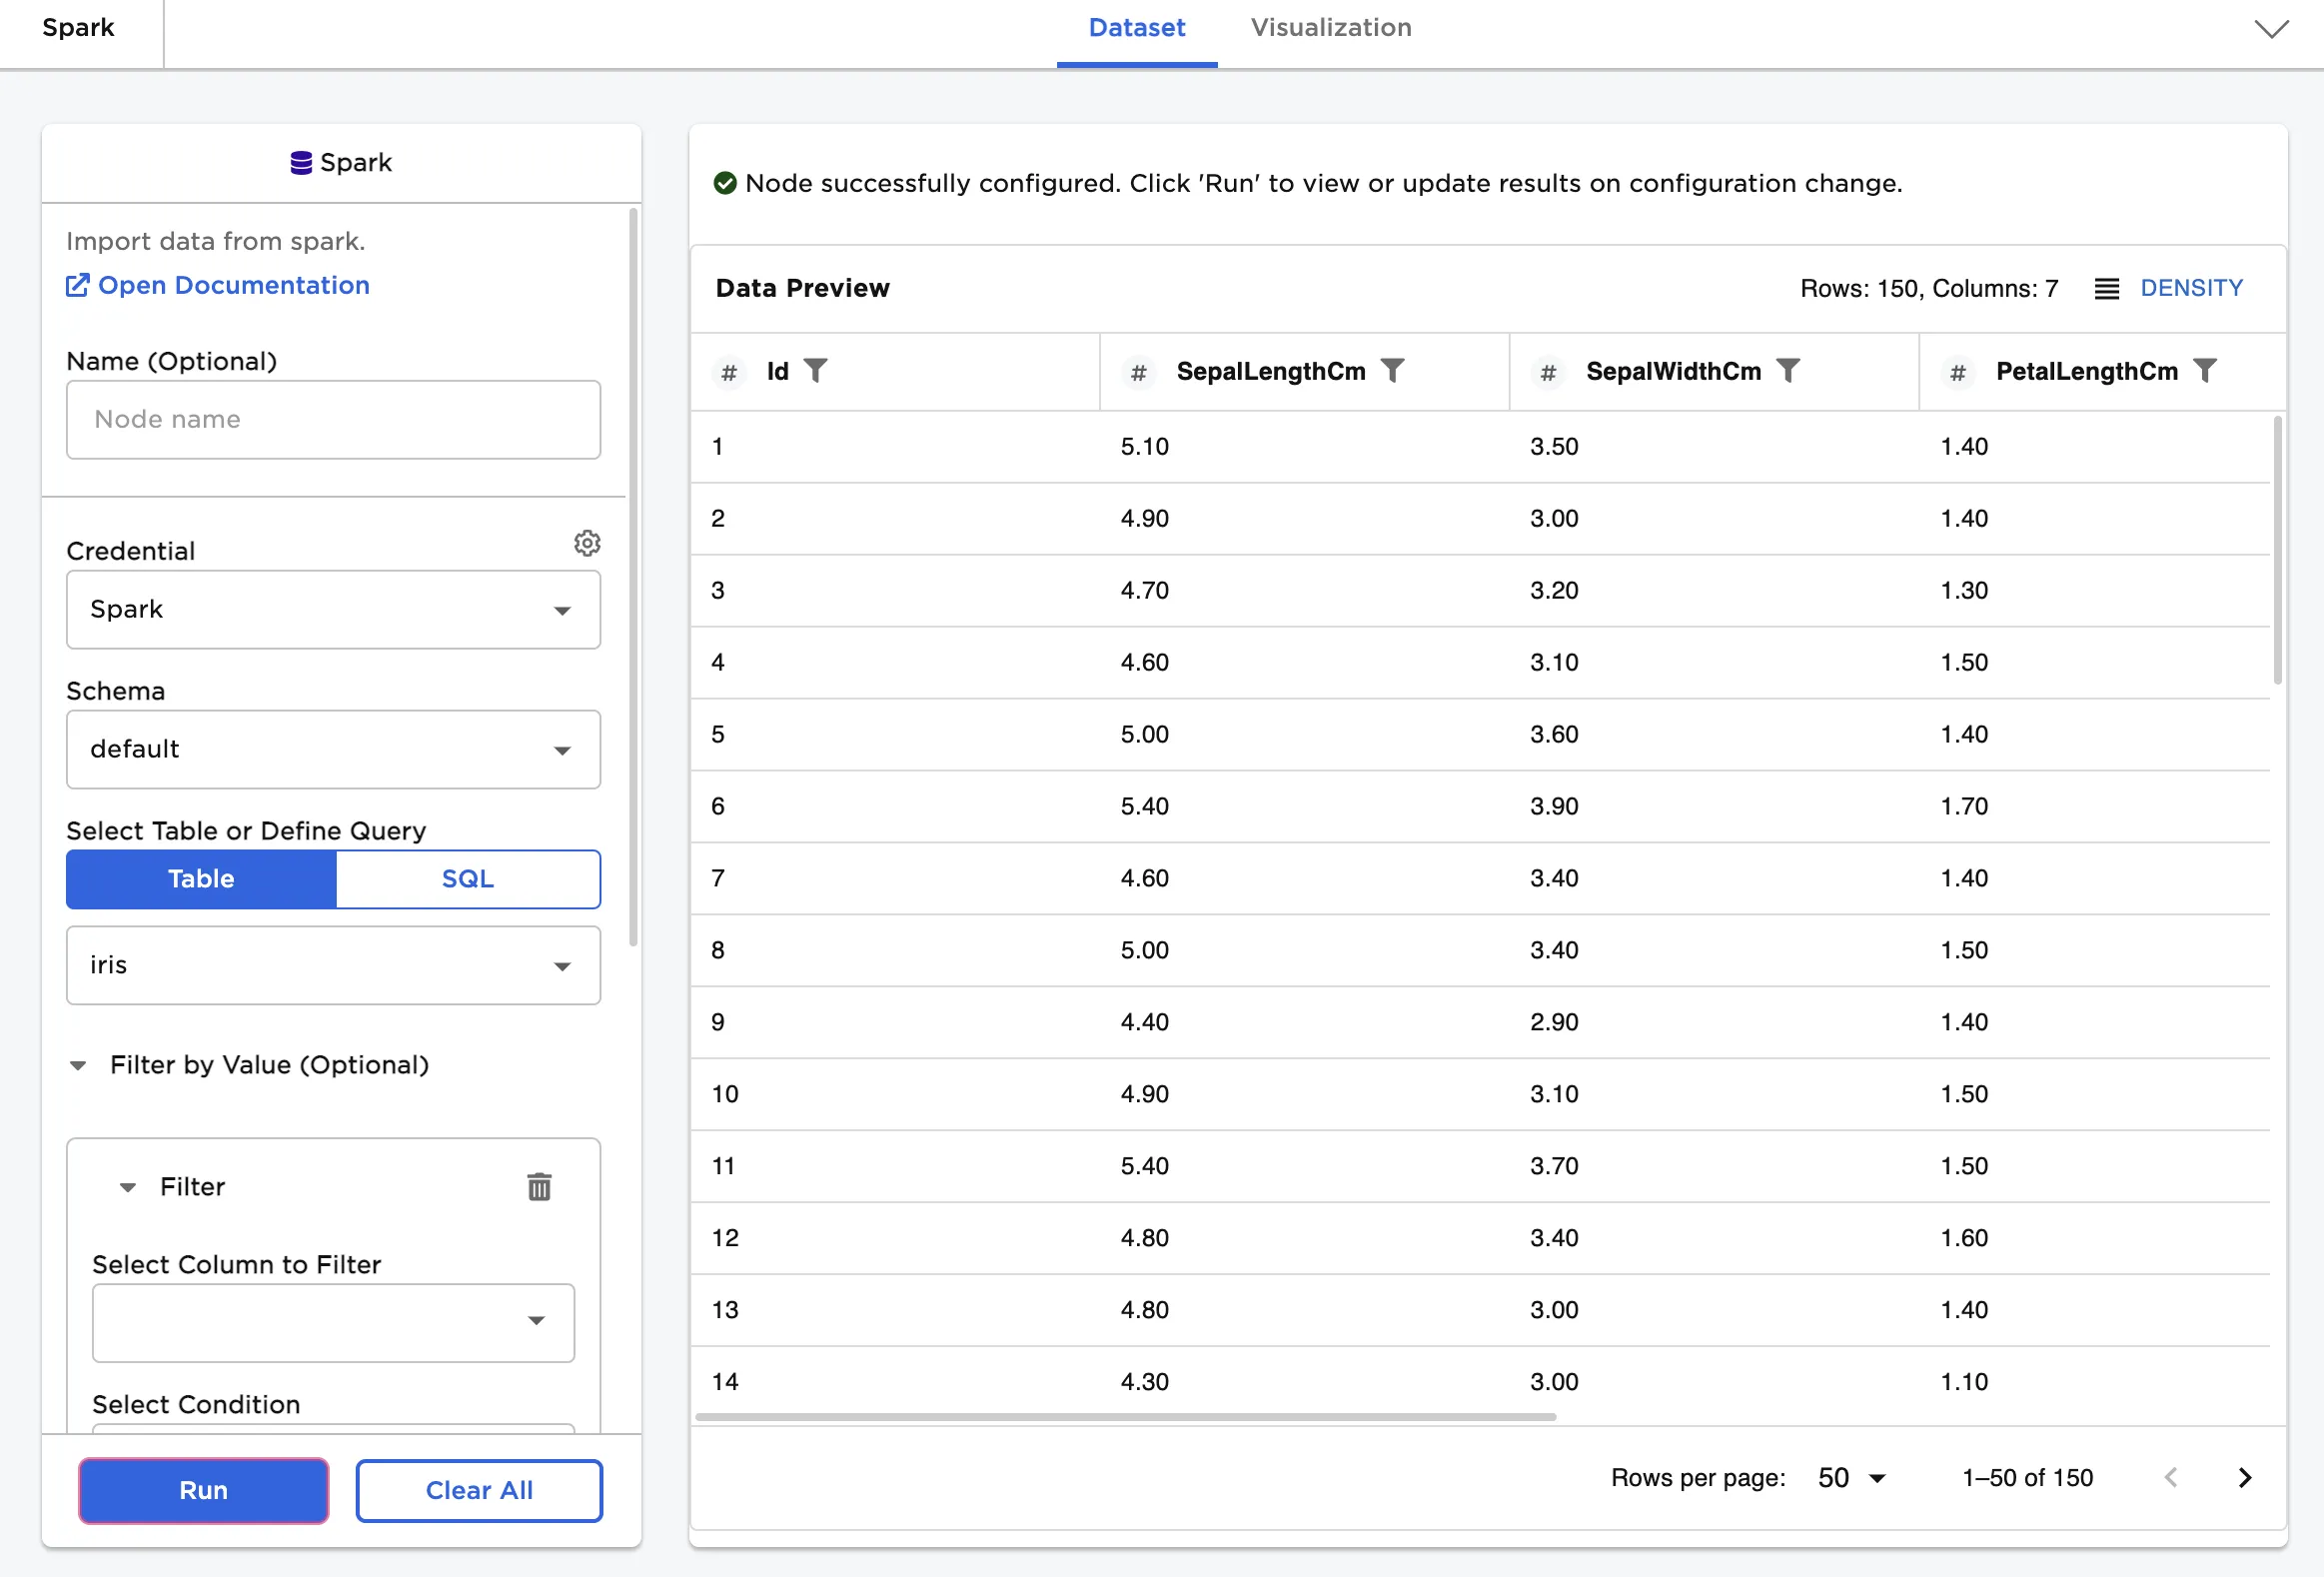
Figure 1: Example dataframe output
Examples
First, upload data from Spark with the default settings.
- Select the Spark schema and table that contains the desired data.
- Select Run to create a dataframe in Visual Notebooks.
Figure 2: Example dataframe created from a Spark table
Now add a filter to limit the amount of data returned.
- Select a column to filter by.
- Select a condition and define a value.
Figure 3 shows data from the "iris" table that has an "Id" value less than or equal to 10.
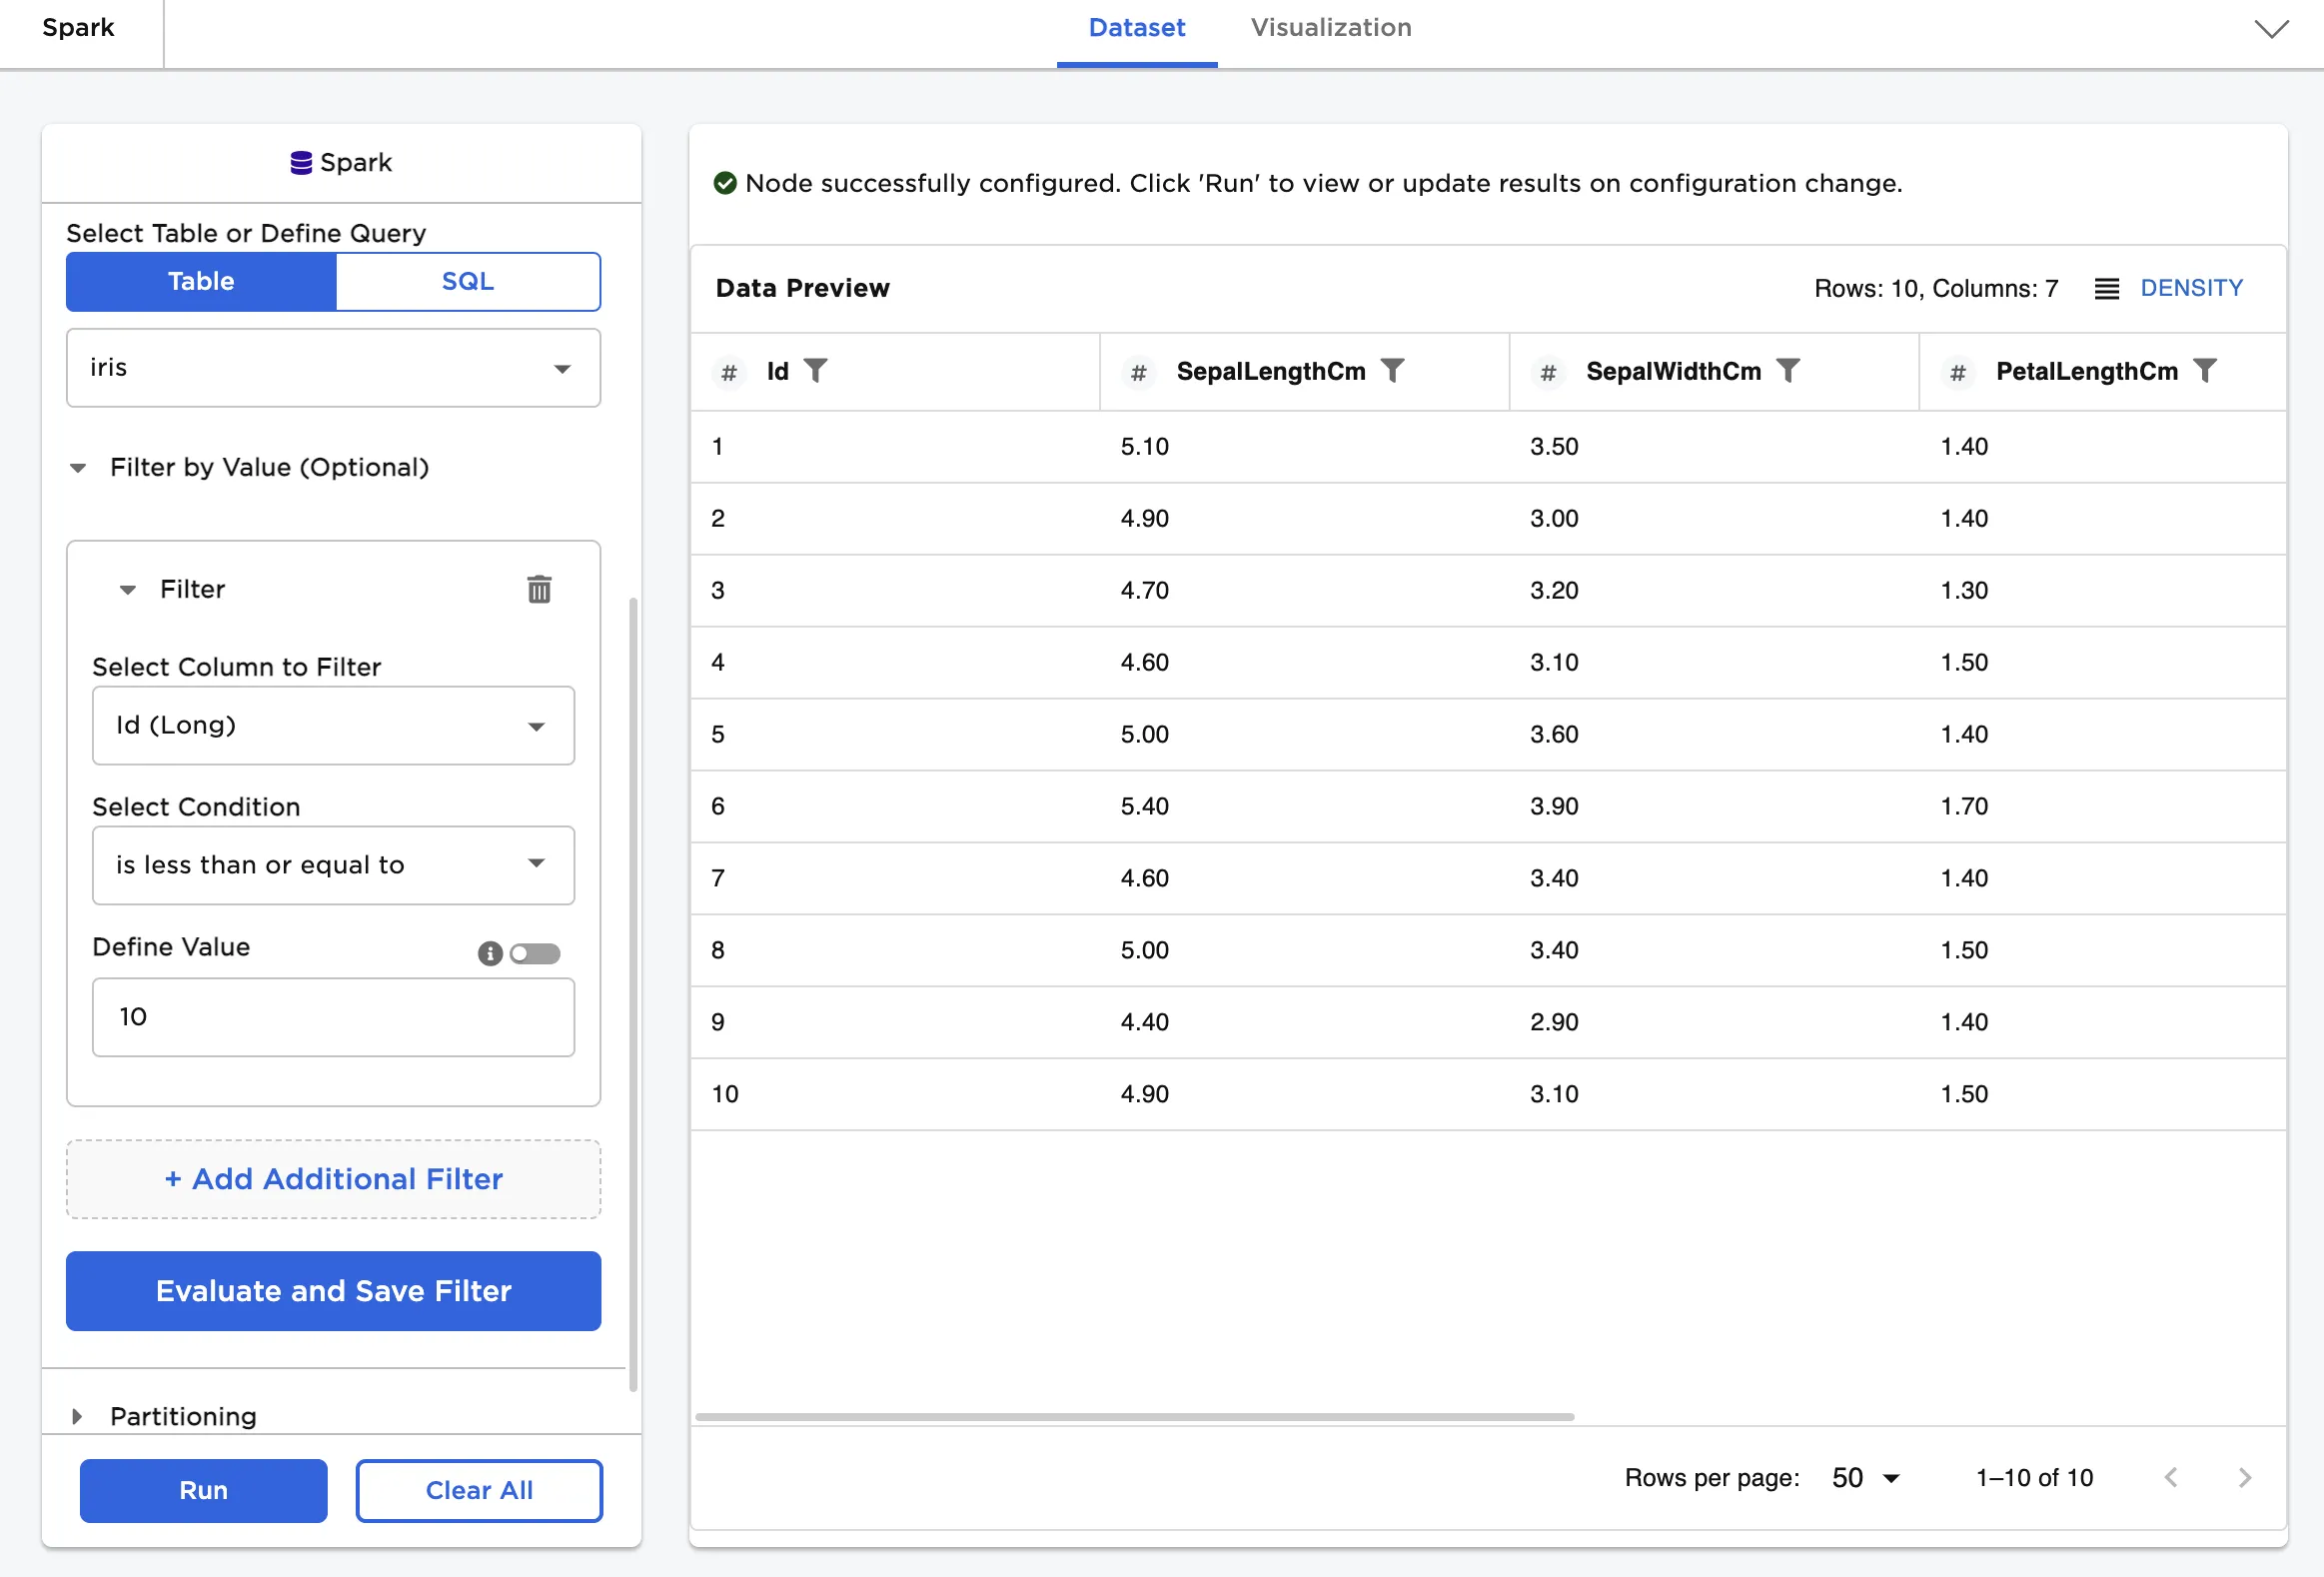
Figure 3: Example dataframe filtered by value
Upload a subset of the data using a SQL query.
- Select a Spark schema.
- Write a query that returns the desired data.
- Select Run to create a dataframe in Visual Notebooks.
Figure 4 shows a SQL query that returns the "Id" and "Species" columns for the first ten rows of the "iris" table.
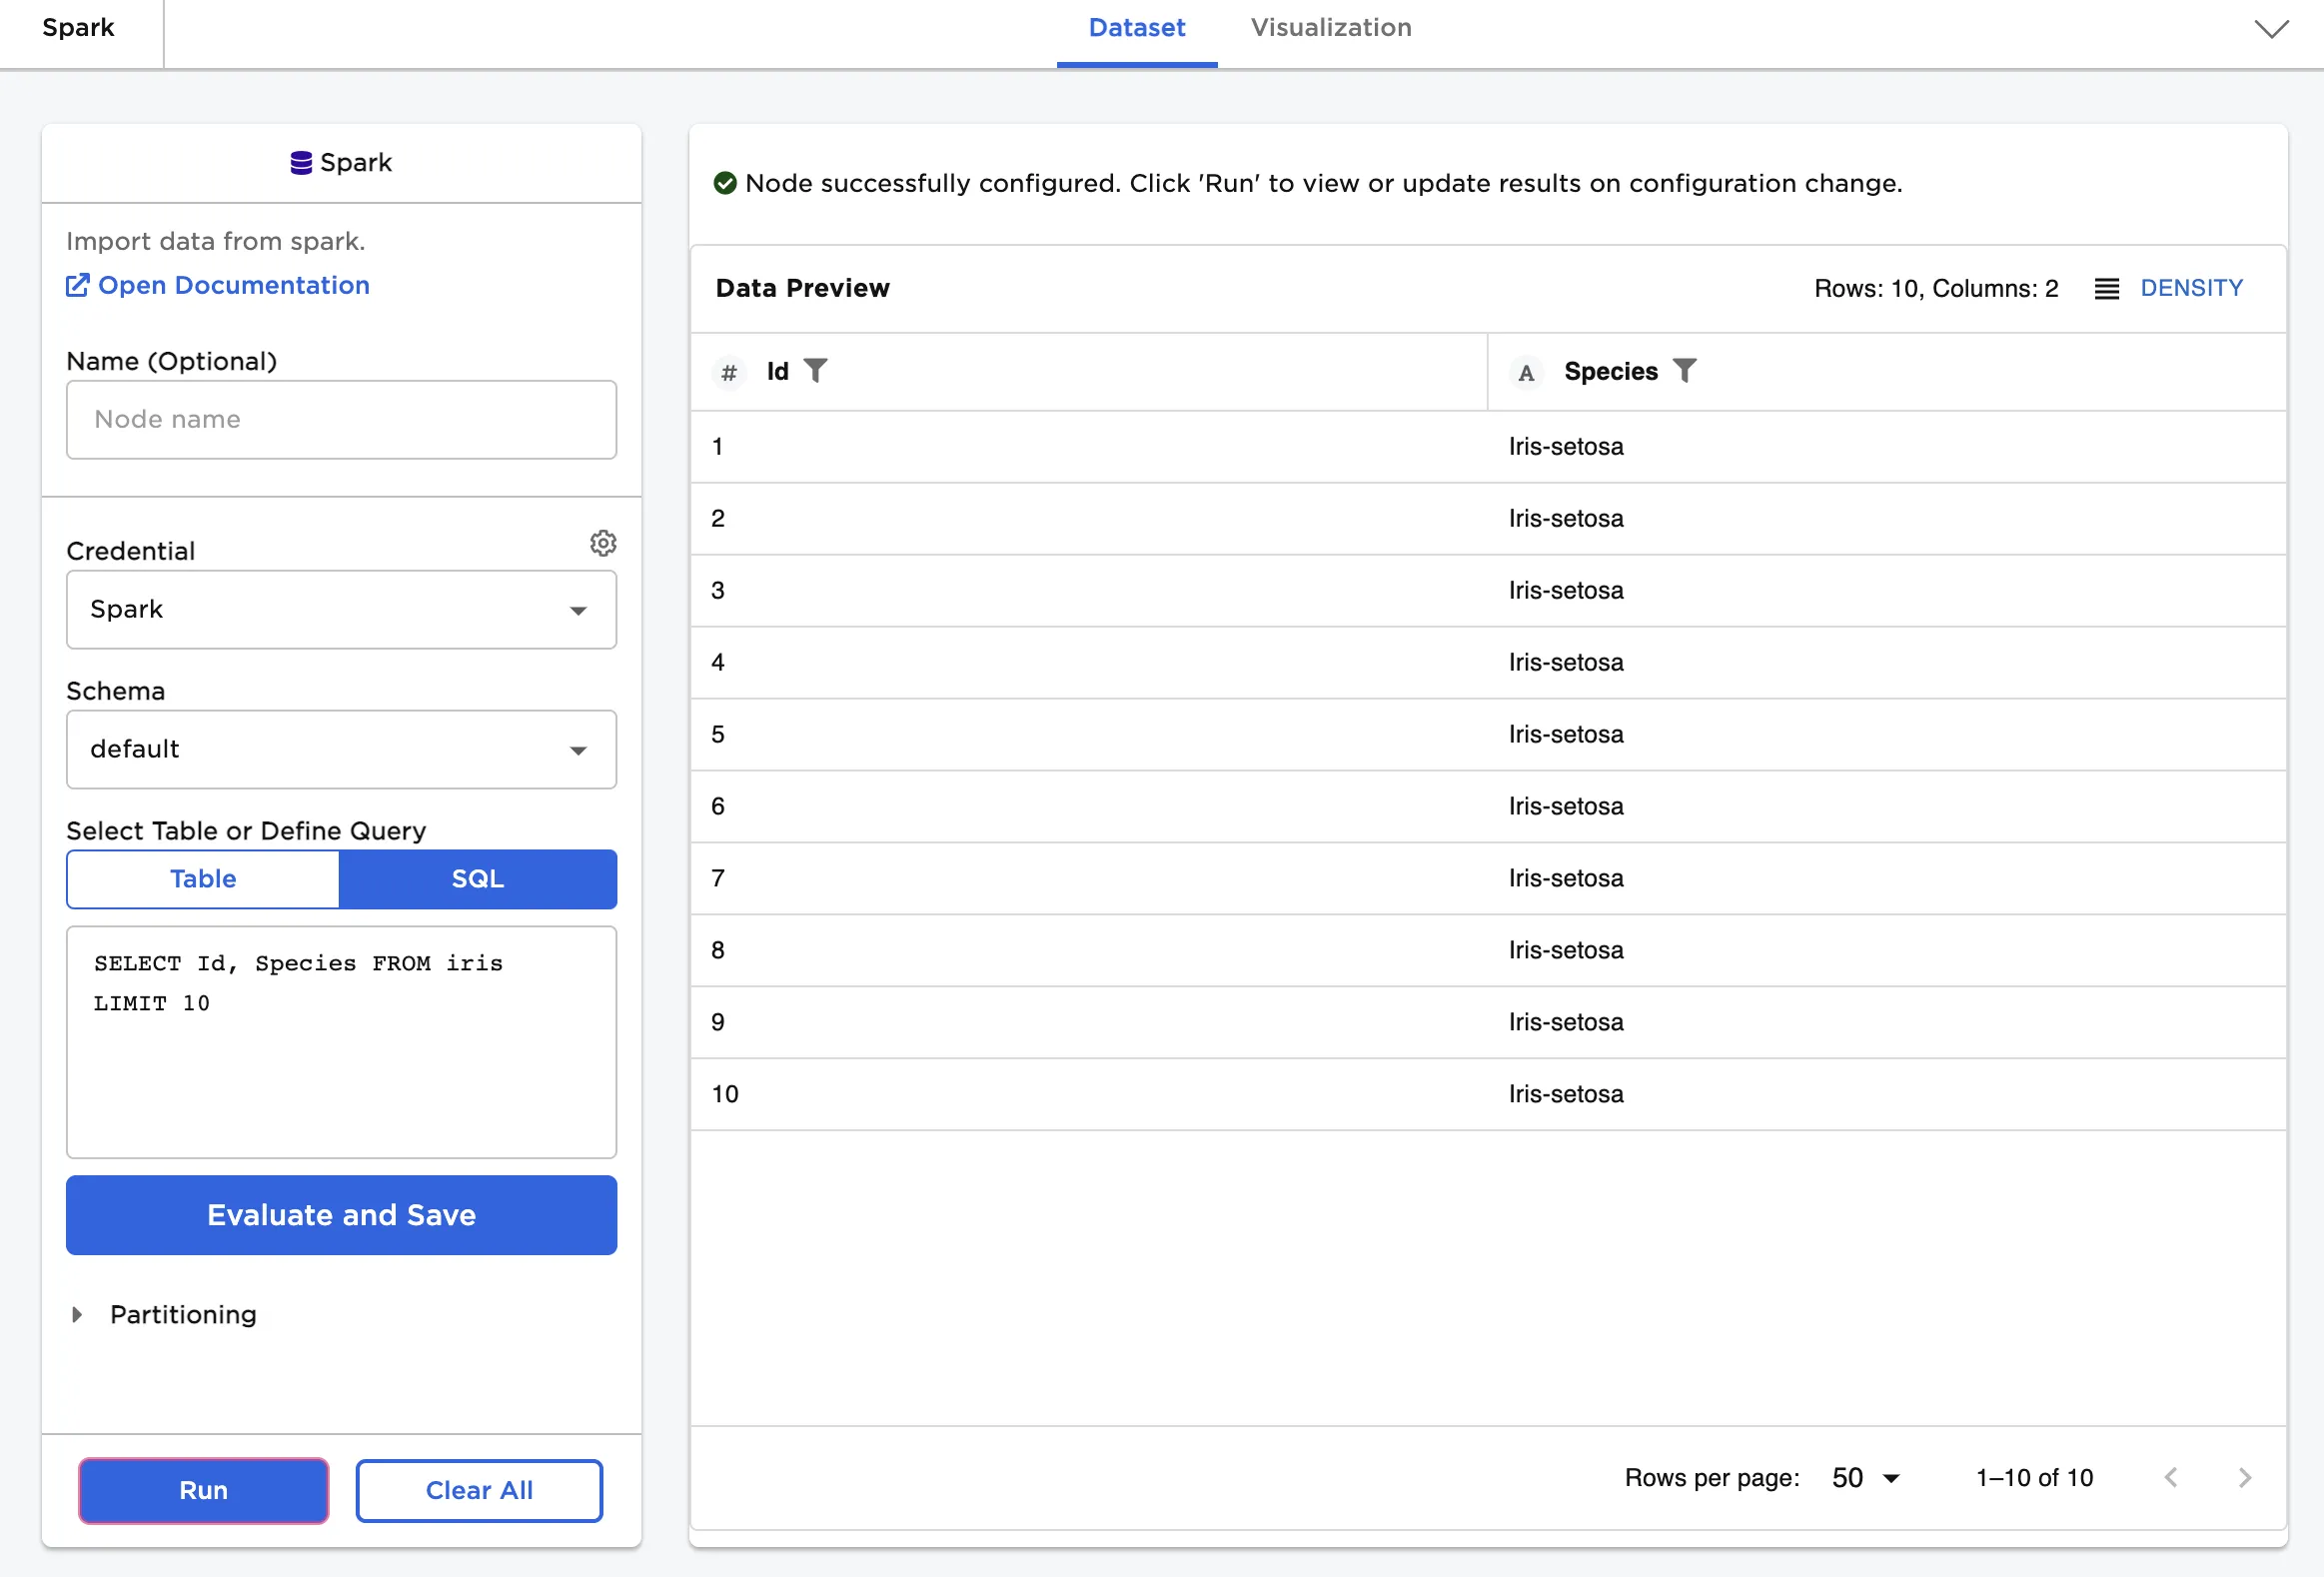
Figure 4: Example dataframe created from a SQL query