Summary Table
Create a summary table in Visual Notebooks. Summary tables enable data to be displayed in a presentation-ready format. They can be configured using filter, sort, and aggregation functions across rows and columns.
Configuration
| Field | Description |
|---|---|
| Select column(s) | Columns to include in the summary table Select the columns to display in the summary table. |
| Select Column to Filter | Column to filter on Select a column on which to apply a filter condition. Only columns in Select column(s) can be filtered. |
| Select Condition | Column filtering condition Select a filtering condition to apply to the column from Select Column to Filter. |
| Sort By | Column to sort on Select a column on which to apply a sorting rule. The icon to the right of this field is a toggle for ascending or descending order. Sorting rules can only be applied to columns in Select column(s). |
| Enable Column Aggregation | Toggle to enable or disable column-wise summary statistics Toggle the switch on to display fields for calculating and displaying column-wise summary statistics. Leave the switch off if there is no need to display these column aggregations. |
| Enable Row Aggregation | Toggle to enable or disable row-wise summary statistics Toggle the switch on to display fields for calculating and displaying row-wise summary statistics. Leave the switch off if there is no need to display these row aggregations. |
| Columns to Exclude | Columns to skip in calculating summary statistics Select the columns to skip over when calculating summary statistics. For column aggregation, all aggregation fields for skipped columns are empty. For row aggregation, summary statistics are calculated using all columns in Select column(s) except for skipped columns. |
| Column Aggregation Methods | Column-wise summary statistics to display Select specific column-wise aggregations, or summary statistics, to display on the bottom of the table. Options include average, minimum, maximum, sum and count. |
| Row Aggregation Methods | Row-wise summary statistics to display Select specific row-wise aggregations, or summary statistics, to display on the right of the table. Options include average, minimum, maximum, sum and count. |
Visualization Settings
General
| Field | Description |
|---|---|
| Title | Title of the visualization Enter a title, which is left-aligned at the top of the table. |
Node Inputs/Outputs
| Input | A Visual Notebooks dataframe |
|---|---|
| Output | A summary table in Visual Notebooks |
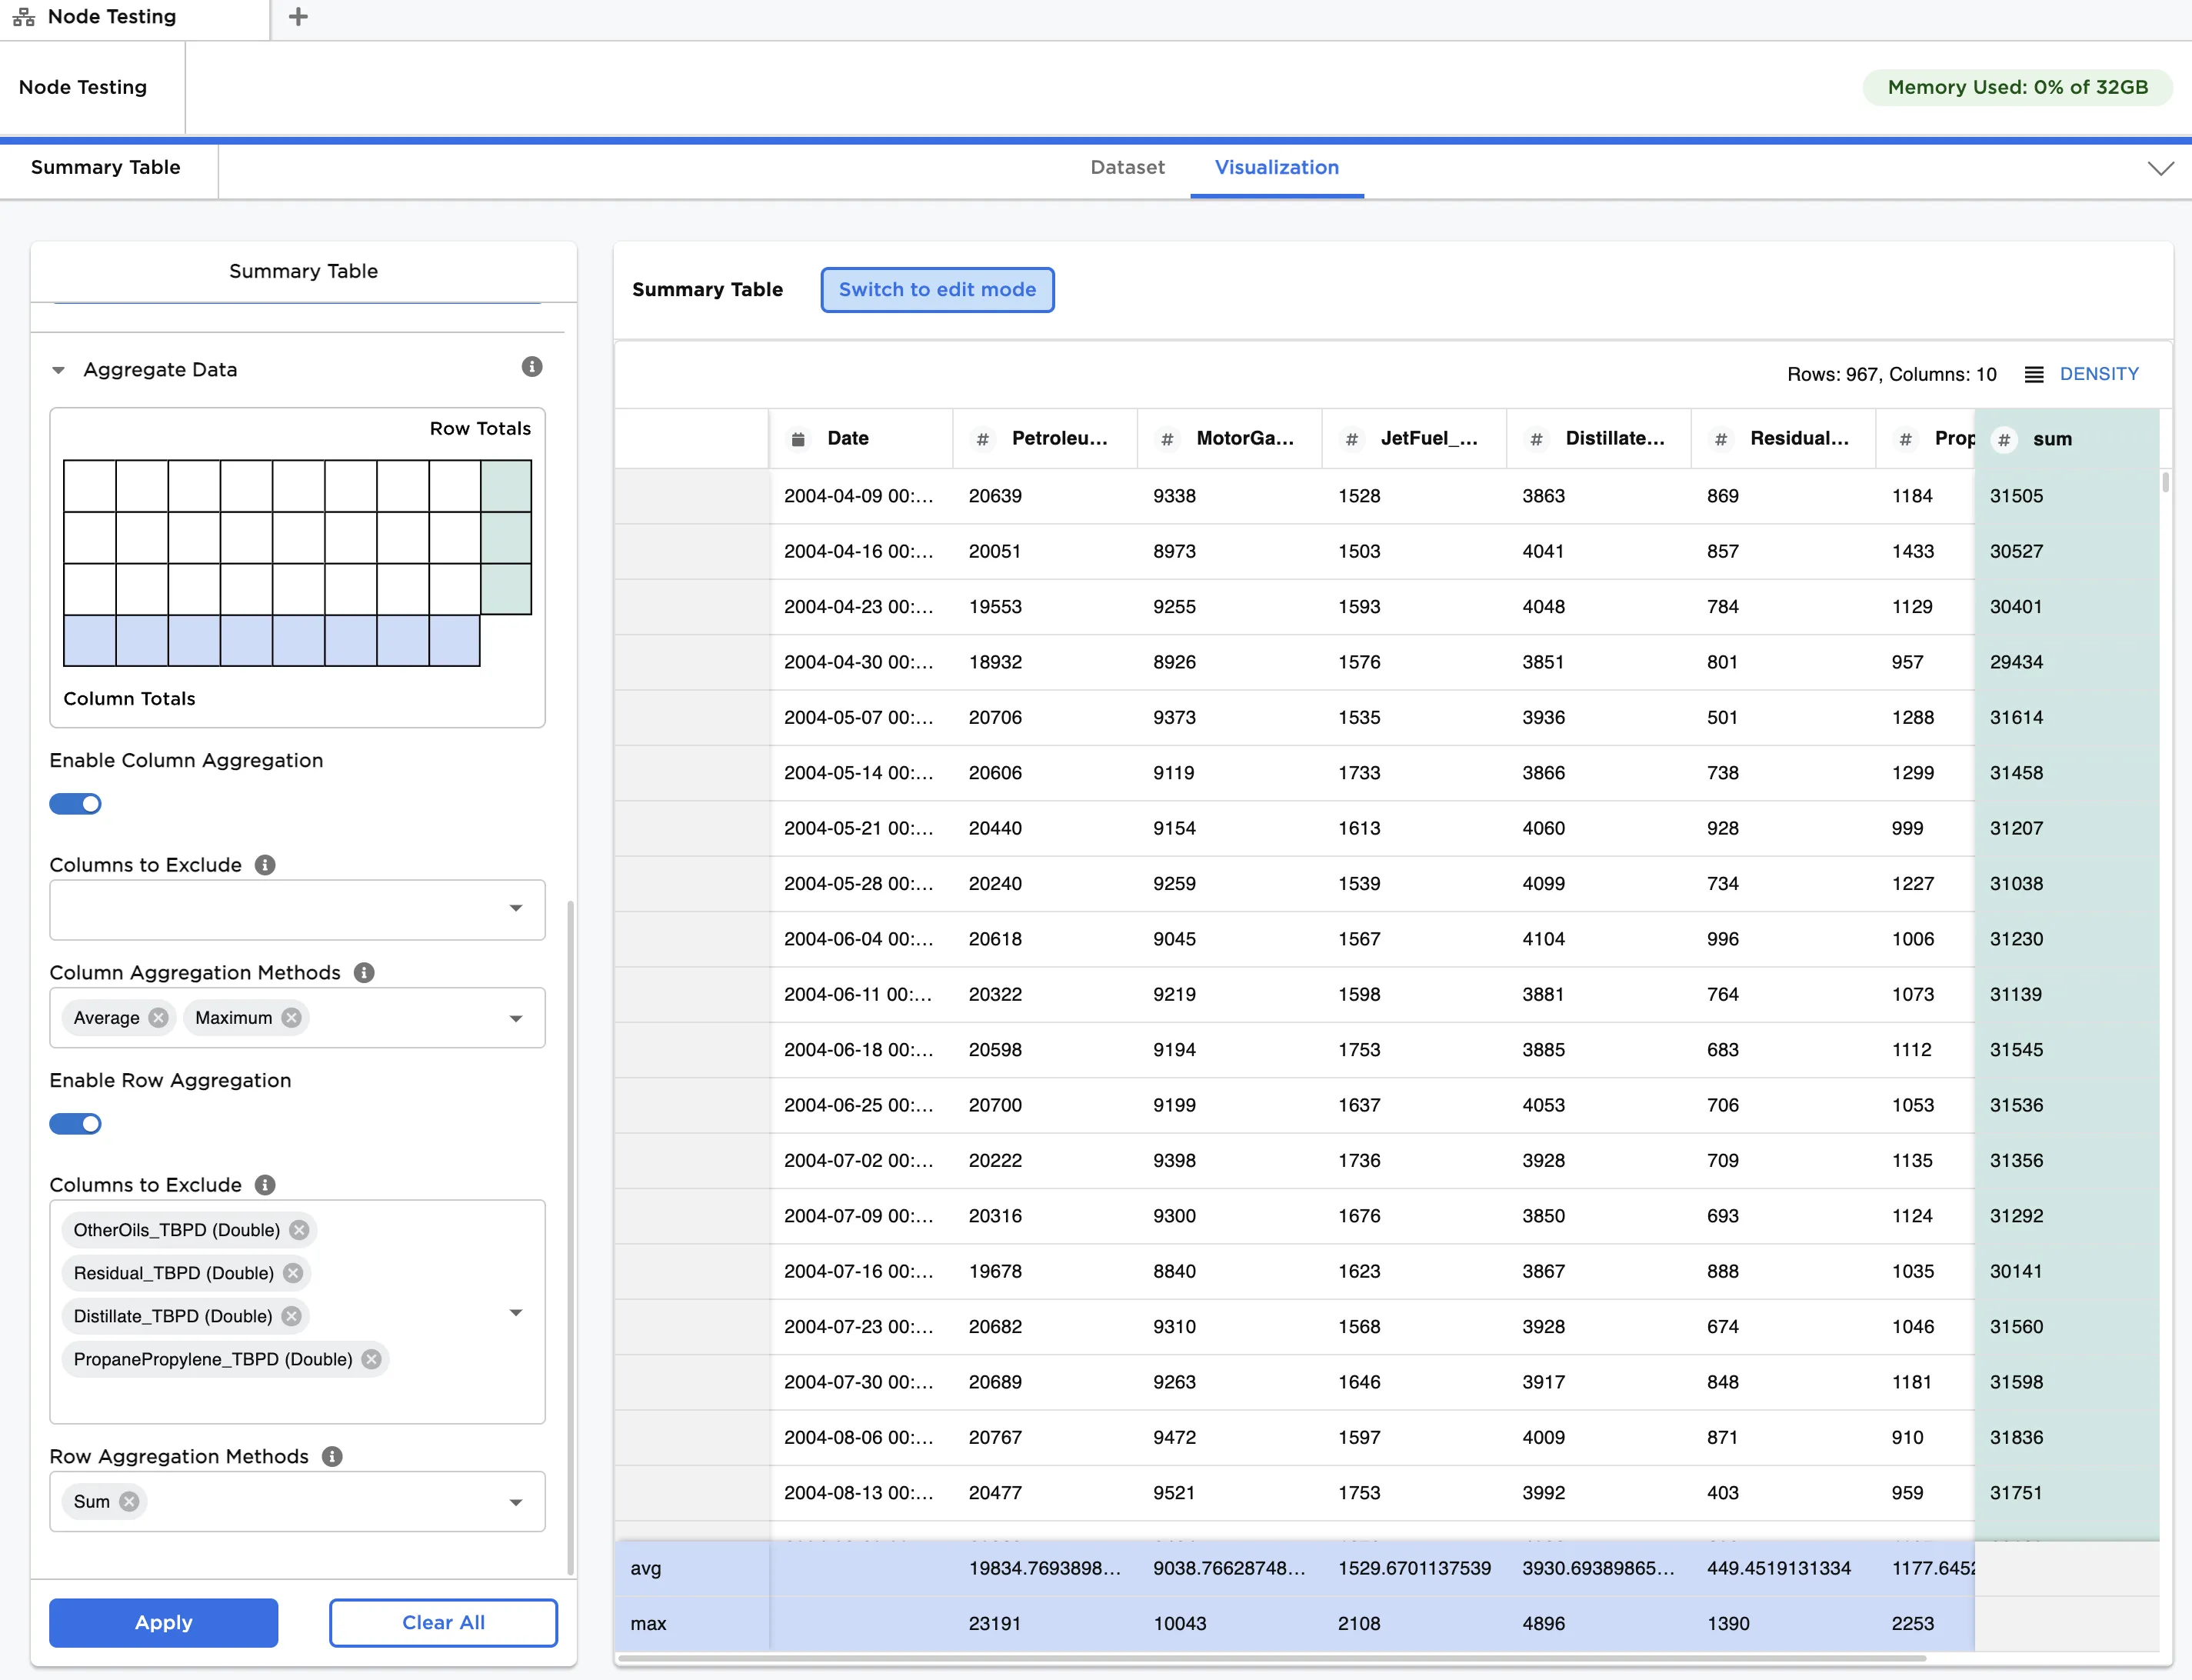
Figure 1: Example summary table
Examples
The data shown in Figure 2 is used in this example. It contains weekly US consumption of various petroleum products from April, 2004 through October, 2022.
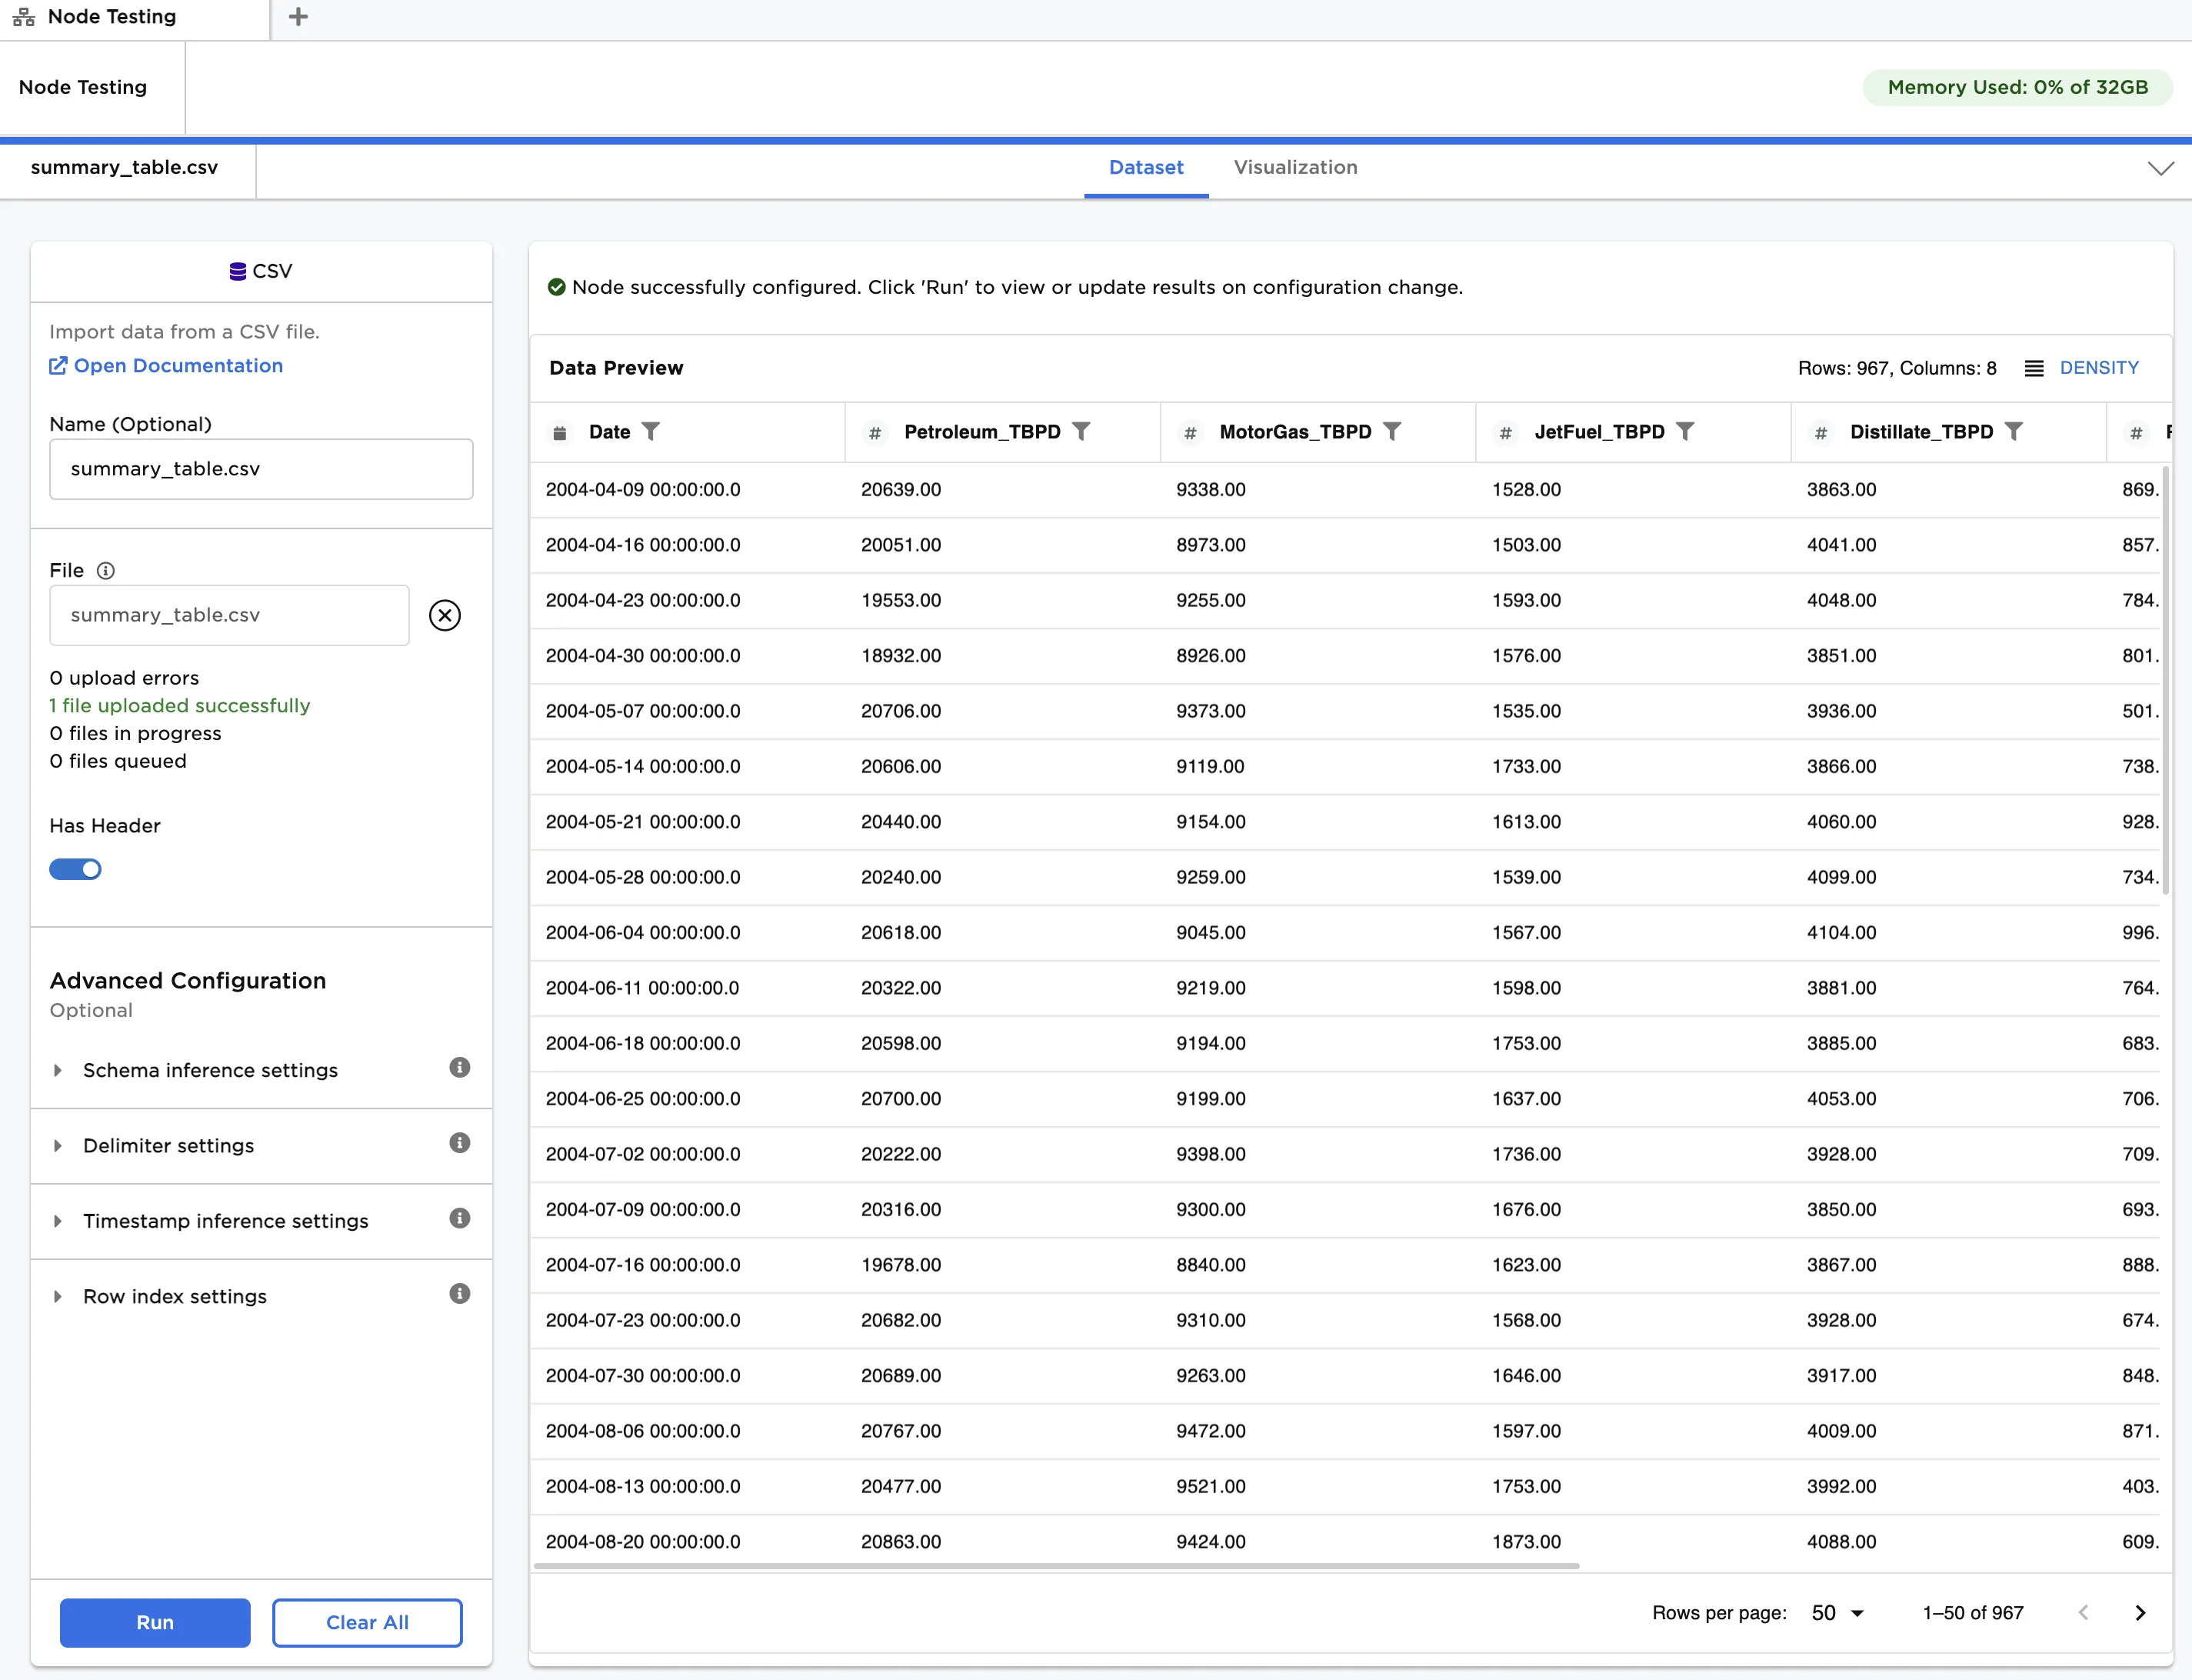
Figure 2: Example input data
Use the data in Figure 2 to create a summary table.
- Connect a Summary Table node to an existing node. In this case it is connected to a CSV node with the example data provided.
- Select Select all for the Select column(s) field.
- Click Apply.
Notice that the table is identical to the input dataframe, as shown in Figure 3.
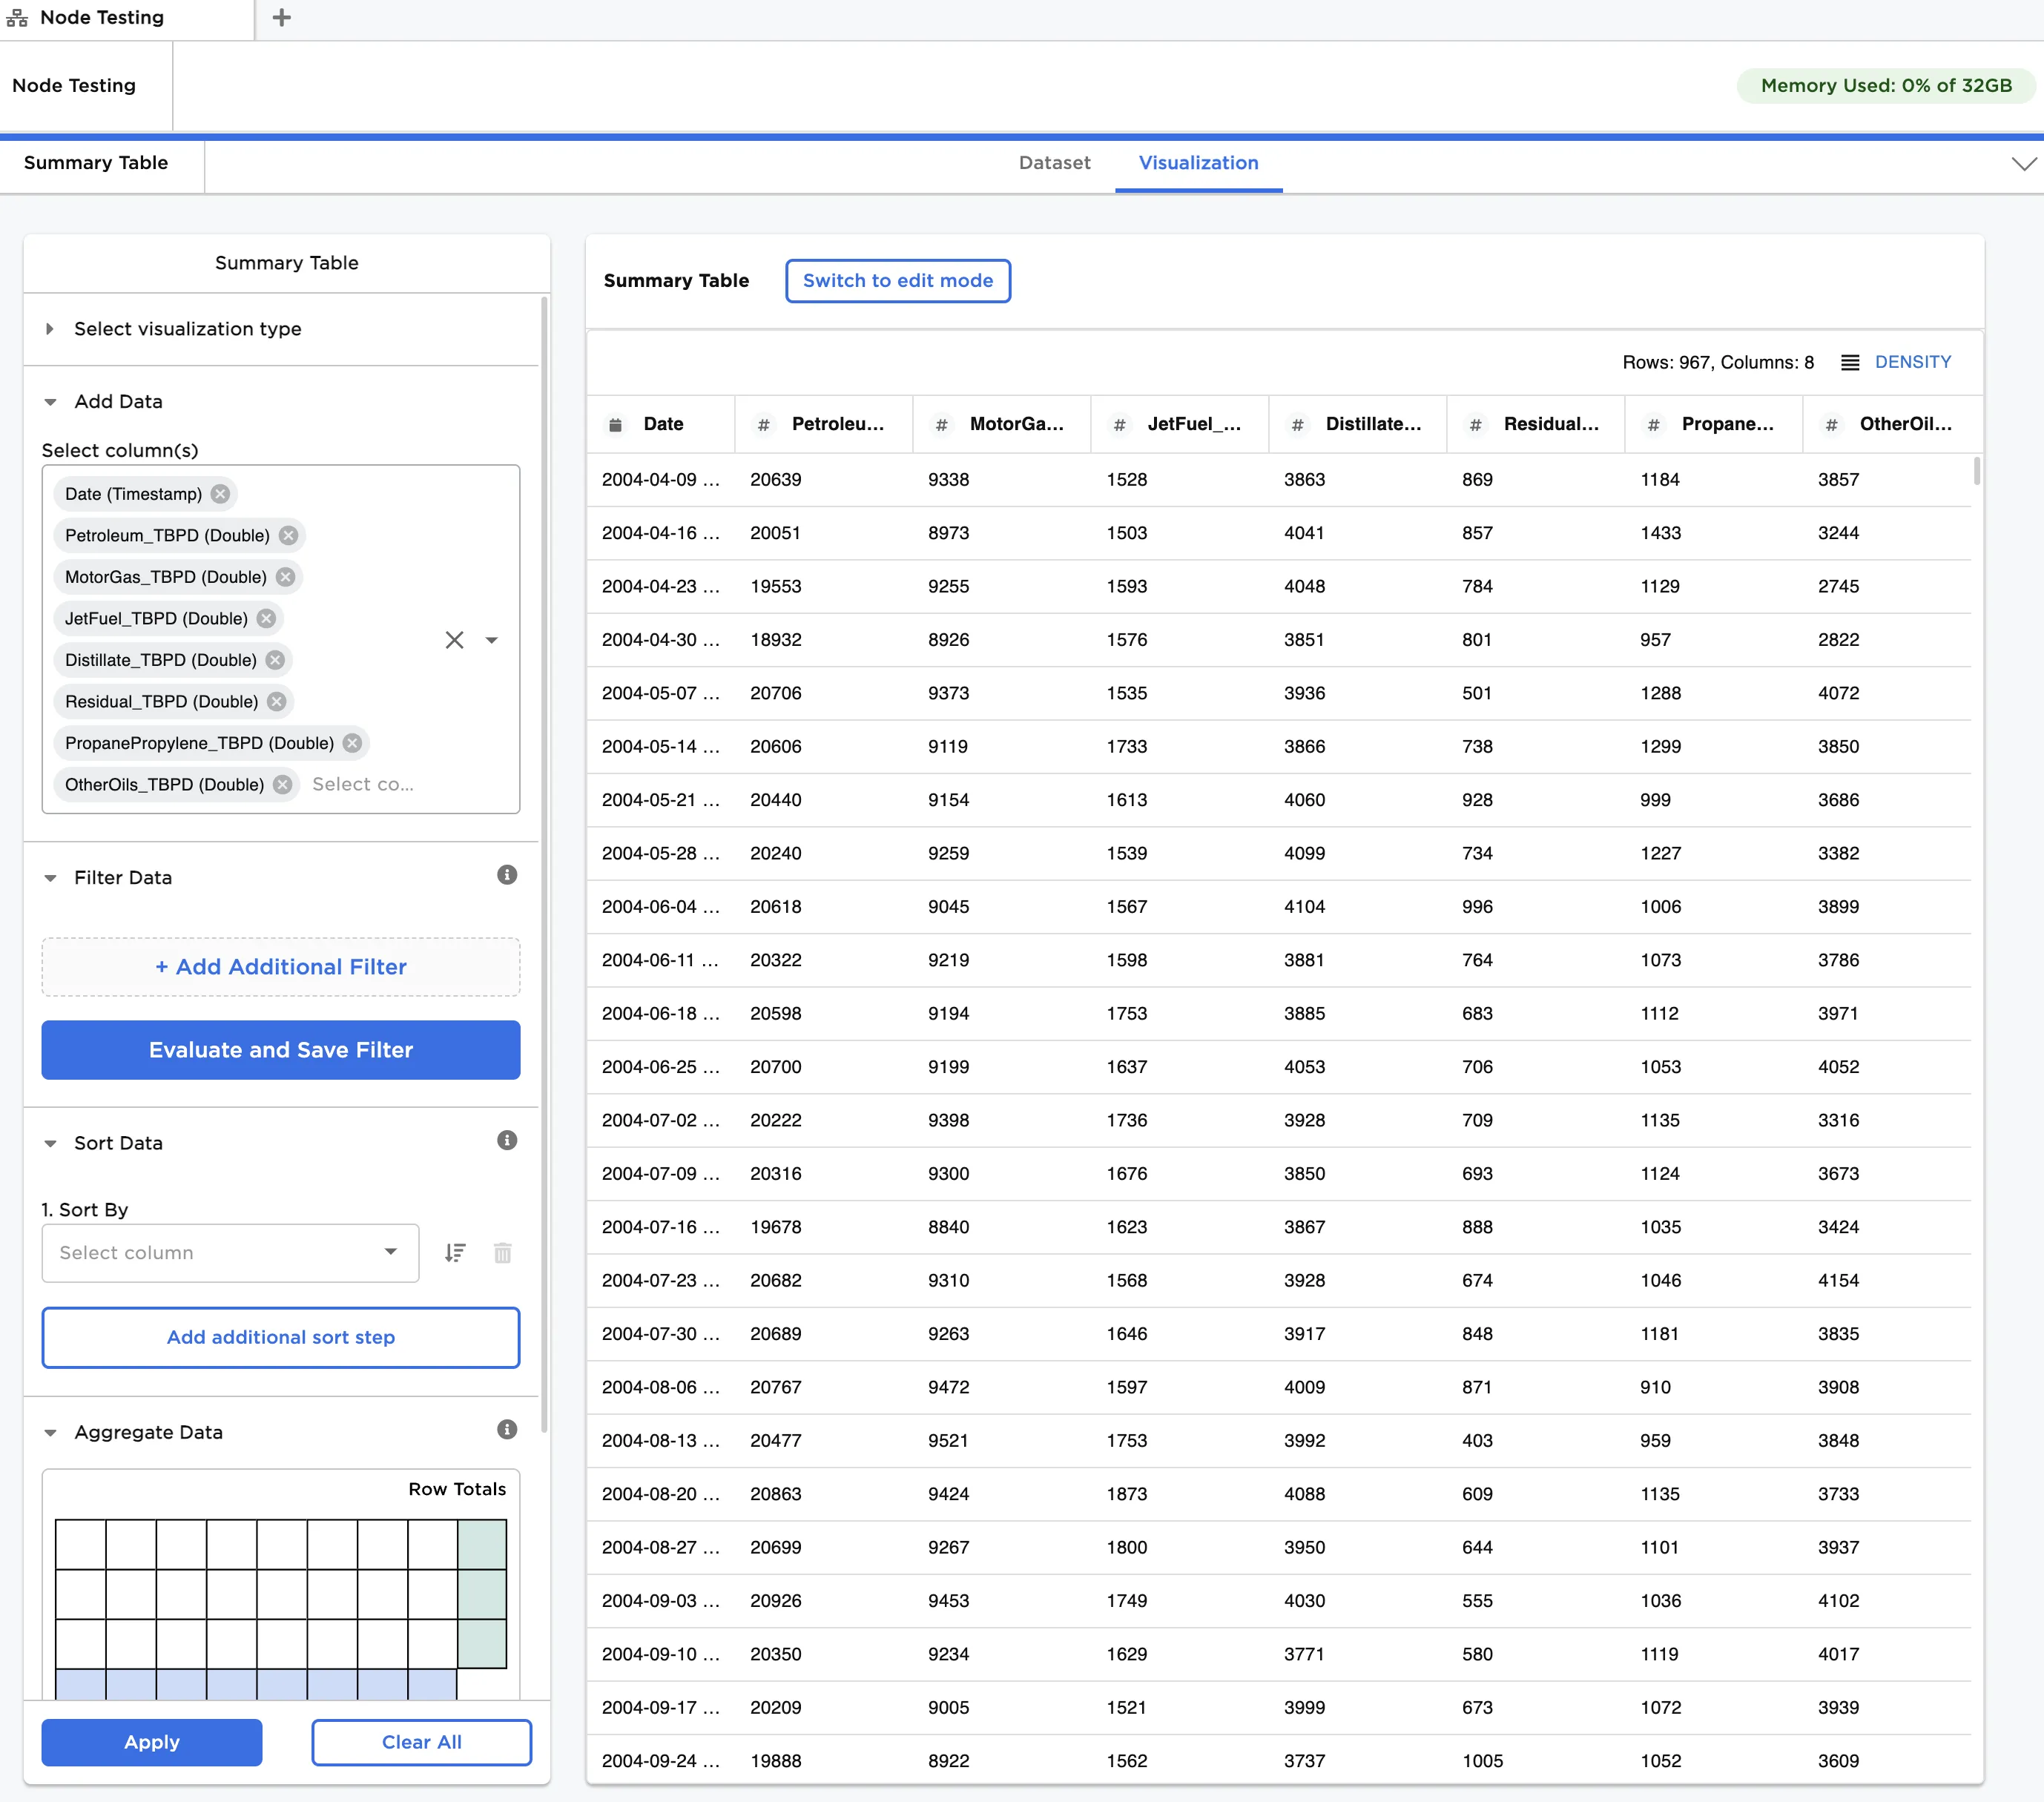
Figure 3: Example summary table with default settings
Let's work through the configuration sidebar to enhance the table.
- Select Date (Timestamp) under Sort By.
- Toggle on Enable Column Aggregation.
- Select Average and Maximum for Column Aggregation Methods.
- Click Apply.
You can see the Date column is now sorted from newest to oldest, as shown in Figure 4. Additionally, the maximum value and the average for each column are shown in the blue highlighted rows at the bottom of the table.
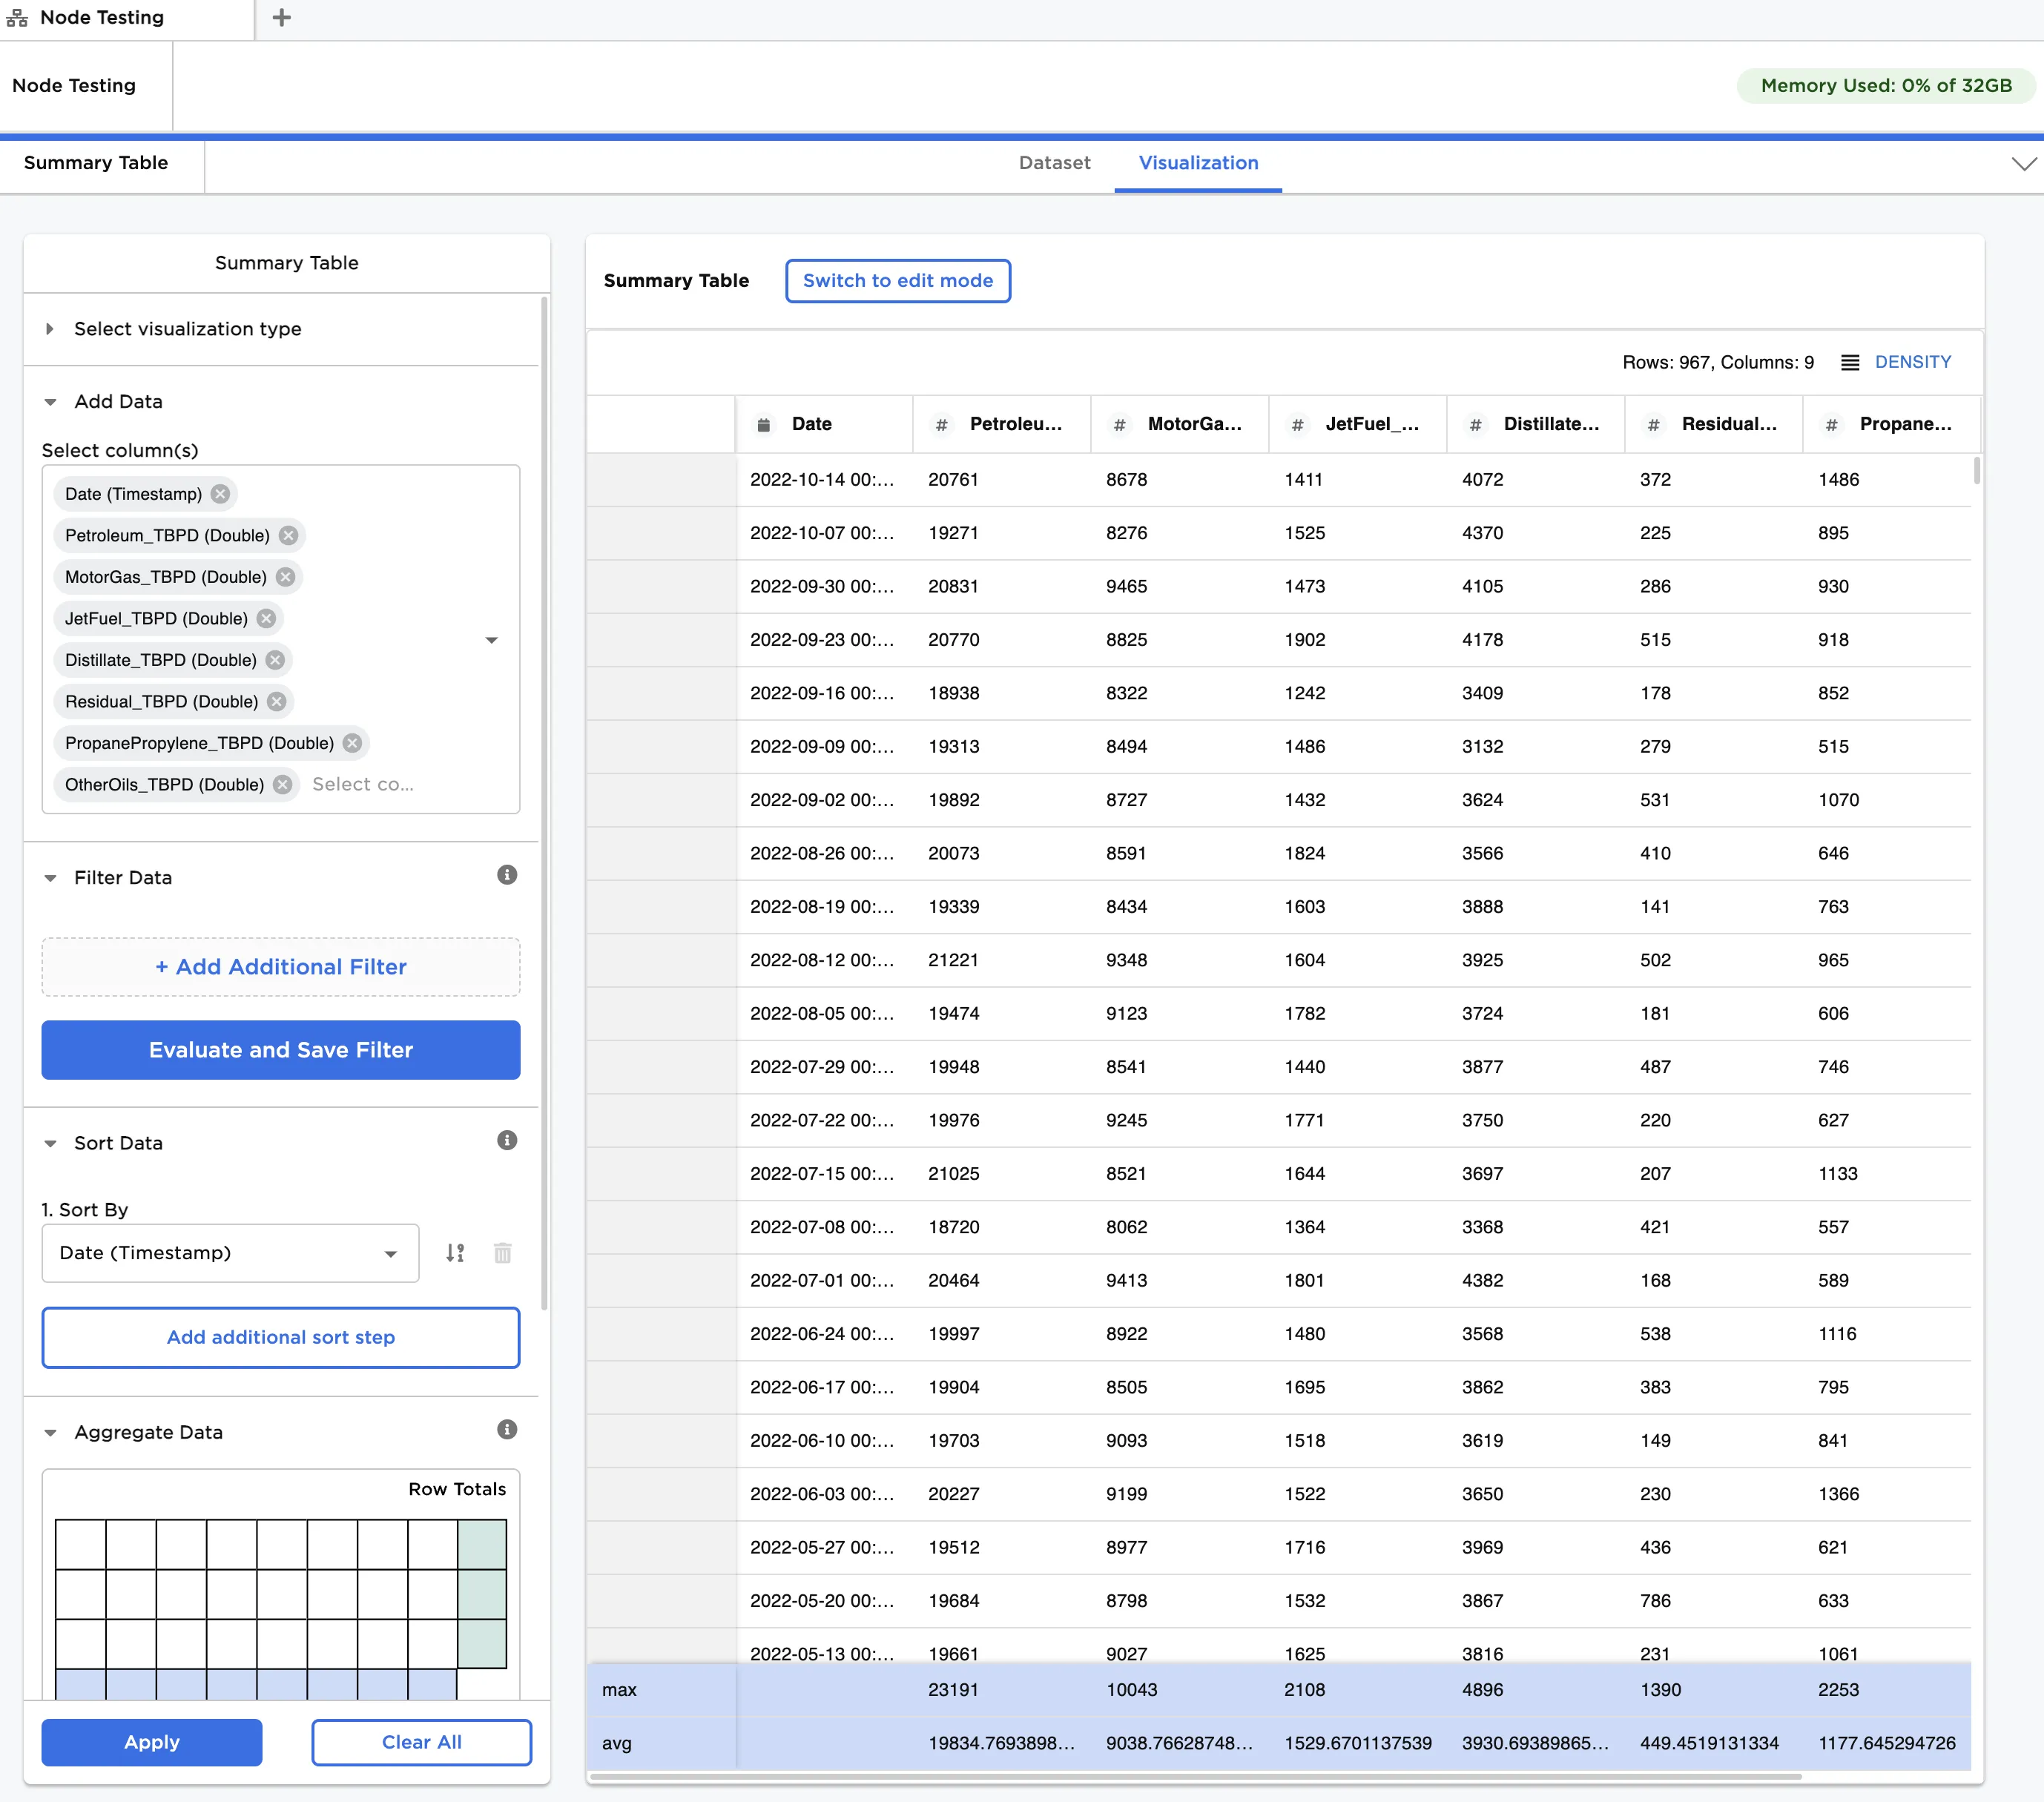
Figure 4: Example summary table with sorting and column aggregation
Now, we add row aggregations to the table.
- Toggle on Enable Row Aggregation.
- Under Columns to Exclude for row aggregation, select the following columns:
- OtherOils_TBPD (Double)
- Residual_TBPD (Double)
- Distillate_TBPD (Double)
- PropanePropylene_TBPD (Double)
- Select Sum for Row Aggregation Methods.
- Click Apply.
You can see the row sums in the green highlighted column to the right of the table, as shown in Figure 5. Note that the sums are calculated using all columns except for the four columns we excluded.
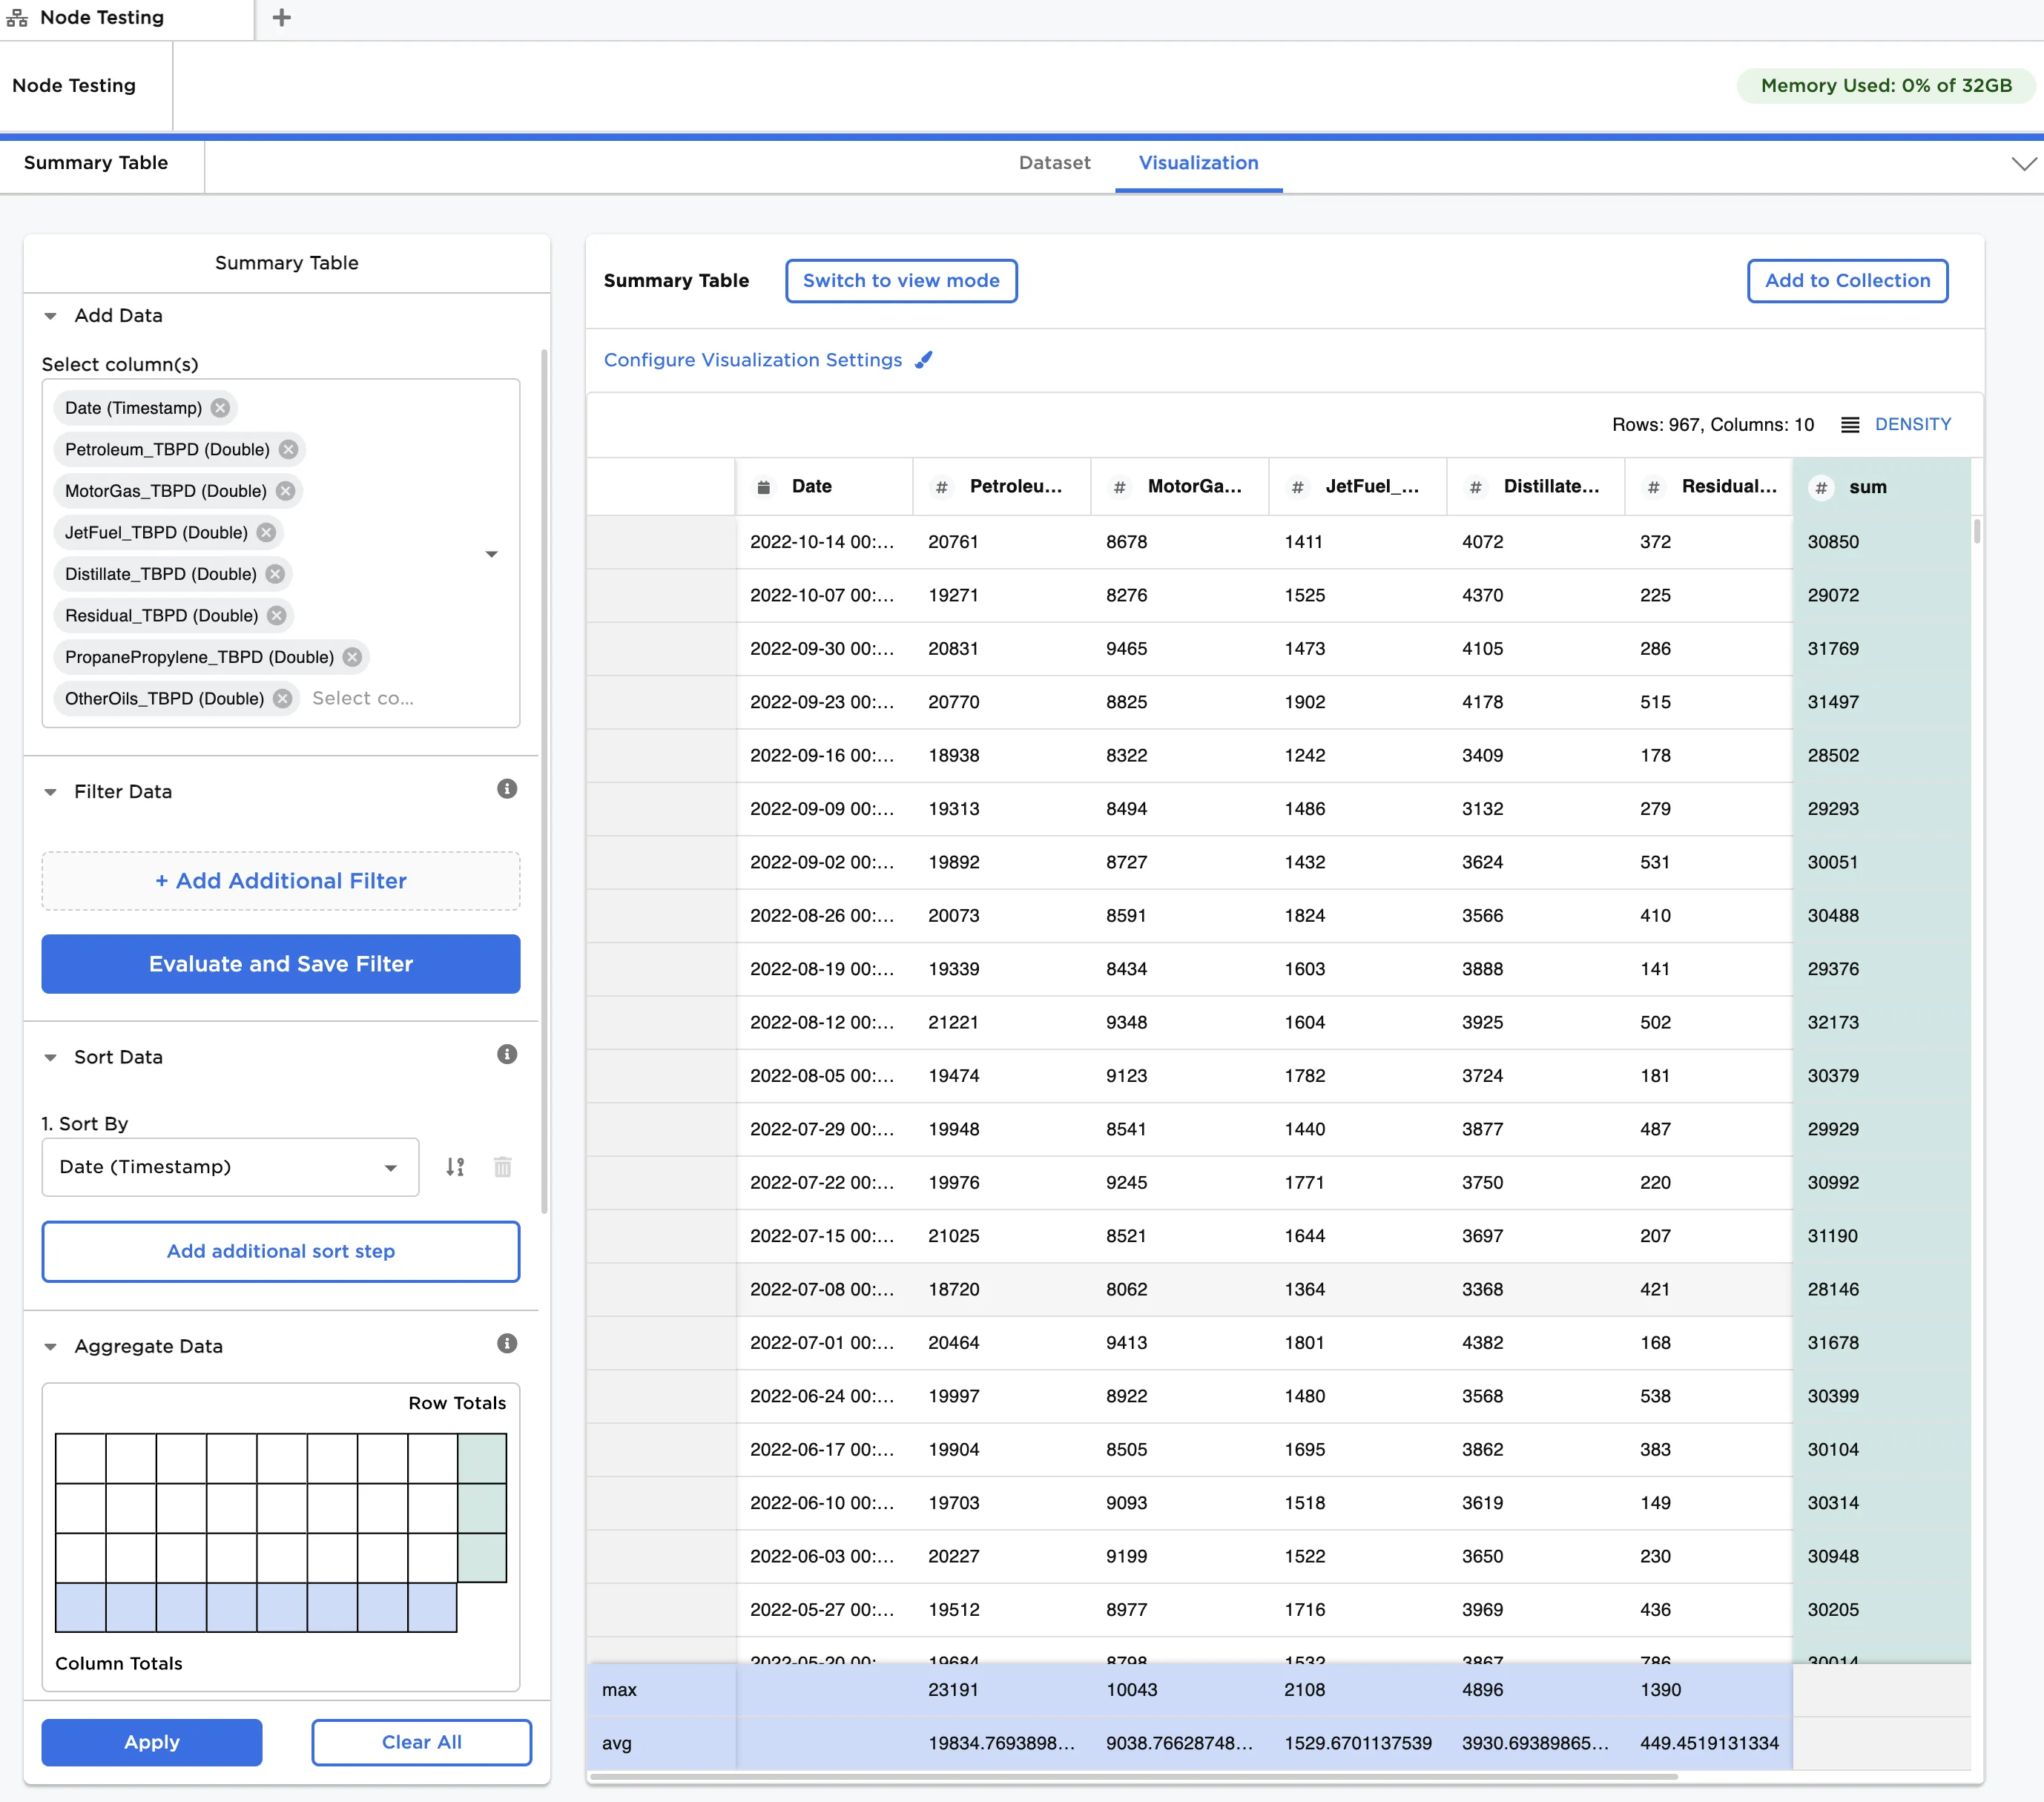
Figure 5: Example summary table with sorting, row and column aggregation
Finally, we add filters to the table.
- Click + Add Additional Filter.
- Select Petroleum_TBPD (Double) under Select Column to Filter.
- Select is less than under Select Condition.
- Enter
20000under Define Value. - Click Evaluate and Save Filter.
- Click Apply.
The filtered table is shown in Figure 6. You can see that all of the aggregations have updated accordingly. Note that even if a filter is deleted, you must first click Evaluate and Save Filter before Apply to process the deletion.
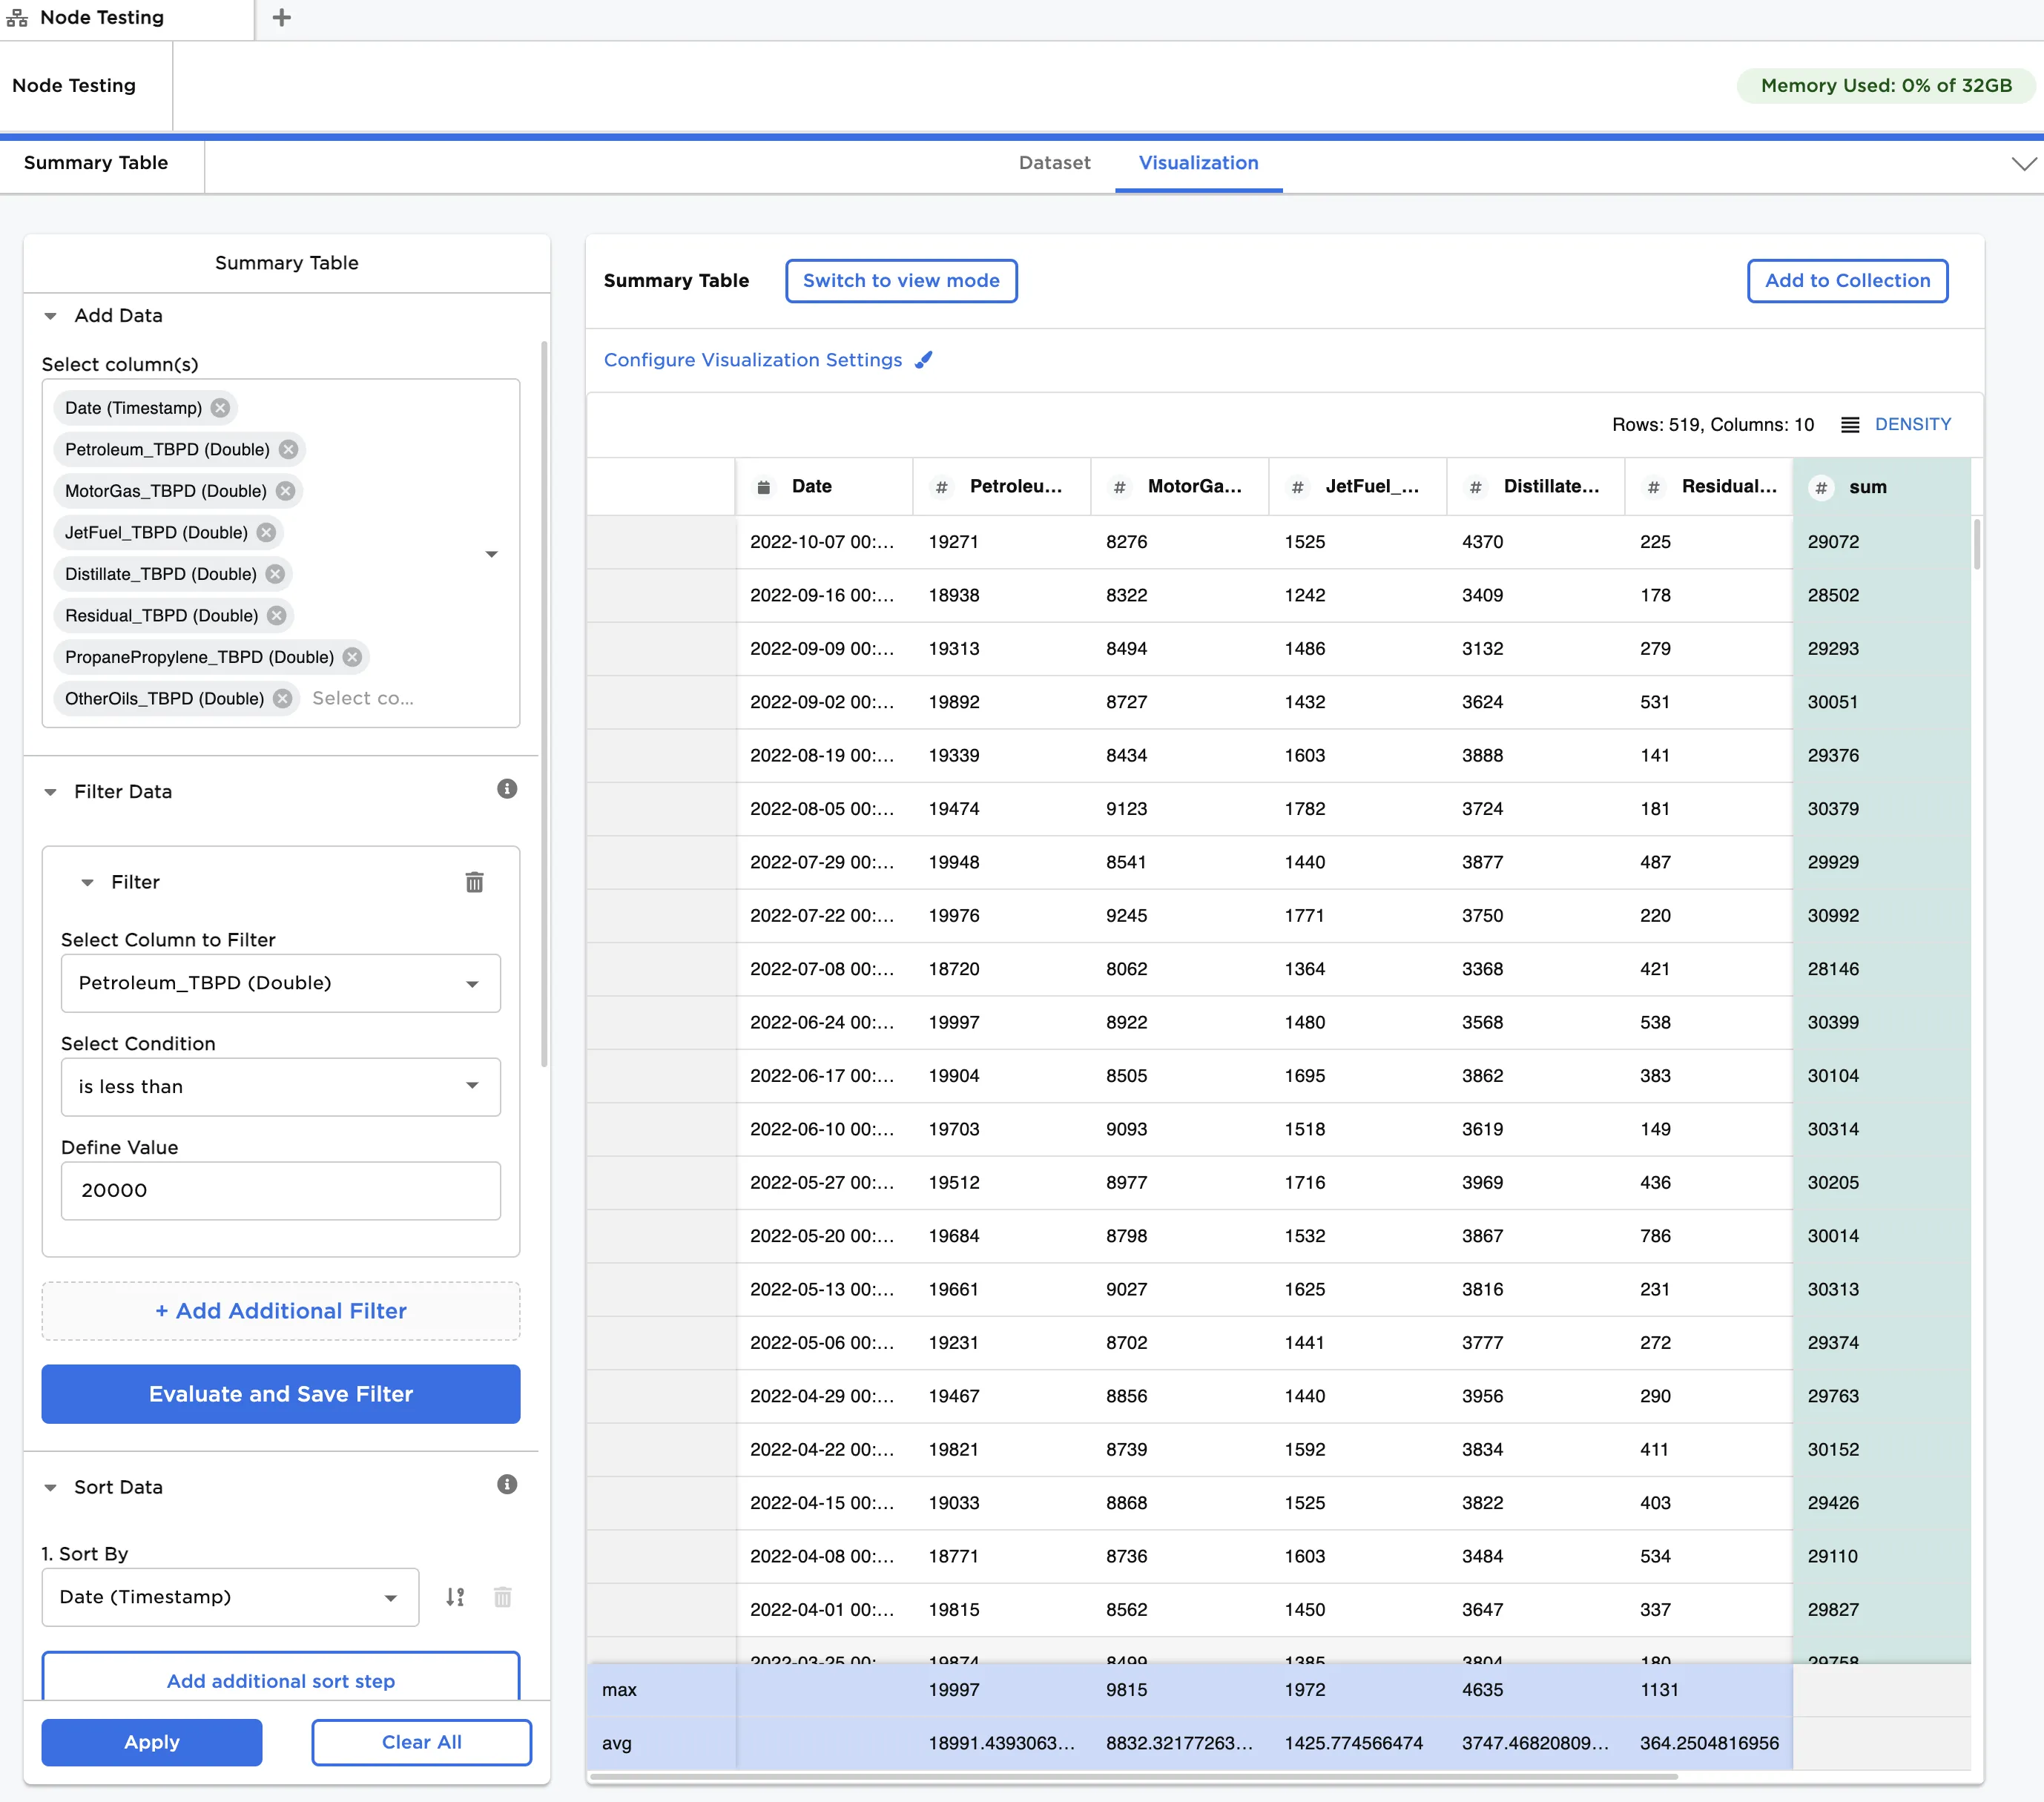
Figure 6: Example summary table with filtering, sorting, row and column aggregation