Graph
Create a graph in Visual Notebooks.
Configuration
| Field | Description |
|---|---|
Name default=Graph | A user-specified node name displayed in the workspace |
| Vertex Groups default=none | Vertex grouping Select the column in the vertices dataset that contains values to use for vertex grouping. |
| Vertex Size default=none | Size of the vertices Select a numeric column that determines the size of the displayed vertices. |
Vertex Label default=id | Label displayed on the vertices By default, the values in the "id" column are used as labels. Select a column from the auto-populated dropdown menu to change the displayed labels. |
| Edge Groups default=none | Edge grouping Select the column in the edges dataset that contains values to use for edge grouping. |
| Edge Weights default=none | Weight of the edge lines Select a numeric column in the edges dataset. The values in this column determine the weight of lines in the graph. |
| Edge Labels default=none | Labels displayed on the edges Select the column in the edges dataset that contains labels for each connection. These are displayed on top of the corresponding connection lines. |
Show edge directionality default=Off | Edge direction Toggle this switch on to display arrows pointing from the source to the destination for each connection. |
Vertex Icons and Pictograms default=Do not show icons or pictograms on vertices | Vertex display options Select "Show icons on vertices", "Show pictograms on vertices", or "Do not show icons or pictograms on vertices". |
| Select column from vertex table with icons default=none | Vertex icons If "Show icons on vertices" is selected in the "Vertex Icons and Pictograms" field above, select the column that contains icon names. Visual Notebooks supports regular style icons from version 5 of Font Awesome. Find available icons on the Font Awesome website. To use an icon, enter its name without the fa- prefix. |
| Select column from vertex table with pictograms default=none | Vertex pictograms If "show pictograms on vertices" is selected in the "Vertex Icons and Pictograms" field, select the column that contains pictograms. Visual Notebooks supports image URLS. |
Graph Timeline default=Do not add a graph timeline. Edges do not have temporal order | Graph timeline options Select whether to show a simple timeline, detailed timeline, or no timeline. |
| Select column from edges table with timestamp for each edge default=none | Timestamp column If "Add simple timeline" or "Add detailed timeline" is selected in the "Graph Timeline" field above, select the column that contains timestamps. If all the columns in the auto-populated dropdown menu appear dimmed, use a "Columns - Type Converter" node to convert the desired column to the timestamp data type. |
Node Inputs/Outputs
| Input | Vertices and edges data from an Assemble Graph node |
|---|---|
| Output | A Graph in Visual Notebooks |
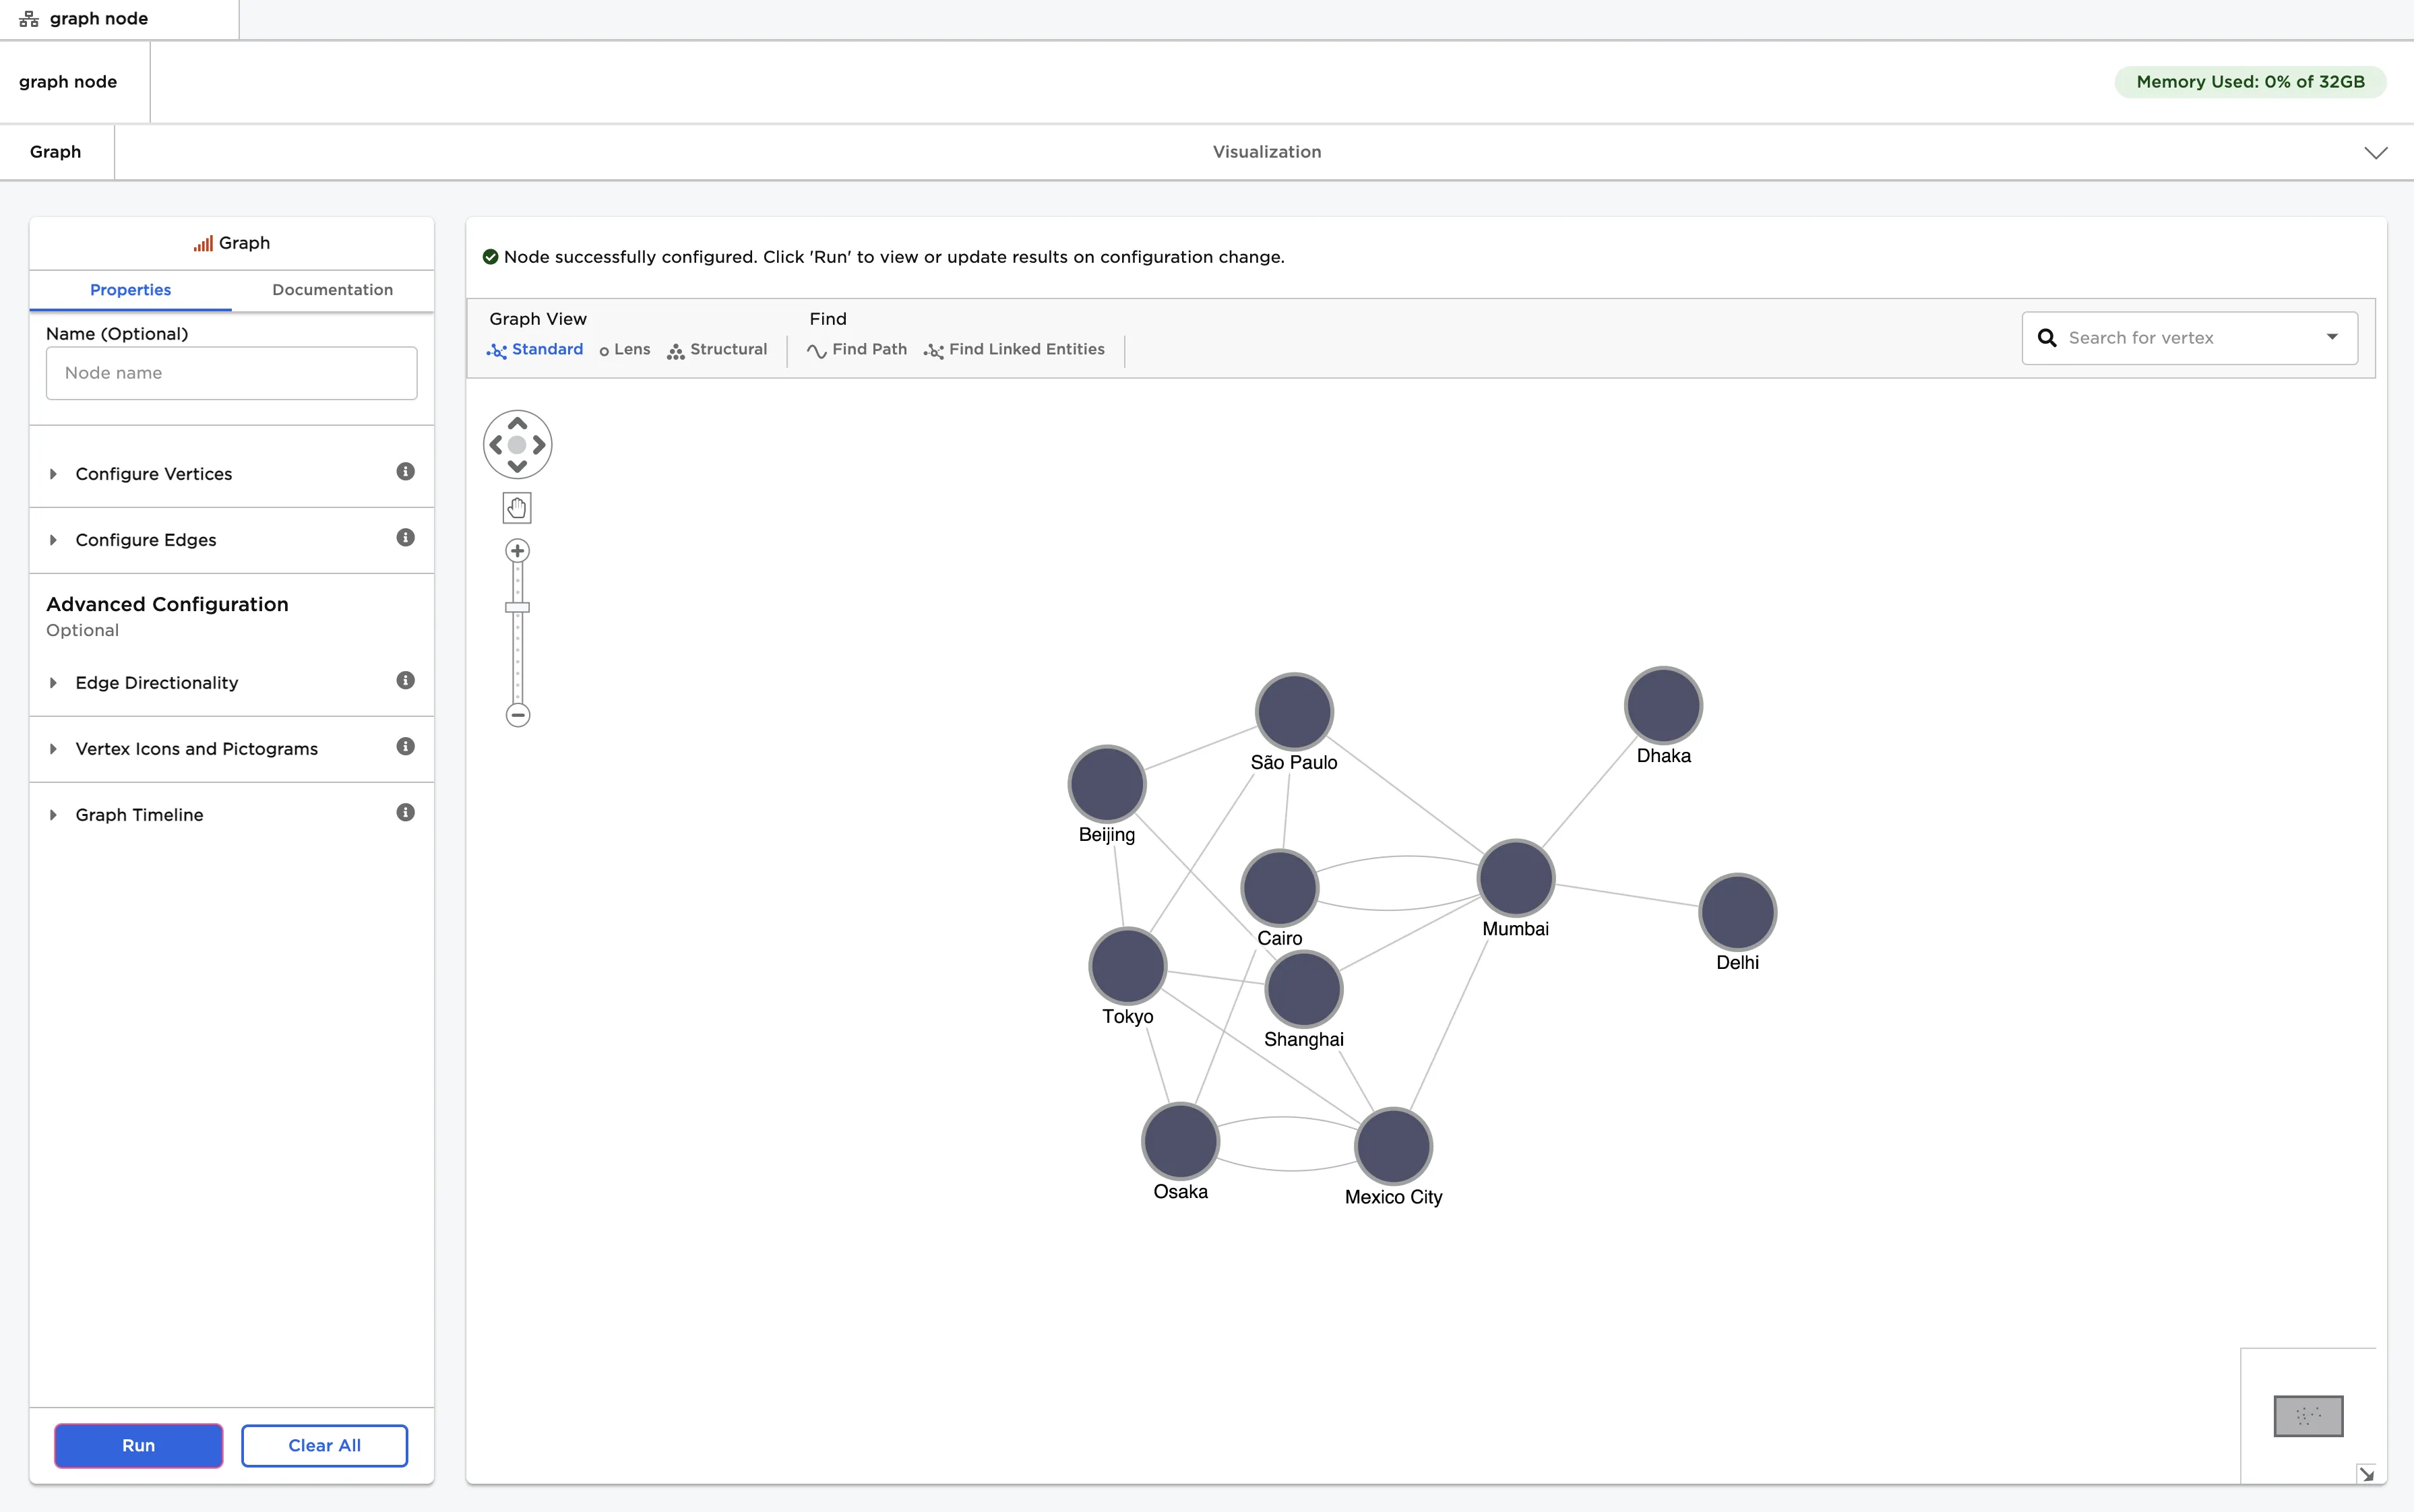
Figure 1: Example output
Examples
- Connect a Graph node to an existing Assemble Graph node.
- The data shown below is a fictional record of purchases and deliveries across the world's most populated cities. It has been formatted with the Assemble Graph node and is used in this example.
- The vertices data contains a list of cities, countries, population, the name of a supported Font Awesome icon, and a link to an image.
- The edges data contains order numbers, a source and destination location, price, payment method, and delivery date.
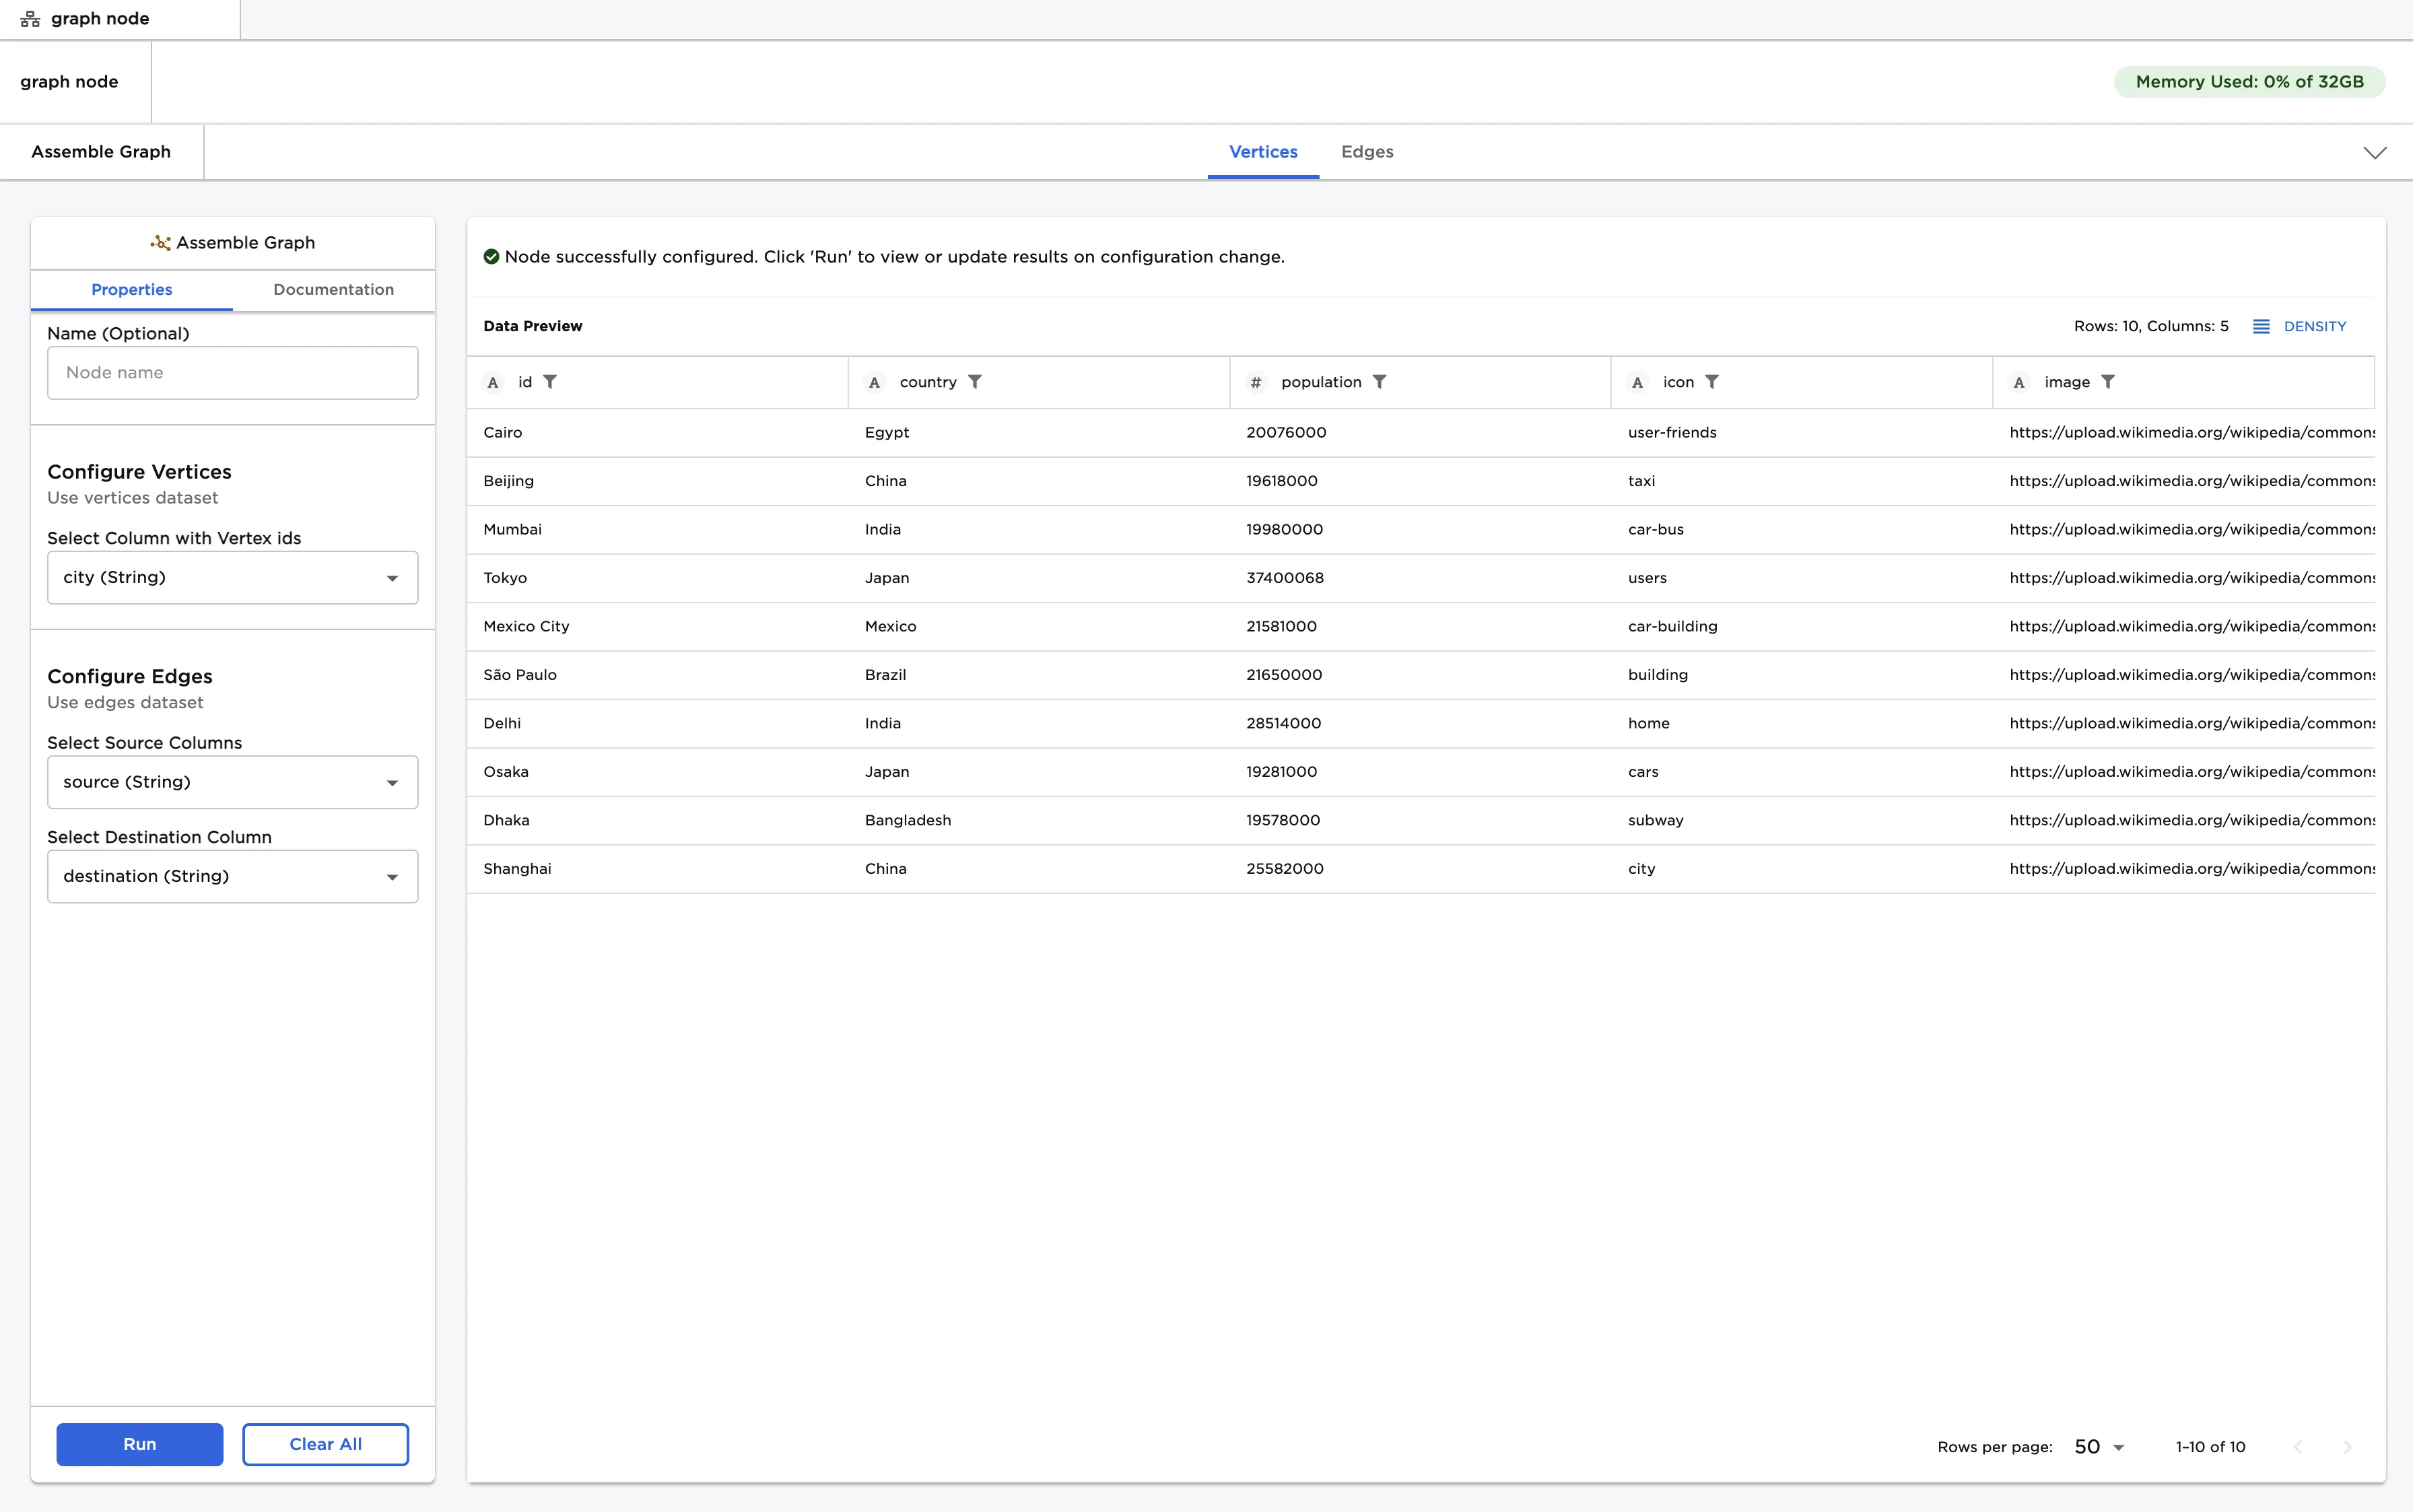
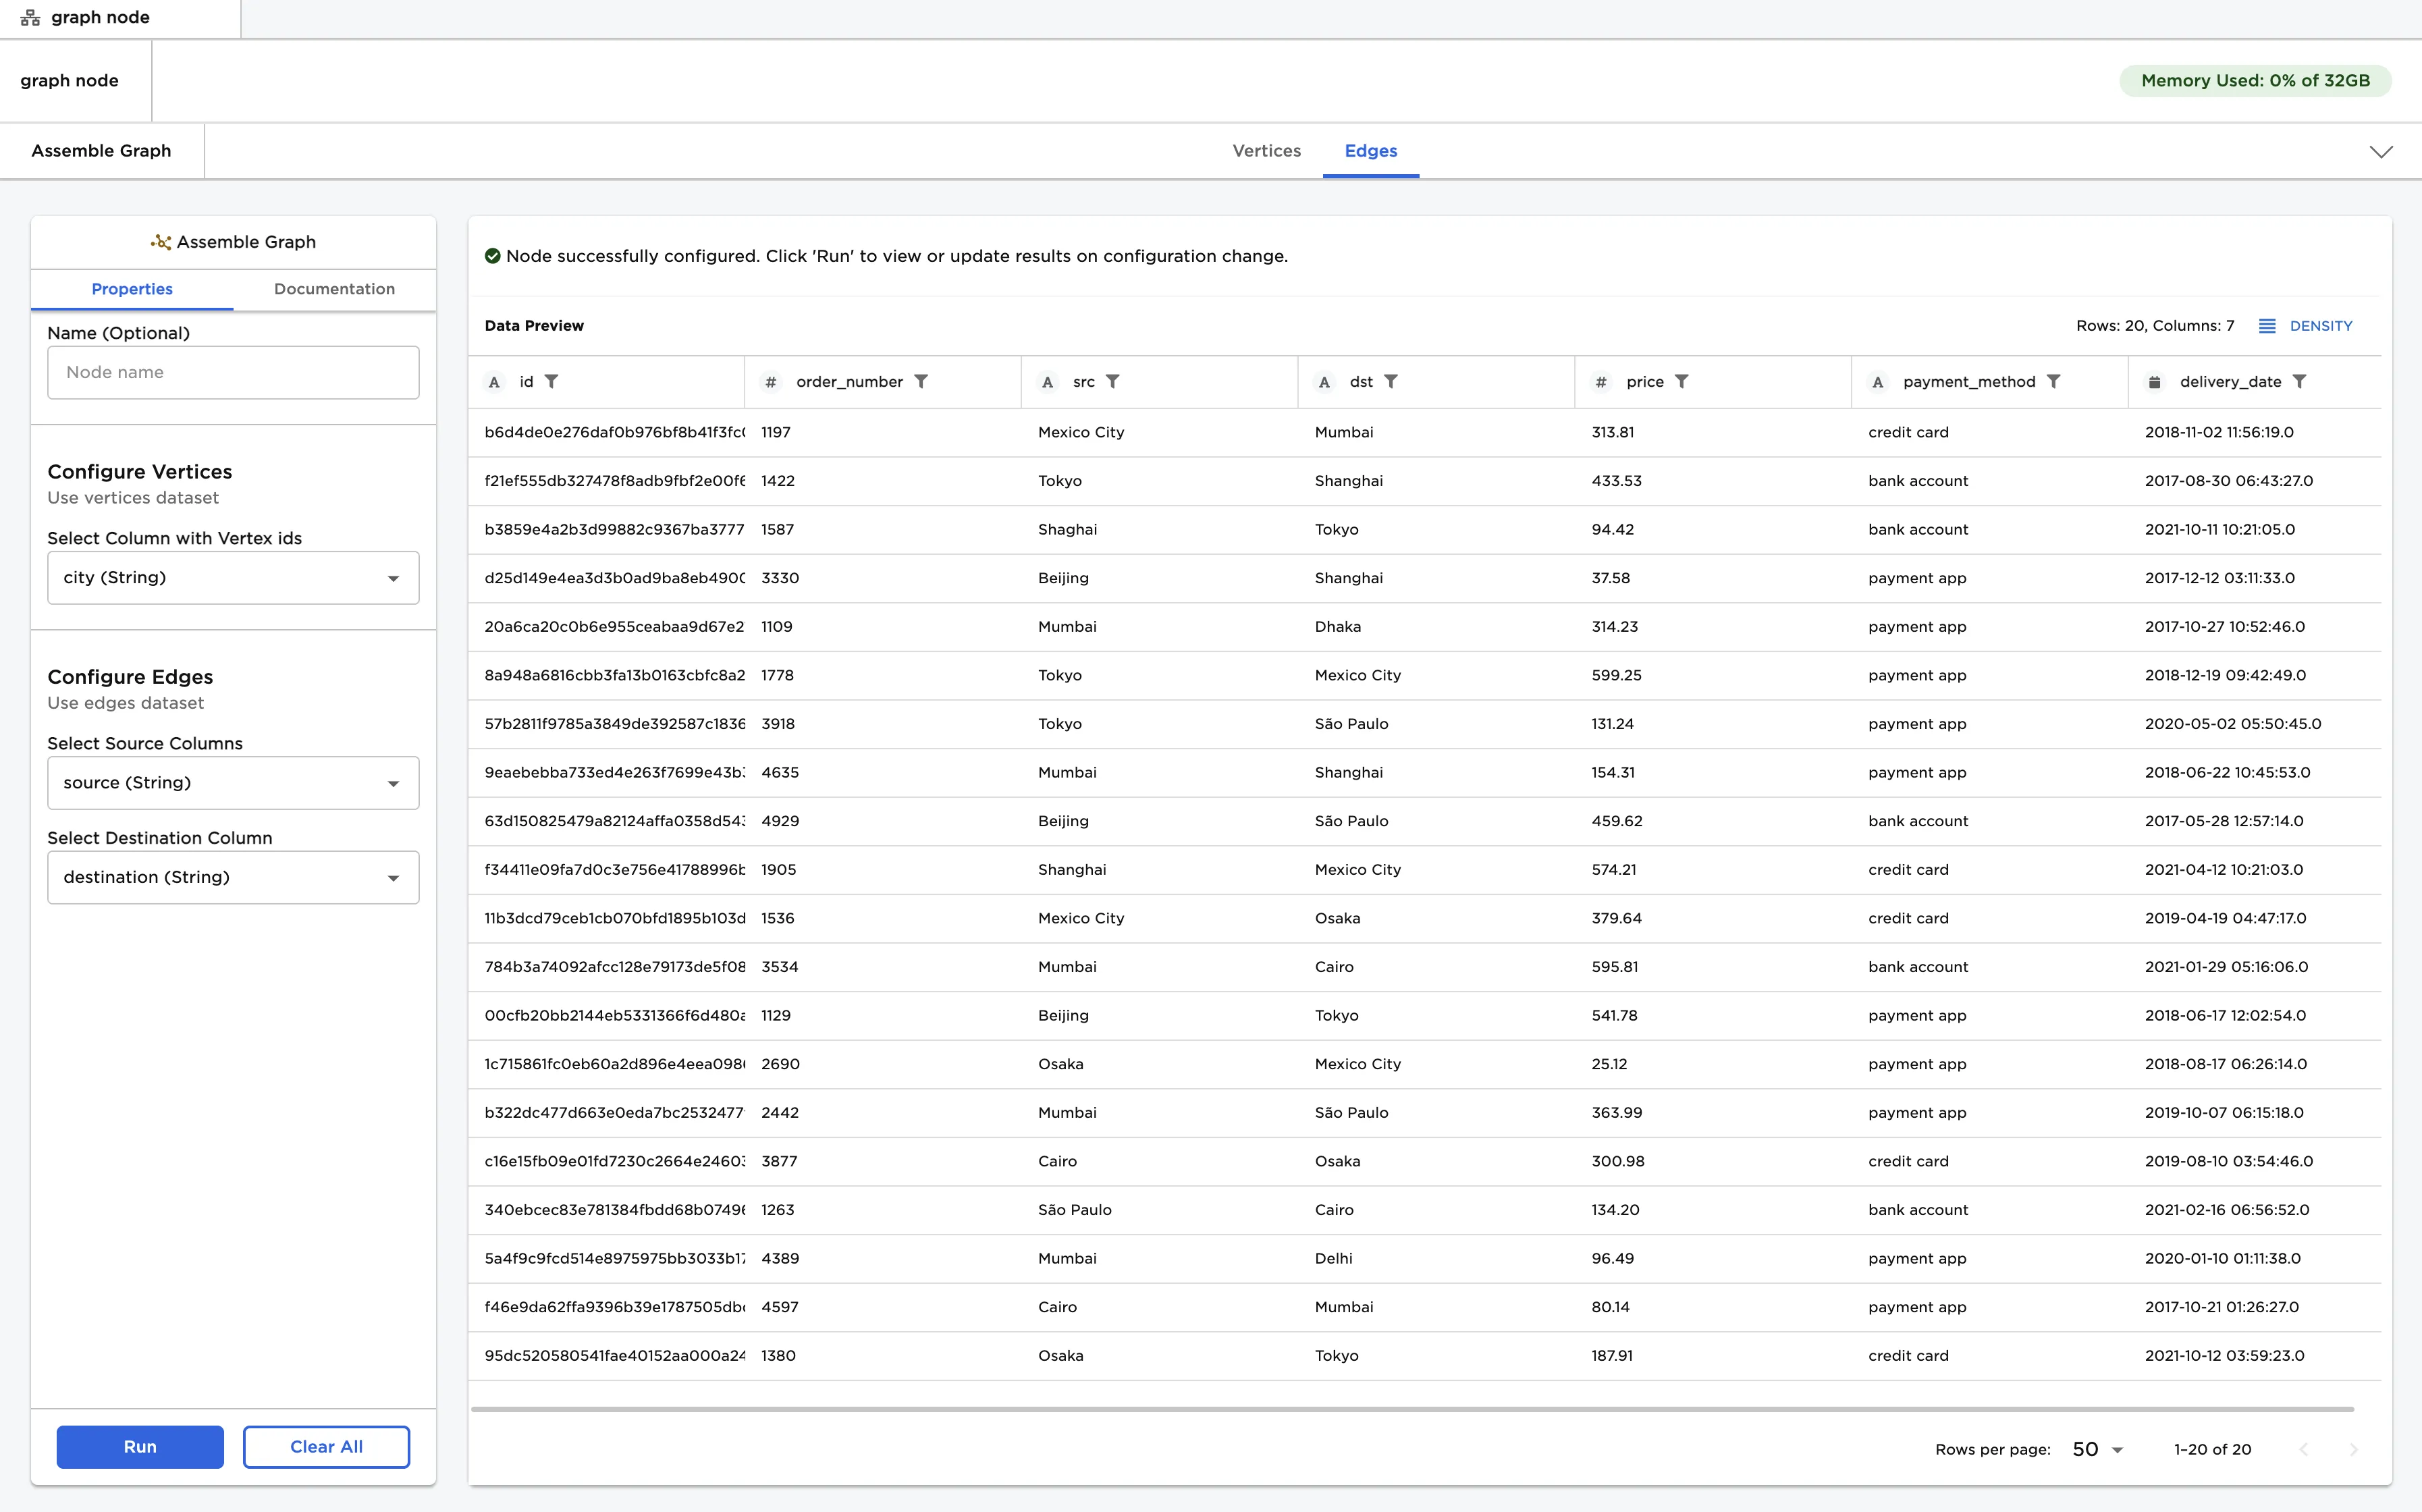
Figure 2: Example input from an Assemble Graph node
- Select "Run" to create a graph with the default settings
- Notice that there are three graph views: standard, lens, and structural. In standard view, edges are a similar size, vertices are distributed evenly, and there is as little overlap as possible. Structural view is similar, although vertices with similar attributes are grouped together in fans. In lens view, highly-connected vertices are in the center of the graph, while vertices with fewer connections are pushed to the outside.
Figure 3: Example graph with default settings
- The graph interface is interactive. You can select a specific vertex to see more information about it, or move it to a new position on the graph.
- Select "Find Path" to find the path between two vertices, or select "Find Linked Entities" to find all vertices linked to a specific vertex.
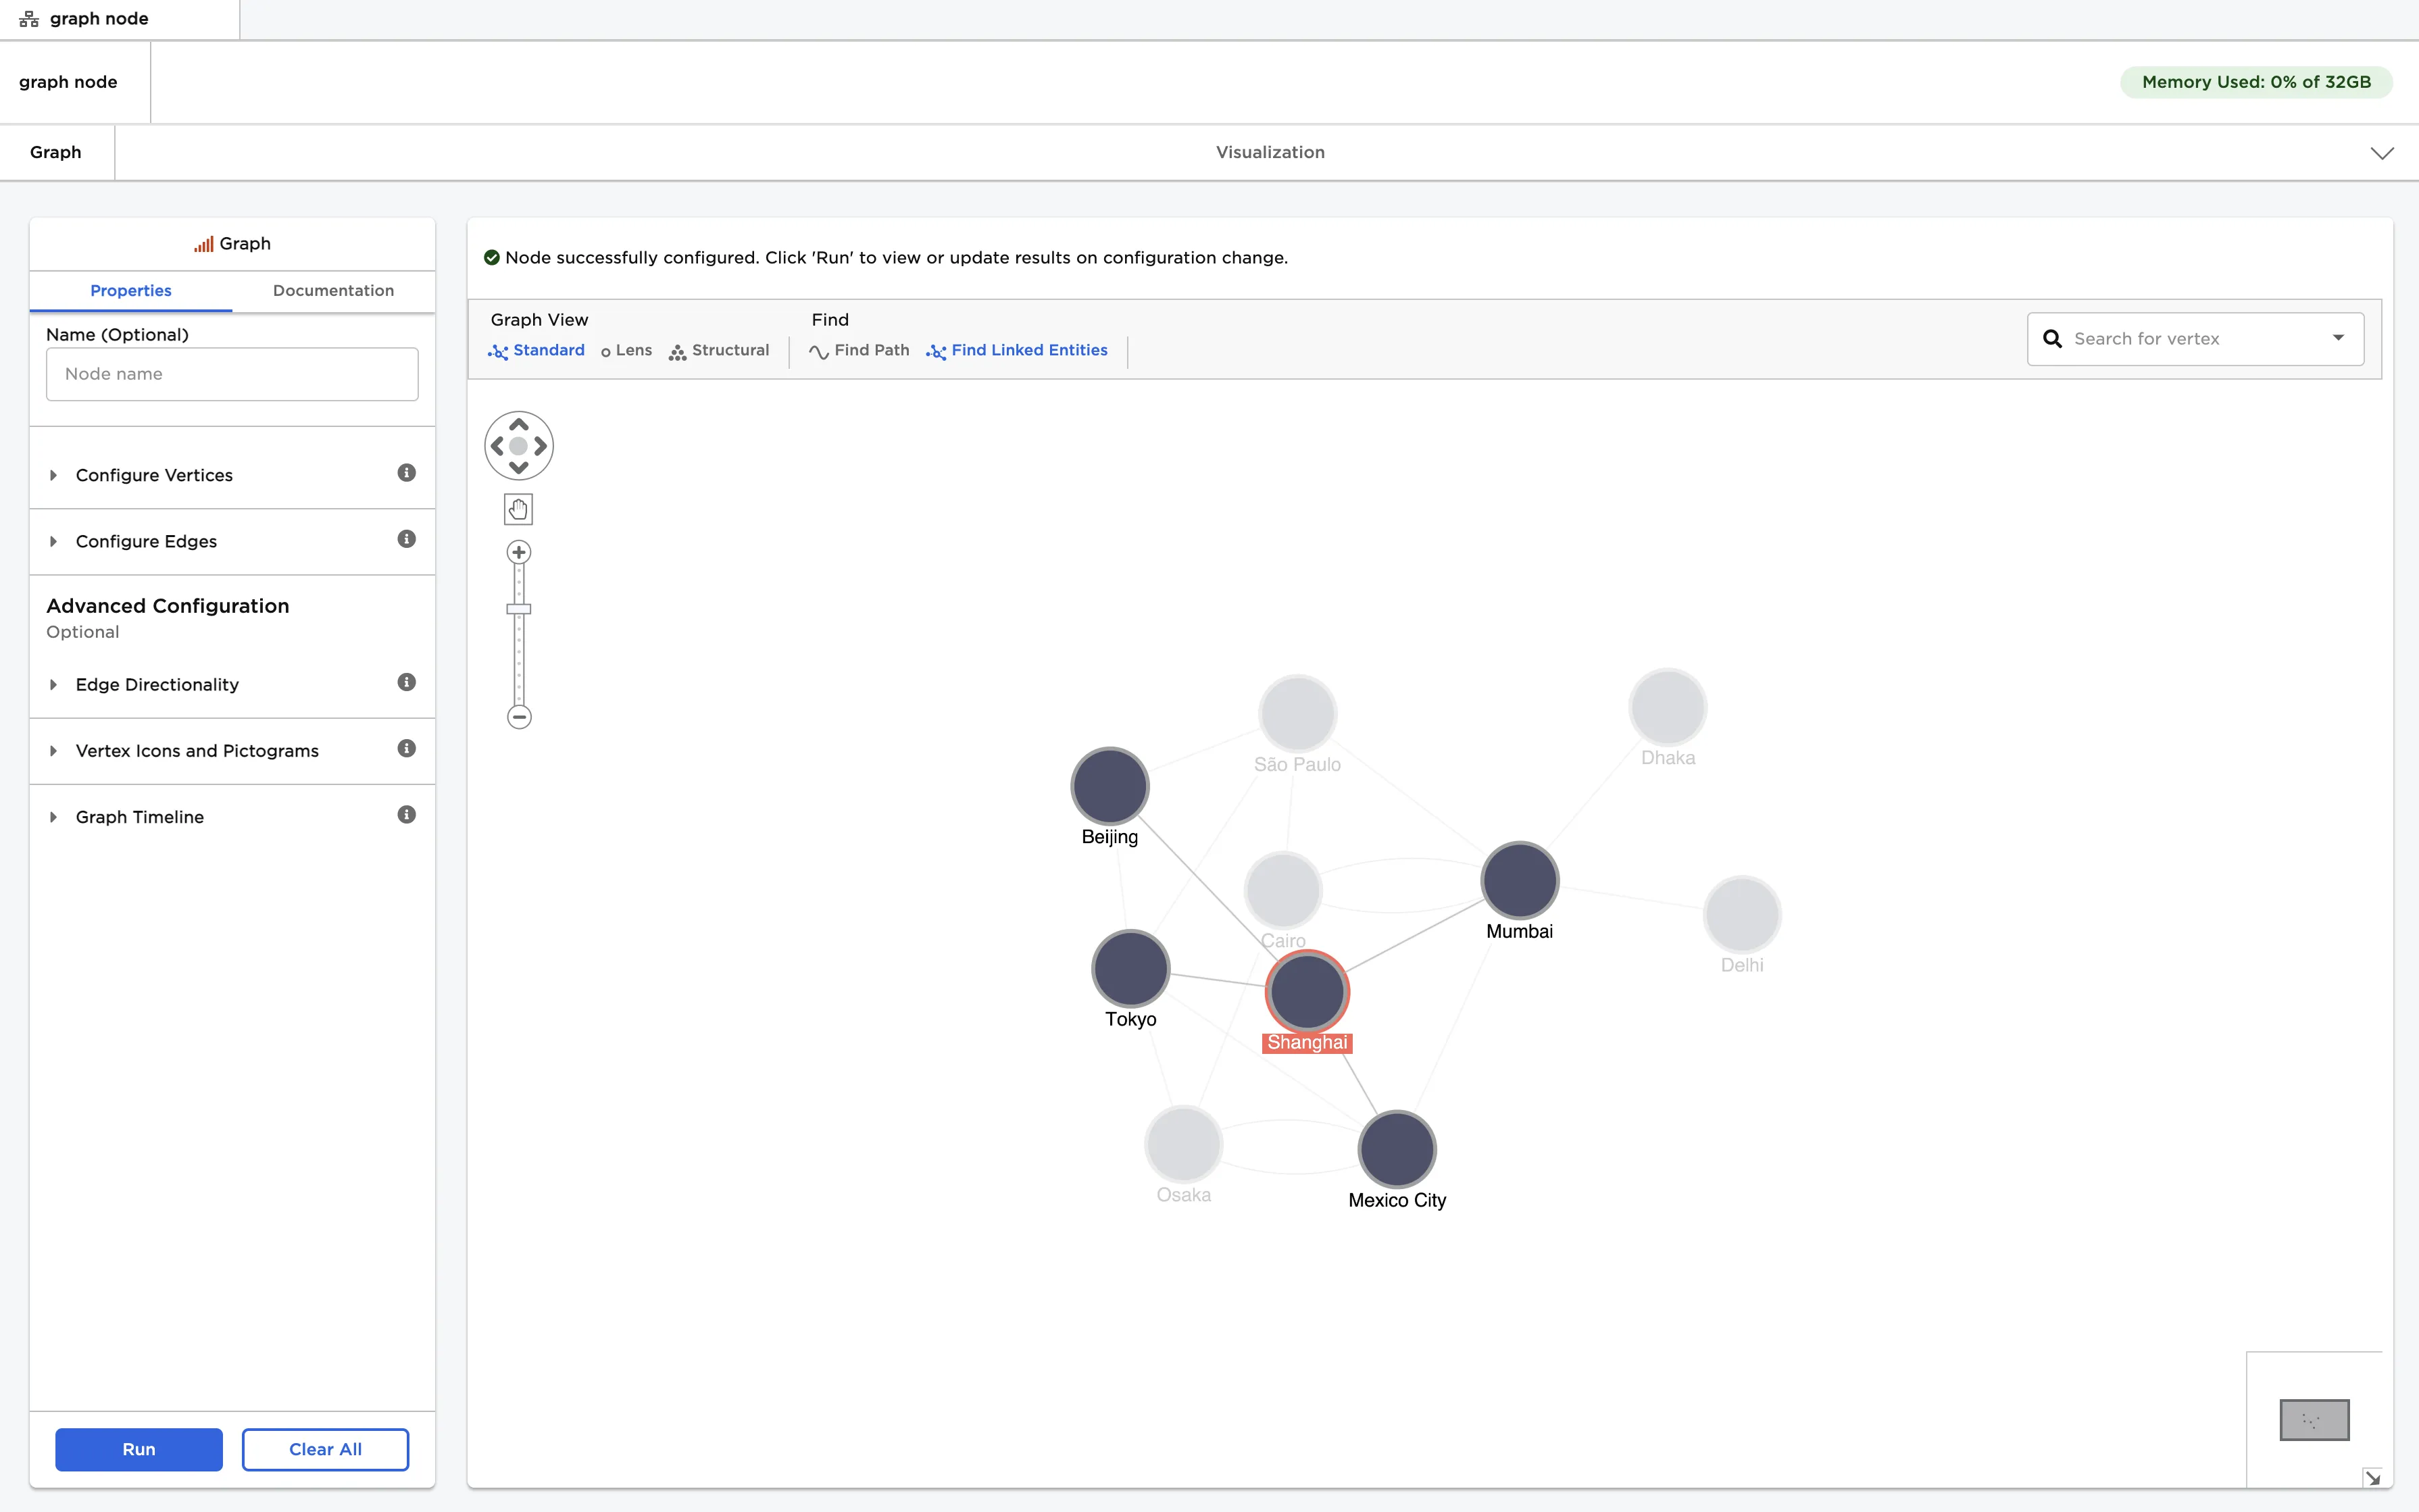
Figure 4: Find linked entities in a graph
- Select "country" for the "Vertex Groups" field and select "population" for the "Vertex Size" field.
- Select "Run" to create a graph.
- Notice that cities with larger populations are displayed on the graph as larger circles. Vertices are color-coded by country. Clear the checkmark for specific countries in the legend to hide vertices in that group.
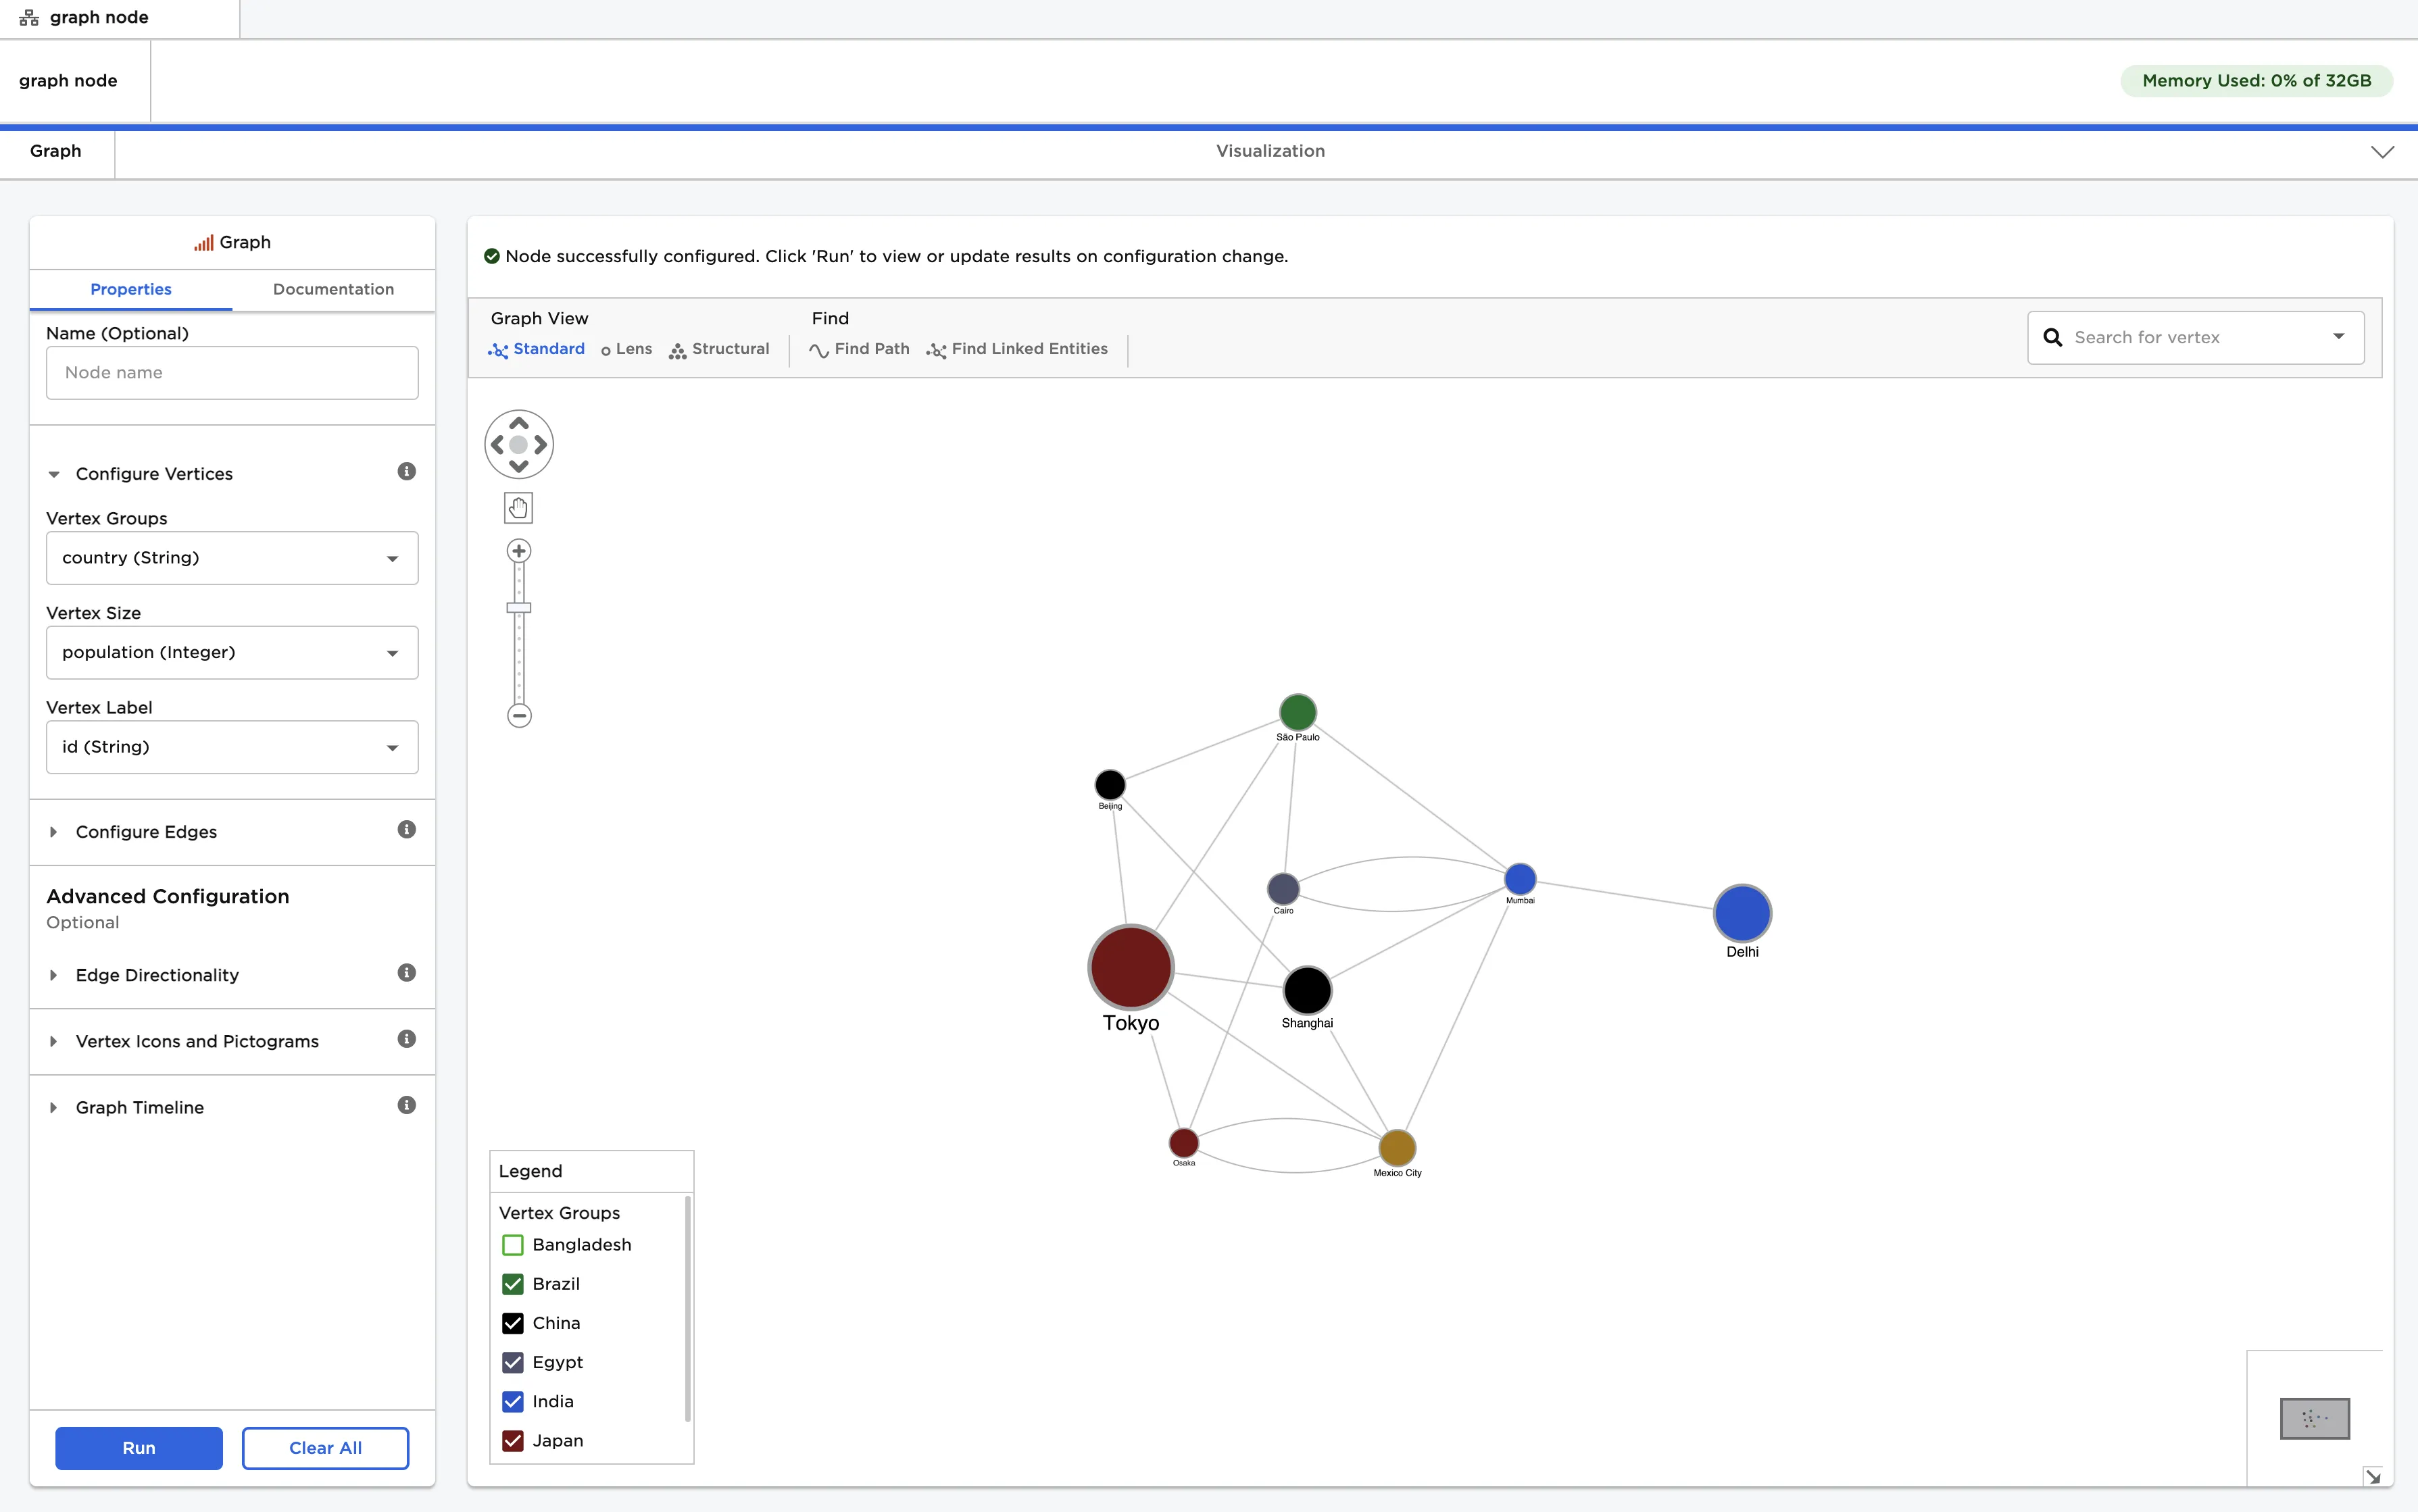
Figure 5: Example vertex configuration
- Clear the fields that were configured above.
- Select "payment_method" for the "Edge Groups" field, "price" for the "Edge Weights" field, and "order_number" for the "Edge Labels" field.
- Toggle the "Edge Directionality" switch on.
- Select "Run" to create a graph.
- Notice that edges are represented as arrows pointing from the source to the destination. Edges are labeled with the order number and weighted according to the price of the transaction. Edges are also color-coded by payment method. Clear the checkmark for a specific payment method to hide edges in that group.
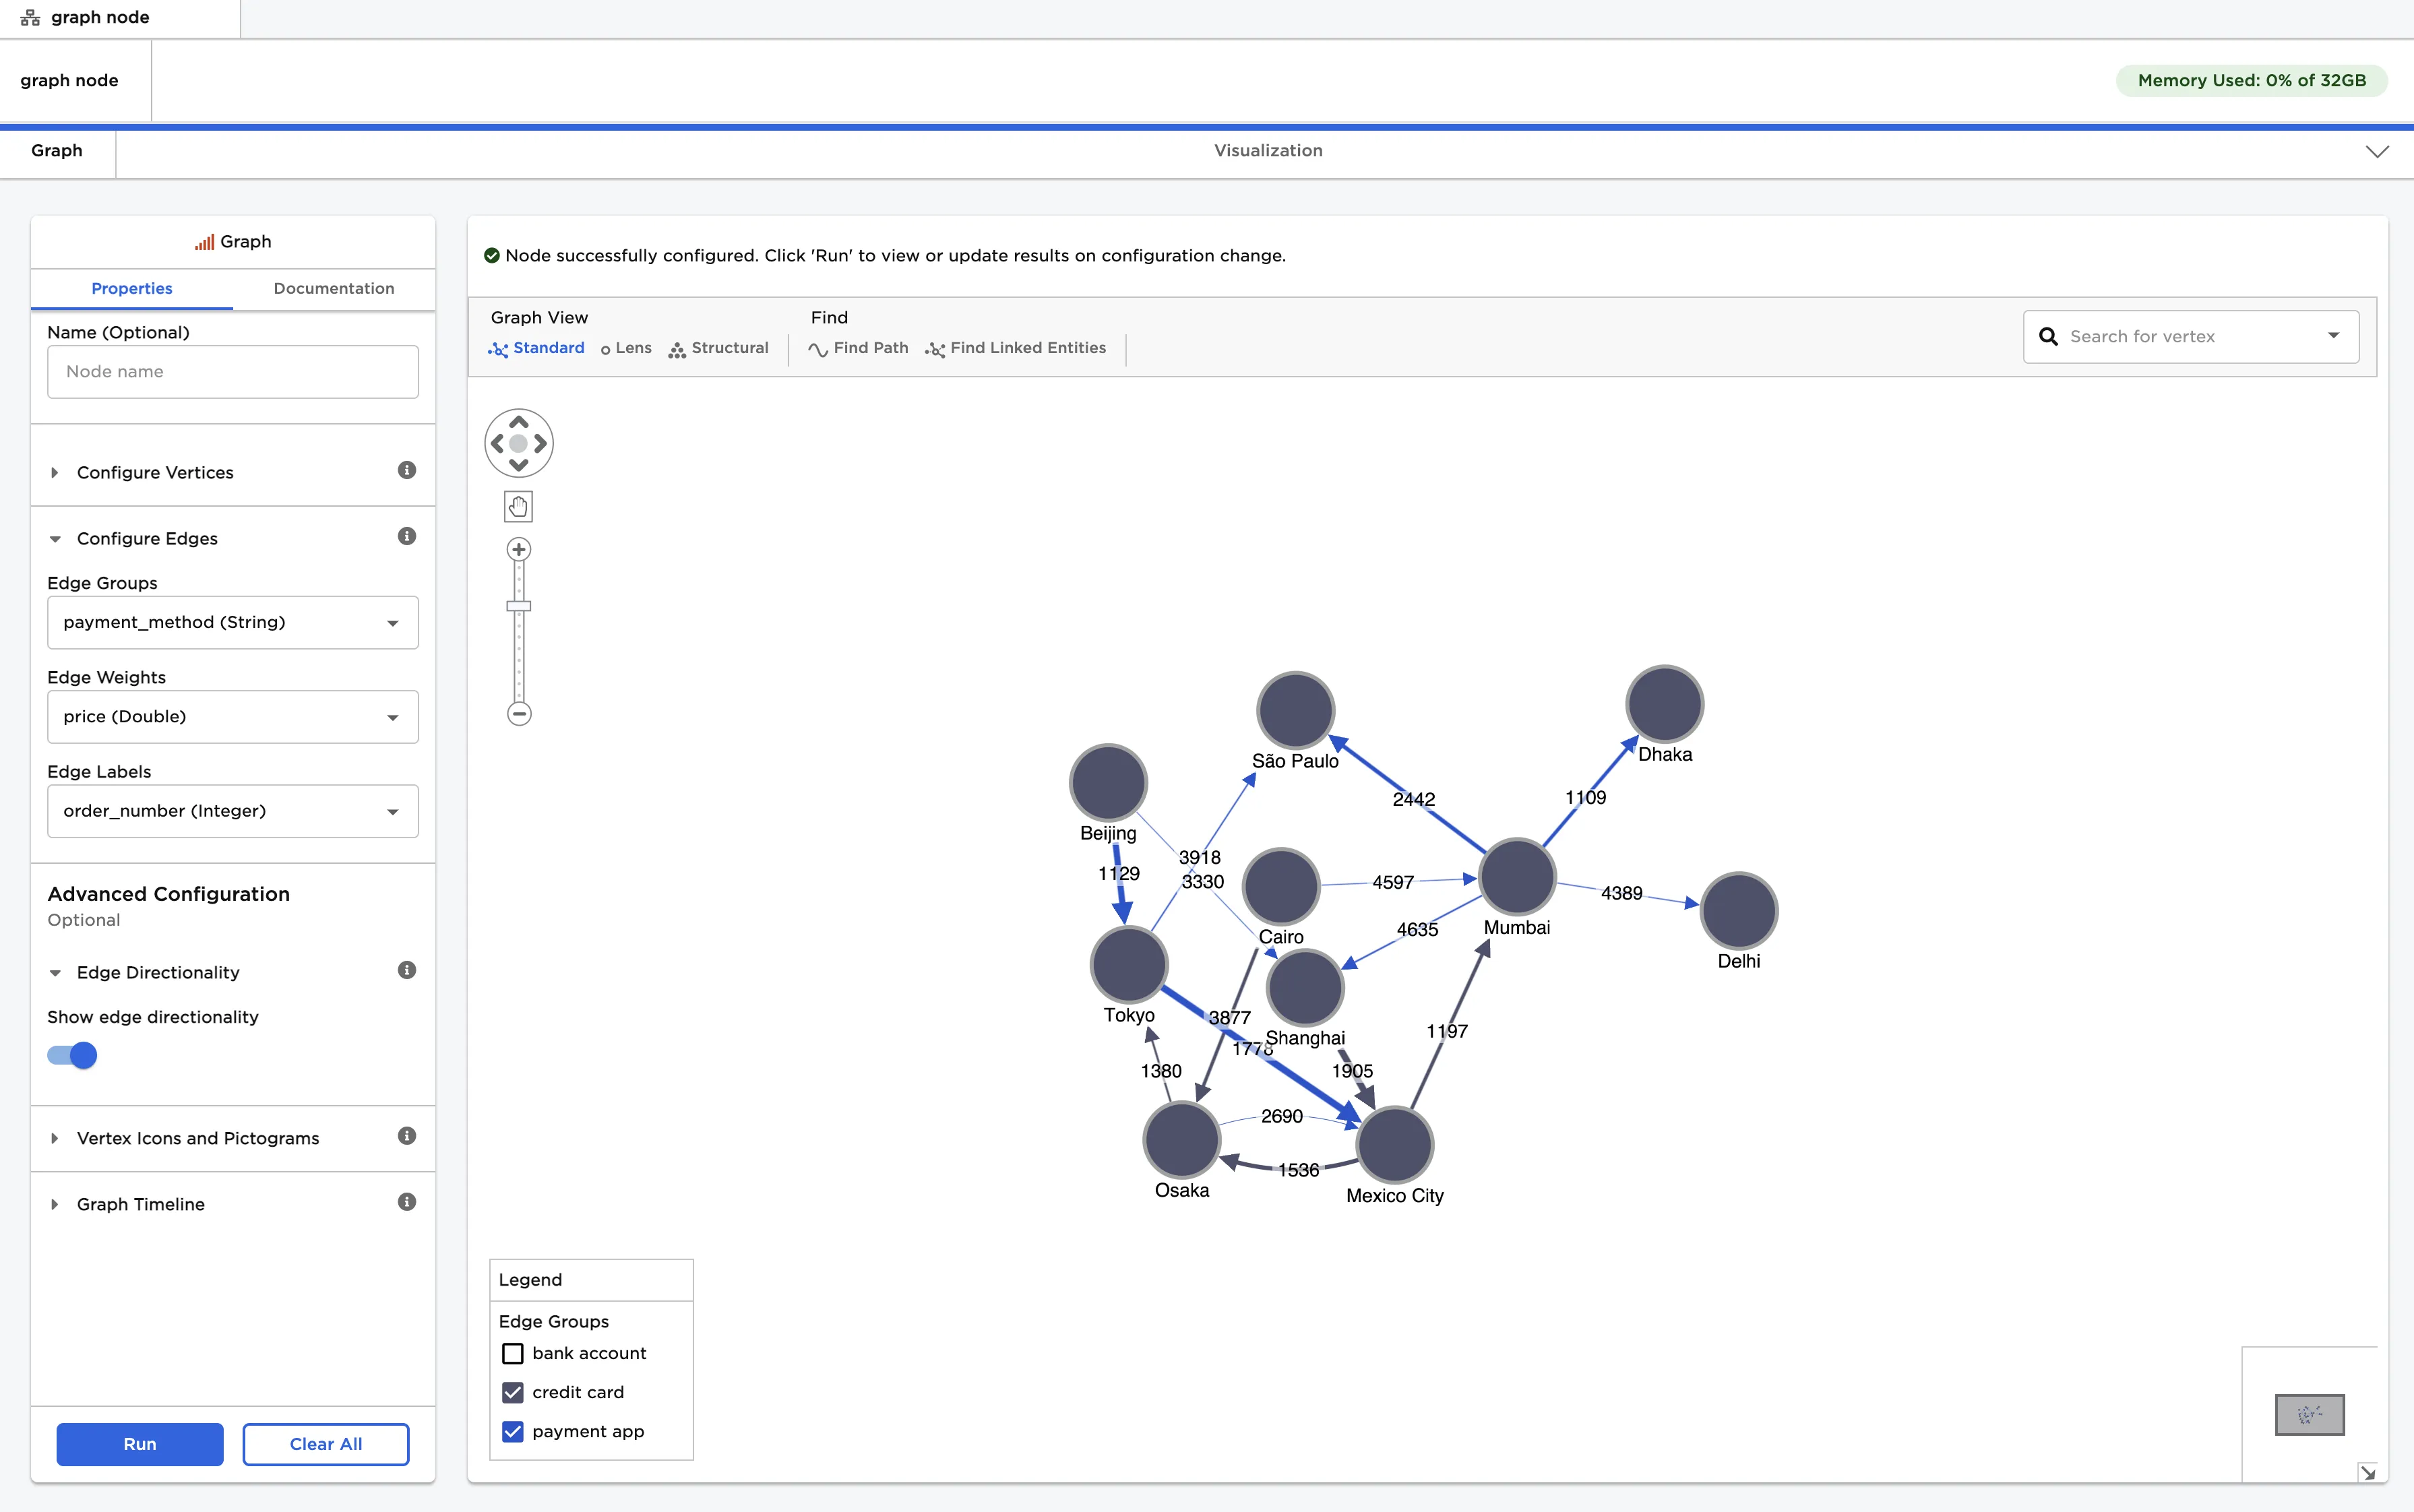
Figure 6: Example edge configuration
- Clear the fields that were configured above.
- Select "Show icons on vertices"
- Select "icon" for the "Select column from vertex table with icons" field.
- Select "Run" to create a graph.
- Note that Visual Notebooks supports regular style icons from version 5 of Font Awesome. Find available icons on the Font Awesome website. To use an icon, enter its name without the
fa-prefix.
- Note that Visual Notebooks supports regular style icons from version 5 of Font Awesome. Find available icons on the Font Awesome website. To use an icon, enter its name without the
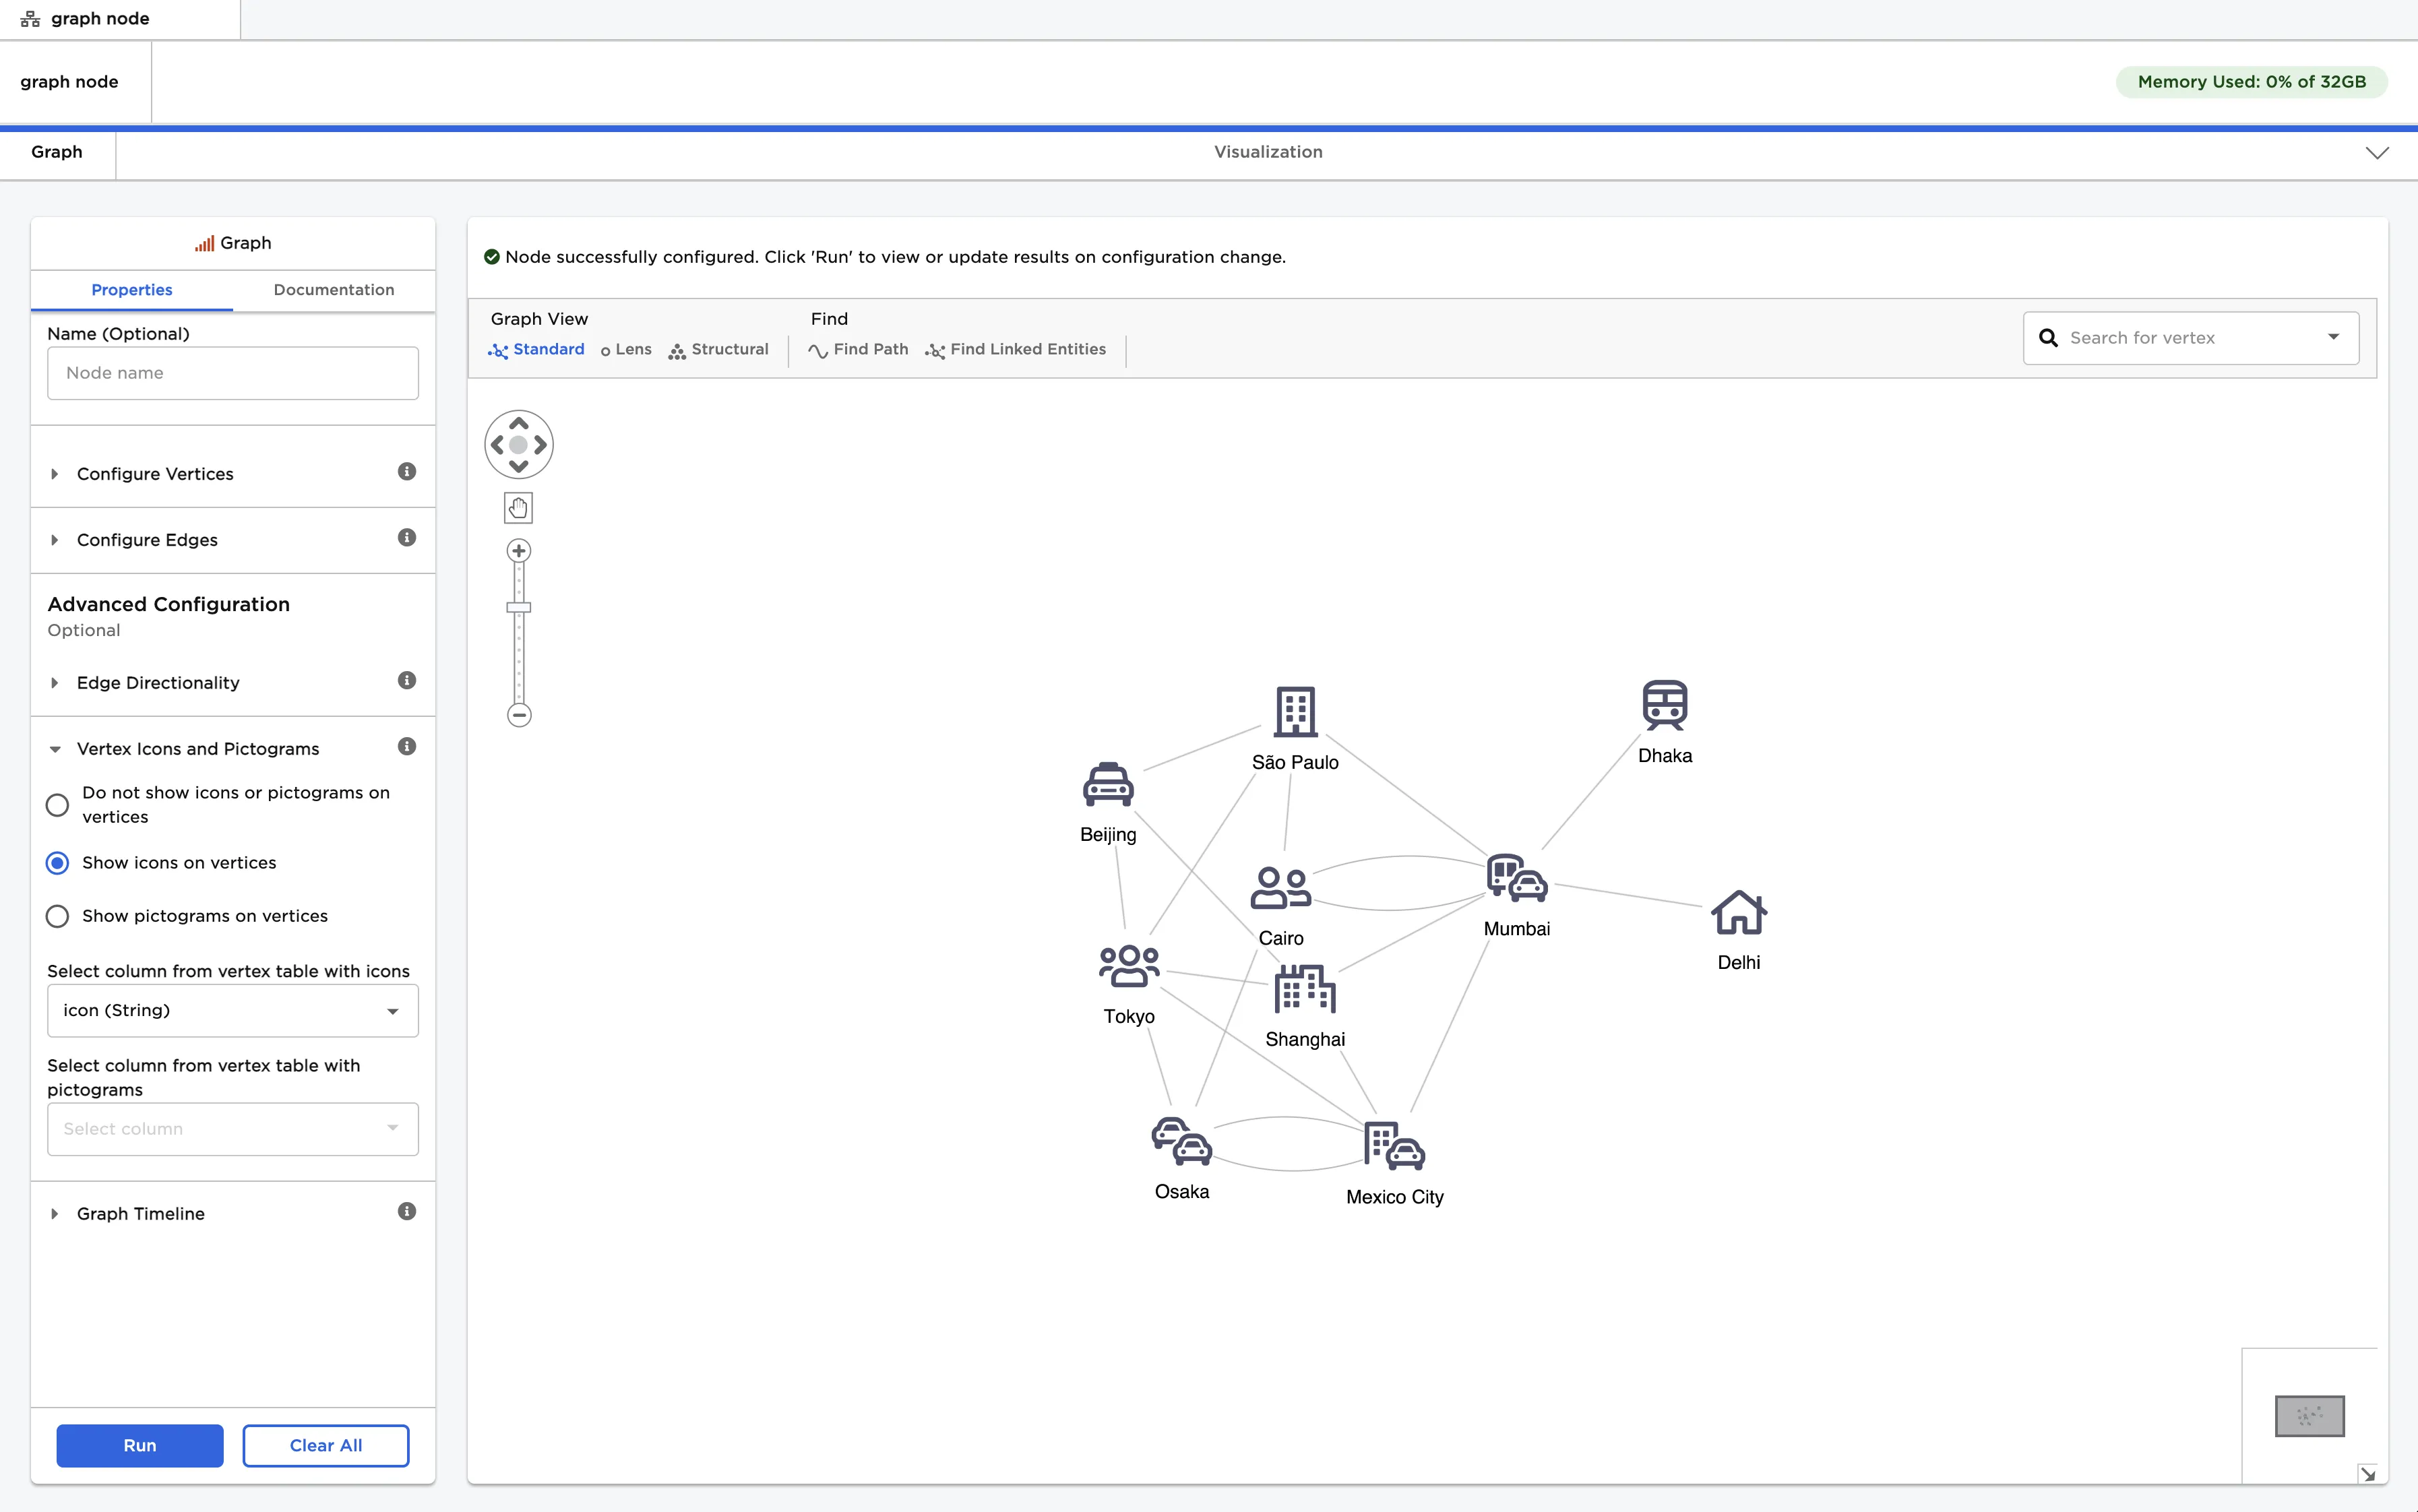
Figure 7: Example graph with icons
- Clear the fields that were configured above.
- Select "Show pictograms on vertices"
- Select "image" for the "Select column from vertex table with pictograms" field.
- Select "Run" to create a graph.
- Note that Visual Notebooks supports image URLs.
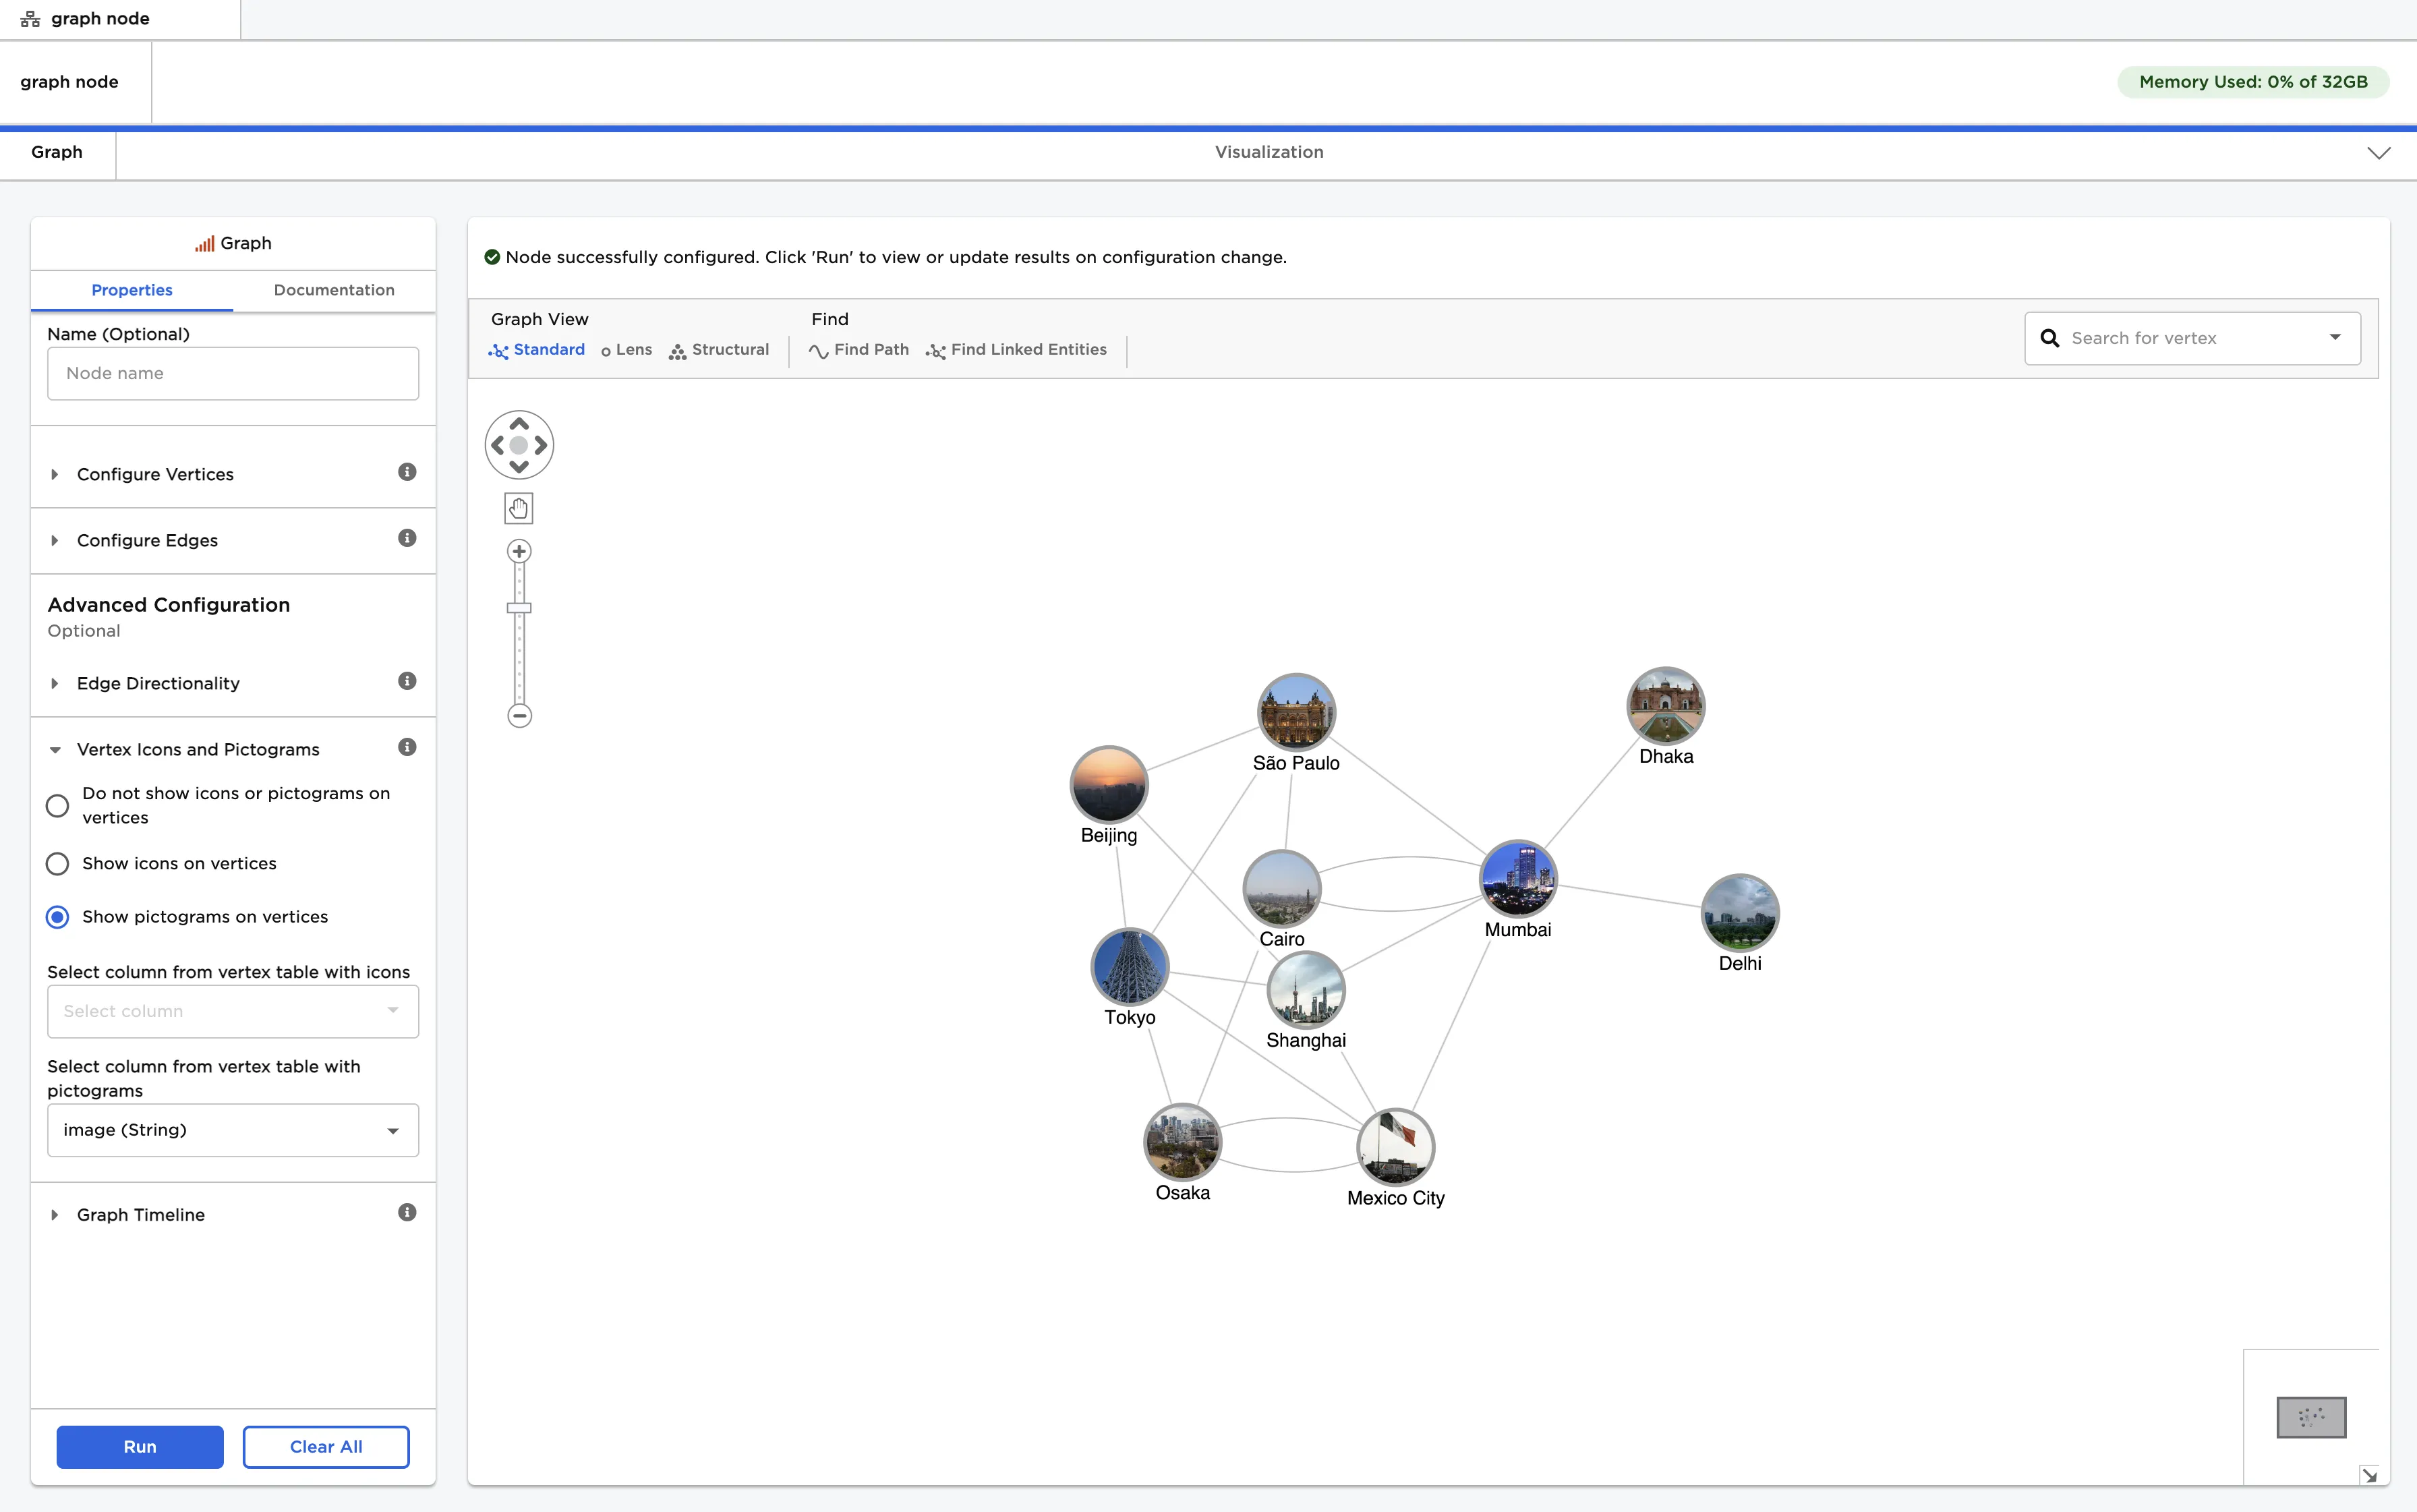
Figure 8: Example graph with pictograms
- Clear the fields that were configured above.
- Select "Add simple timeline bar. Filter graph by timeline range".
- Select "delivery_date" for the "Select column from edges table with timestamp for each edge" field.
- Select "Run" to create a graph.
- Notice that there is a collapsible timeline at the bottom of the graph. Drag the white shaded bar on either side of the timeline to focus on a specific period of time.
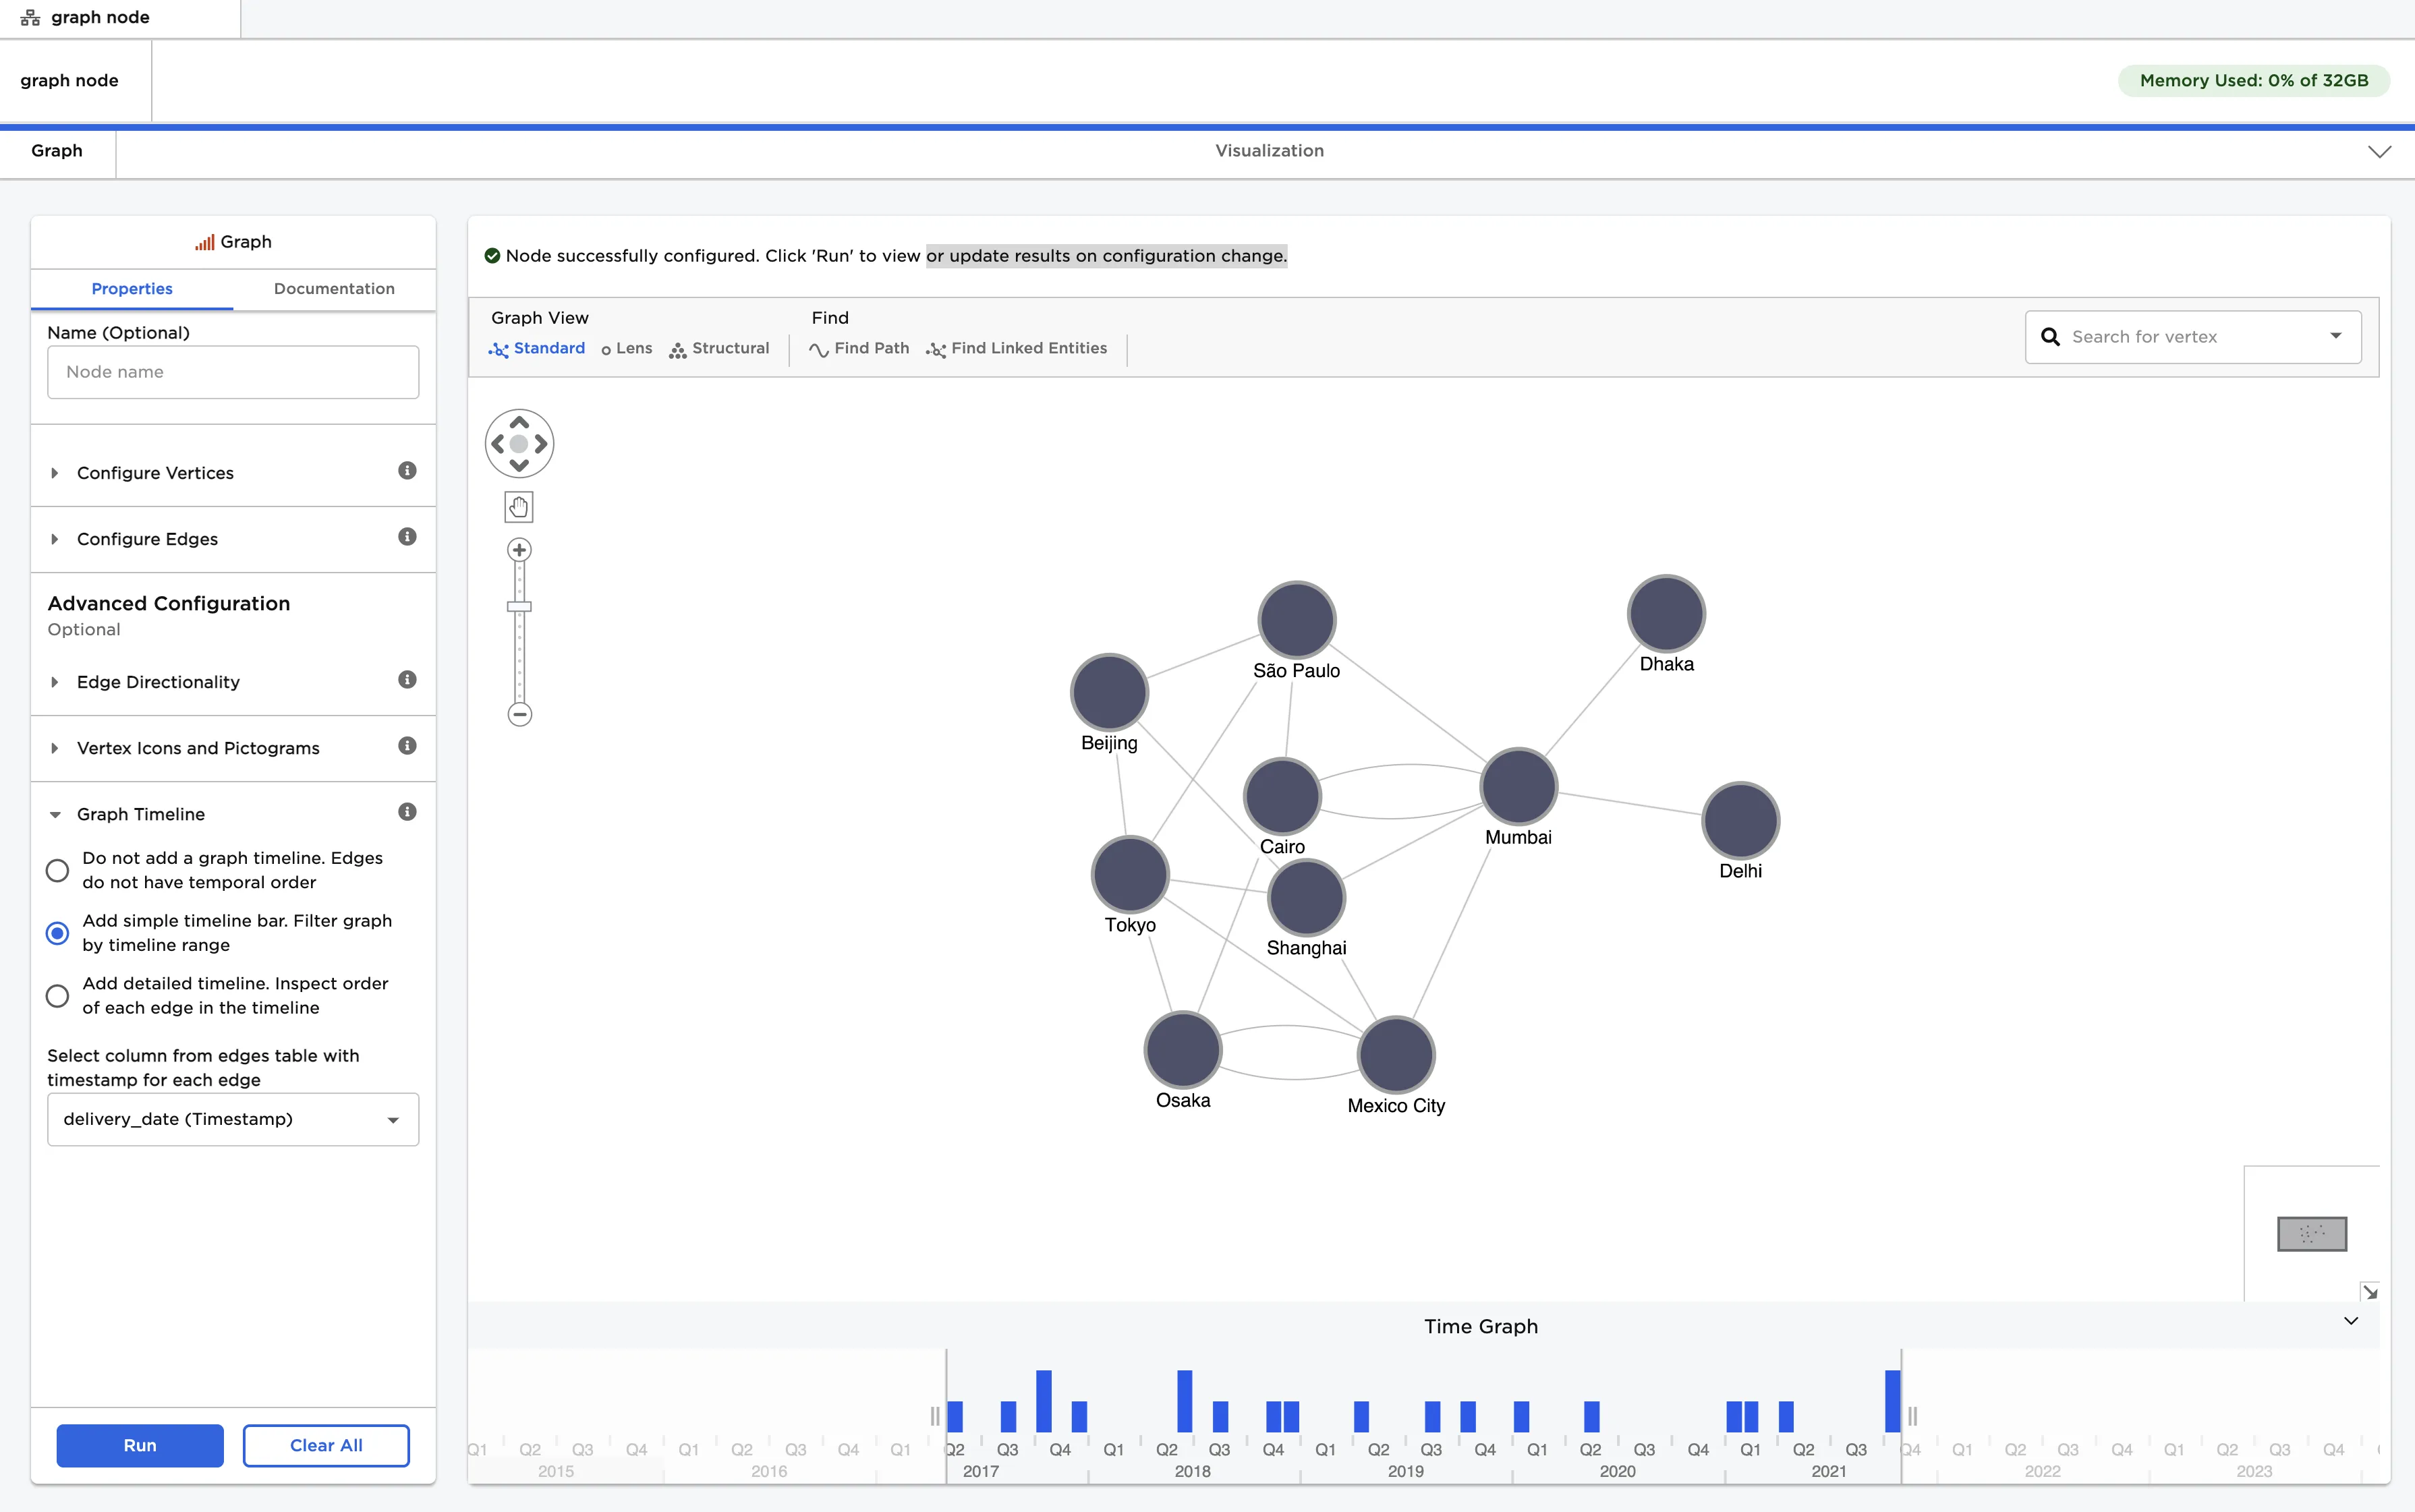
Figure 9: Example graph with a simple timeline
- Clear the fields that were configured above.
- Select "Add detailed timeline. Inspect order of each edge in the timeline".
- Select "delivery_date" for the "Select column from edges table with timestamp for each edge" field.
- Select "Run" to create a graph.
- Notice that there is a detailed timeline to the left of the graph. Zoom in to focus on a specific period of time. Select the target icon next to a label in the graph to examine the edges associated with that vertex. Select the pin icon to keep that vertex shown in the timeline when zooming in on different time periods.
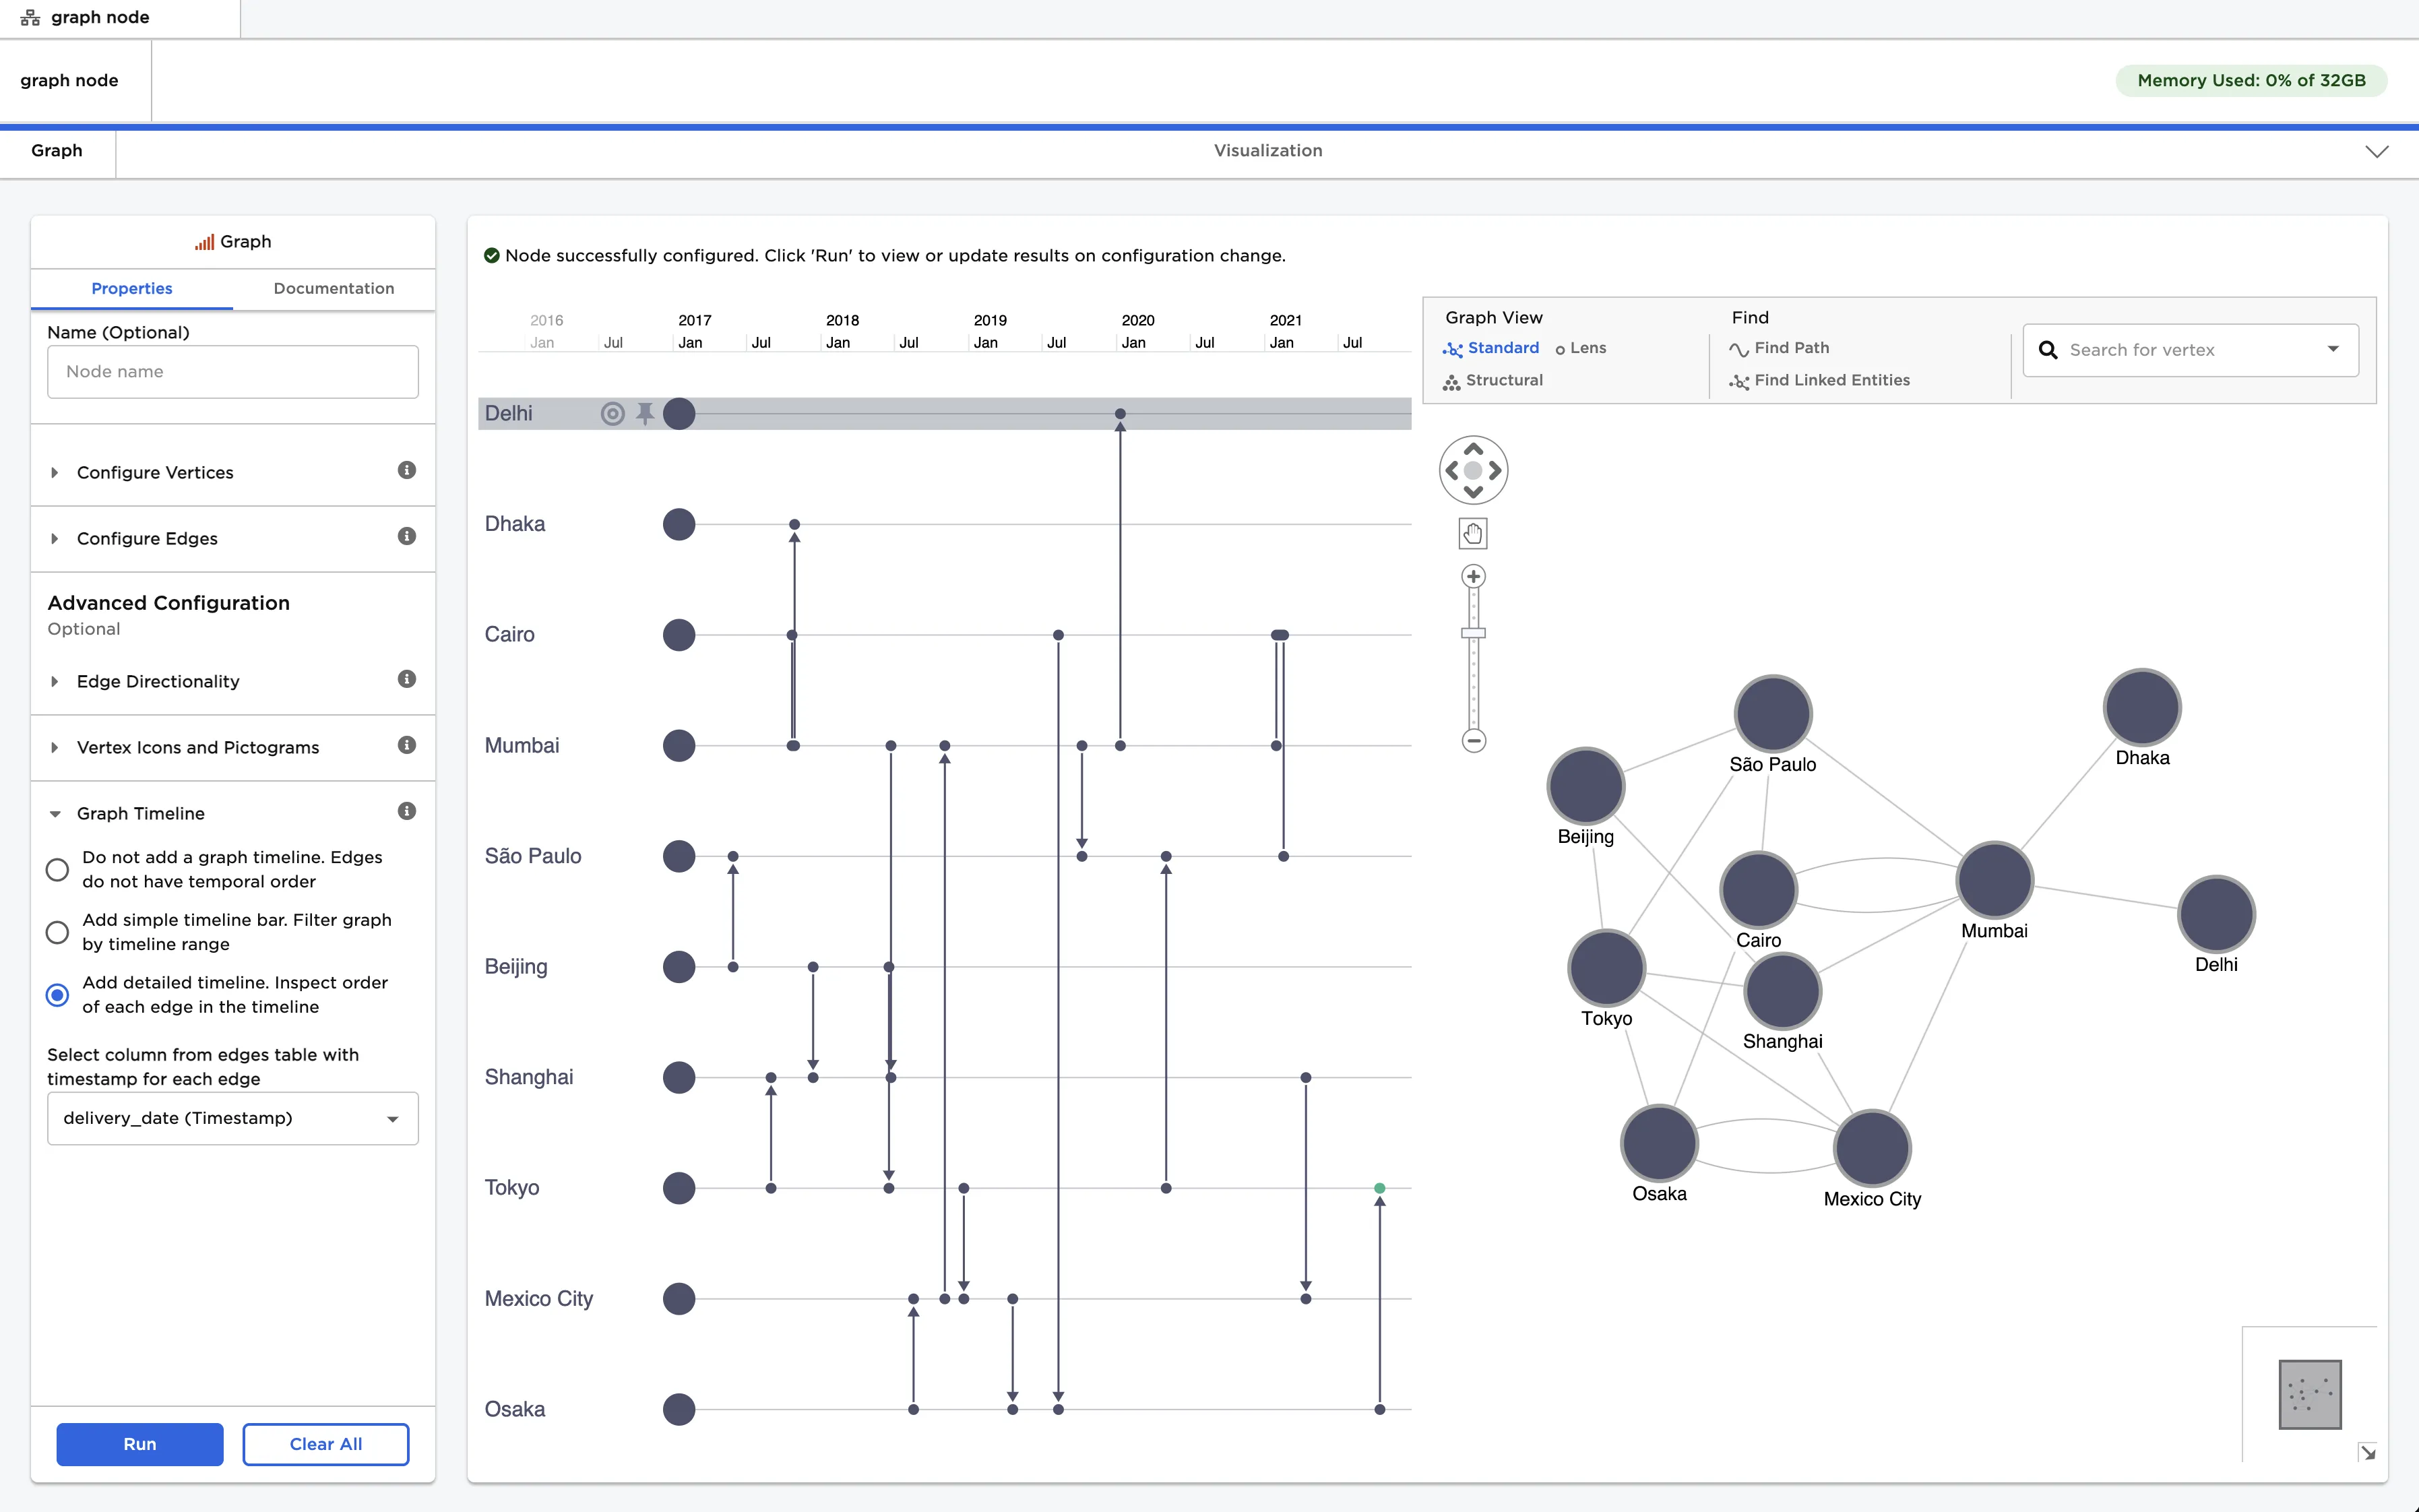
Figure 10: Example graph with a detailed timeline