Agent Deployment Management
The Deployments page in C3 AI Studio provides centralized management for all deployed agents in your application. You can view deployment status, enable or disable agents, delete deployments, and access deployment metrics. The page consists of two tabs:
- Deployments for active, long-lived agents.
- Preview Deployments for short-lived testing instances.
You can create deployments through two primary workflows:
From the Agent Workbench after you configure a new agent.
From the Agent Gallery by deploying an existing stored agent. Go to Gallery in the left navigation panel, locate your agent in the Store section, select Deploy, and configure the deployment settings.
Each workflow requires the same deployment settings: deployment name, node pool, thread pool size, and tracing mode.
A detailed explanation of these settings and the complete deployment process is available in Create Agents from Scratch.
Access the Deployments page
To open the Deployments page:
- Navigate to Agents in the left sidebar.
- Select Deployments.
View deployment information
The Deployments page displays a table with the following information for each deployed agent:
- Name: The deployment identifier. You can select the deployment name link to open the deployment details page.
- Status: Shows whether the deployment is
Running,Pending,Error, orDisabled. - Author: The user who created the deployment.
- Enabled: Indicates if the deployment is active. You can toggle this setting without deleting the deployment.
- Last Modified Date: The timestamp when the deployment was last updated.
- Source agent: The agent used to create the deployment.
Each row includes a Chat button to interact with the deployed agent through Workbench and a Menu icon for additional options.
Manage deployments
You can enable, disable, or delete deployments from the Deployments page.
To manage a deployment:
- Locate the Deployment in the table.
- Select the menu icon at the end of the row.
- Select one of the following options:
- Disable: Disables the deployment so it is no longer accessible to end users. This action also tears down the agent instance and releases any compute it was using. To re-enable, select Enable from the same menu.
- Delete: Permanently removes the deployment from your application. Confirm the deletion when prompted. This action cannot be undone.
Only users with appropriate permissions can enable, disable, or delete deployments.
Interact with a deployed agent
To test or use a deployed agent:
- Select the Chat button next to the deployment name.
- The agent workbench opens with the chat interface, allowing you to send messages and receive responses from the agent.
View deployment details
Select a deployment name to open the detailed view. The deployment details page is divided into two main sections: the header and the tabs.
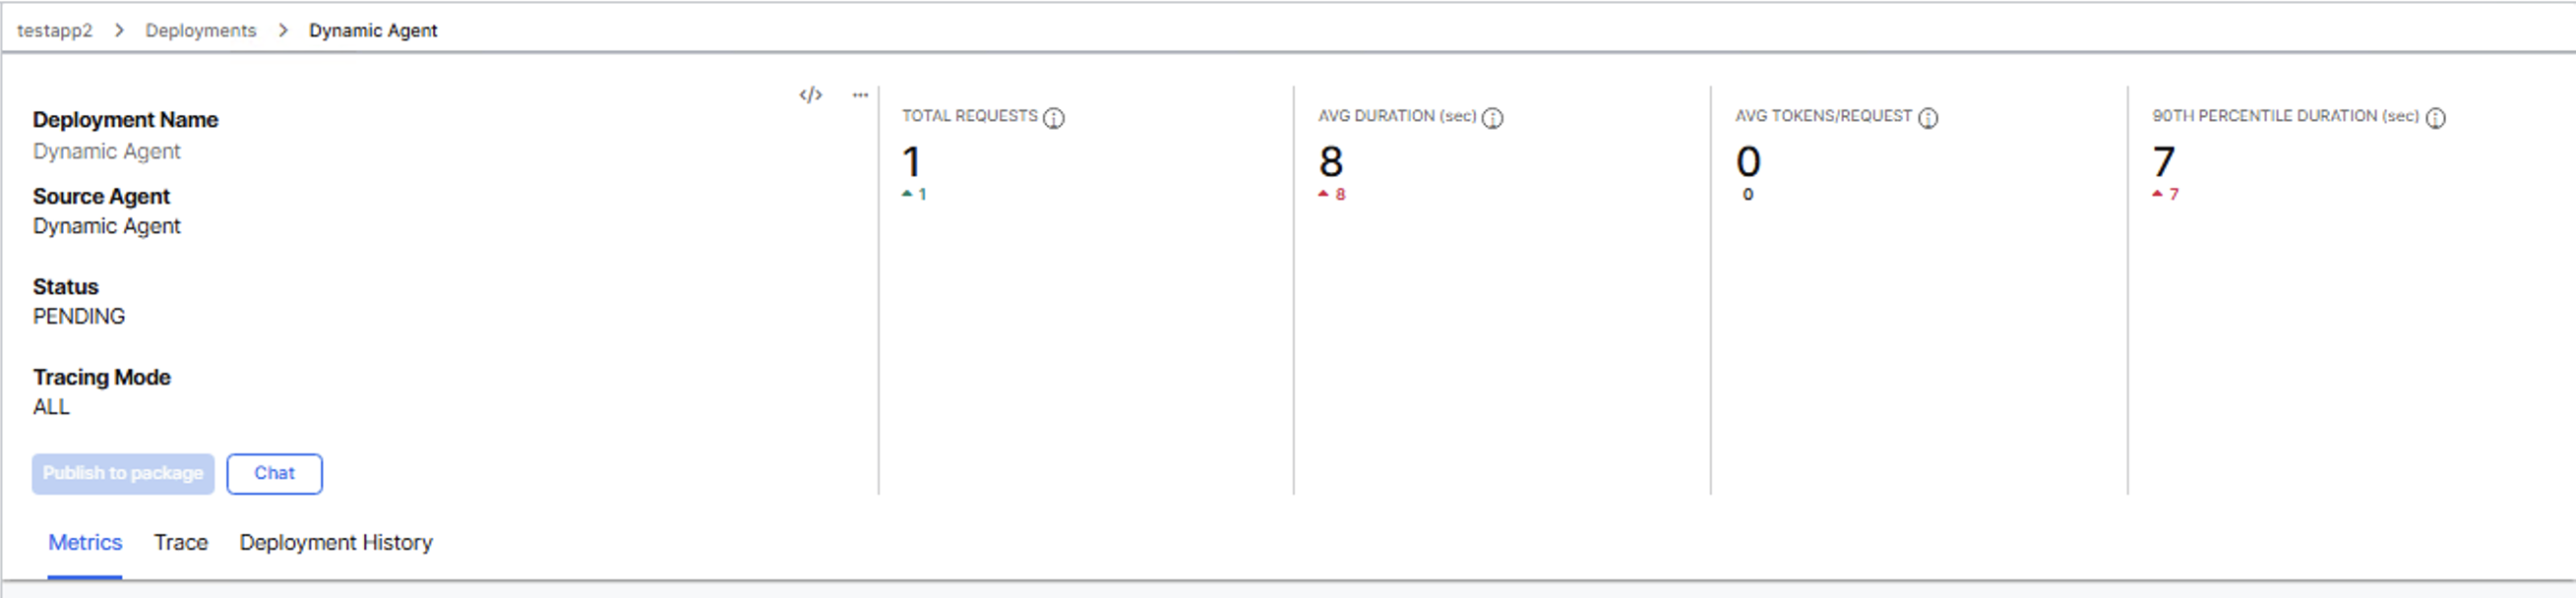
Header section
The header displays deployment information and performance metrics that remain visible across all tabs.
Deployment information: Name, source agent, status, and tracing mode.
Performance metrics: Four key indicators for the last 7 days:
- Total Requests: Total number of requests to the deployment.
- Avg Duration (sec): Average request duration.
- Avg Tokens/Request: Average tokens per request.
- 90th Percentile Duration (sec): Duration at the 90th percentile.
Each metric includes a trend indicator showing the change from the previous period. Deployment version markers appear across all related plots.
The header also includes action buttons: Publish to package and Chat to open the agent workbench.
Tabs section
The page includes three tabs that provide different views of your deployment data:
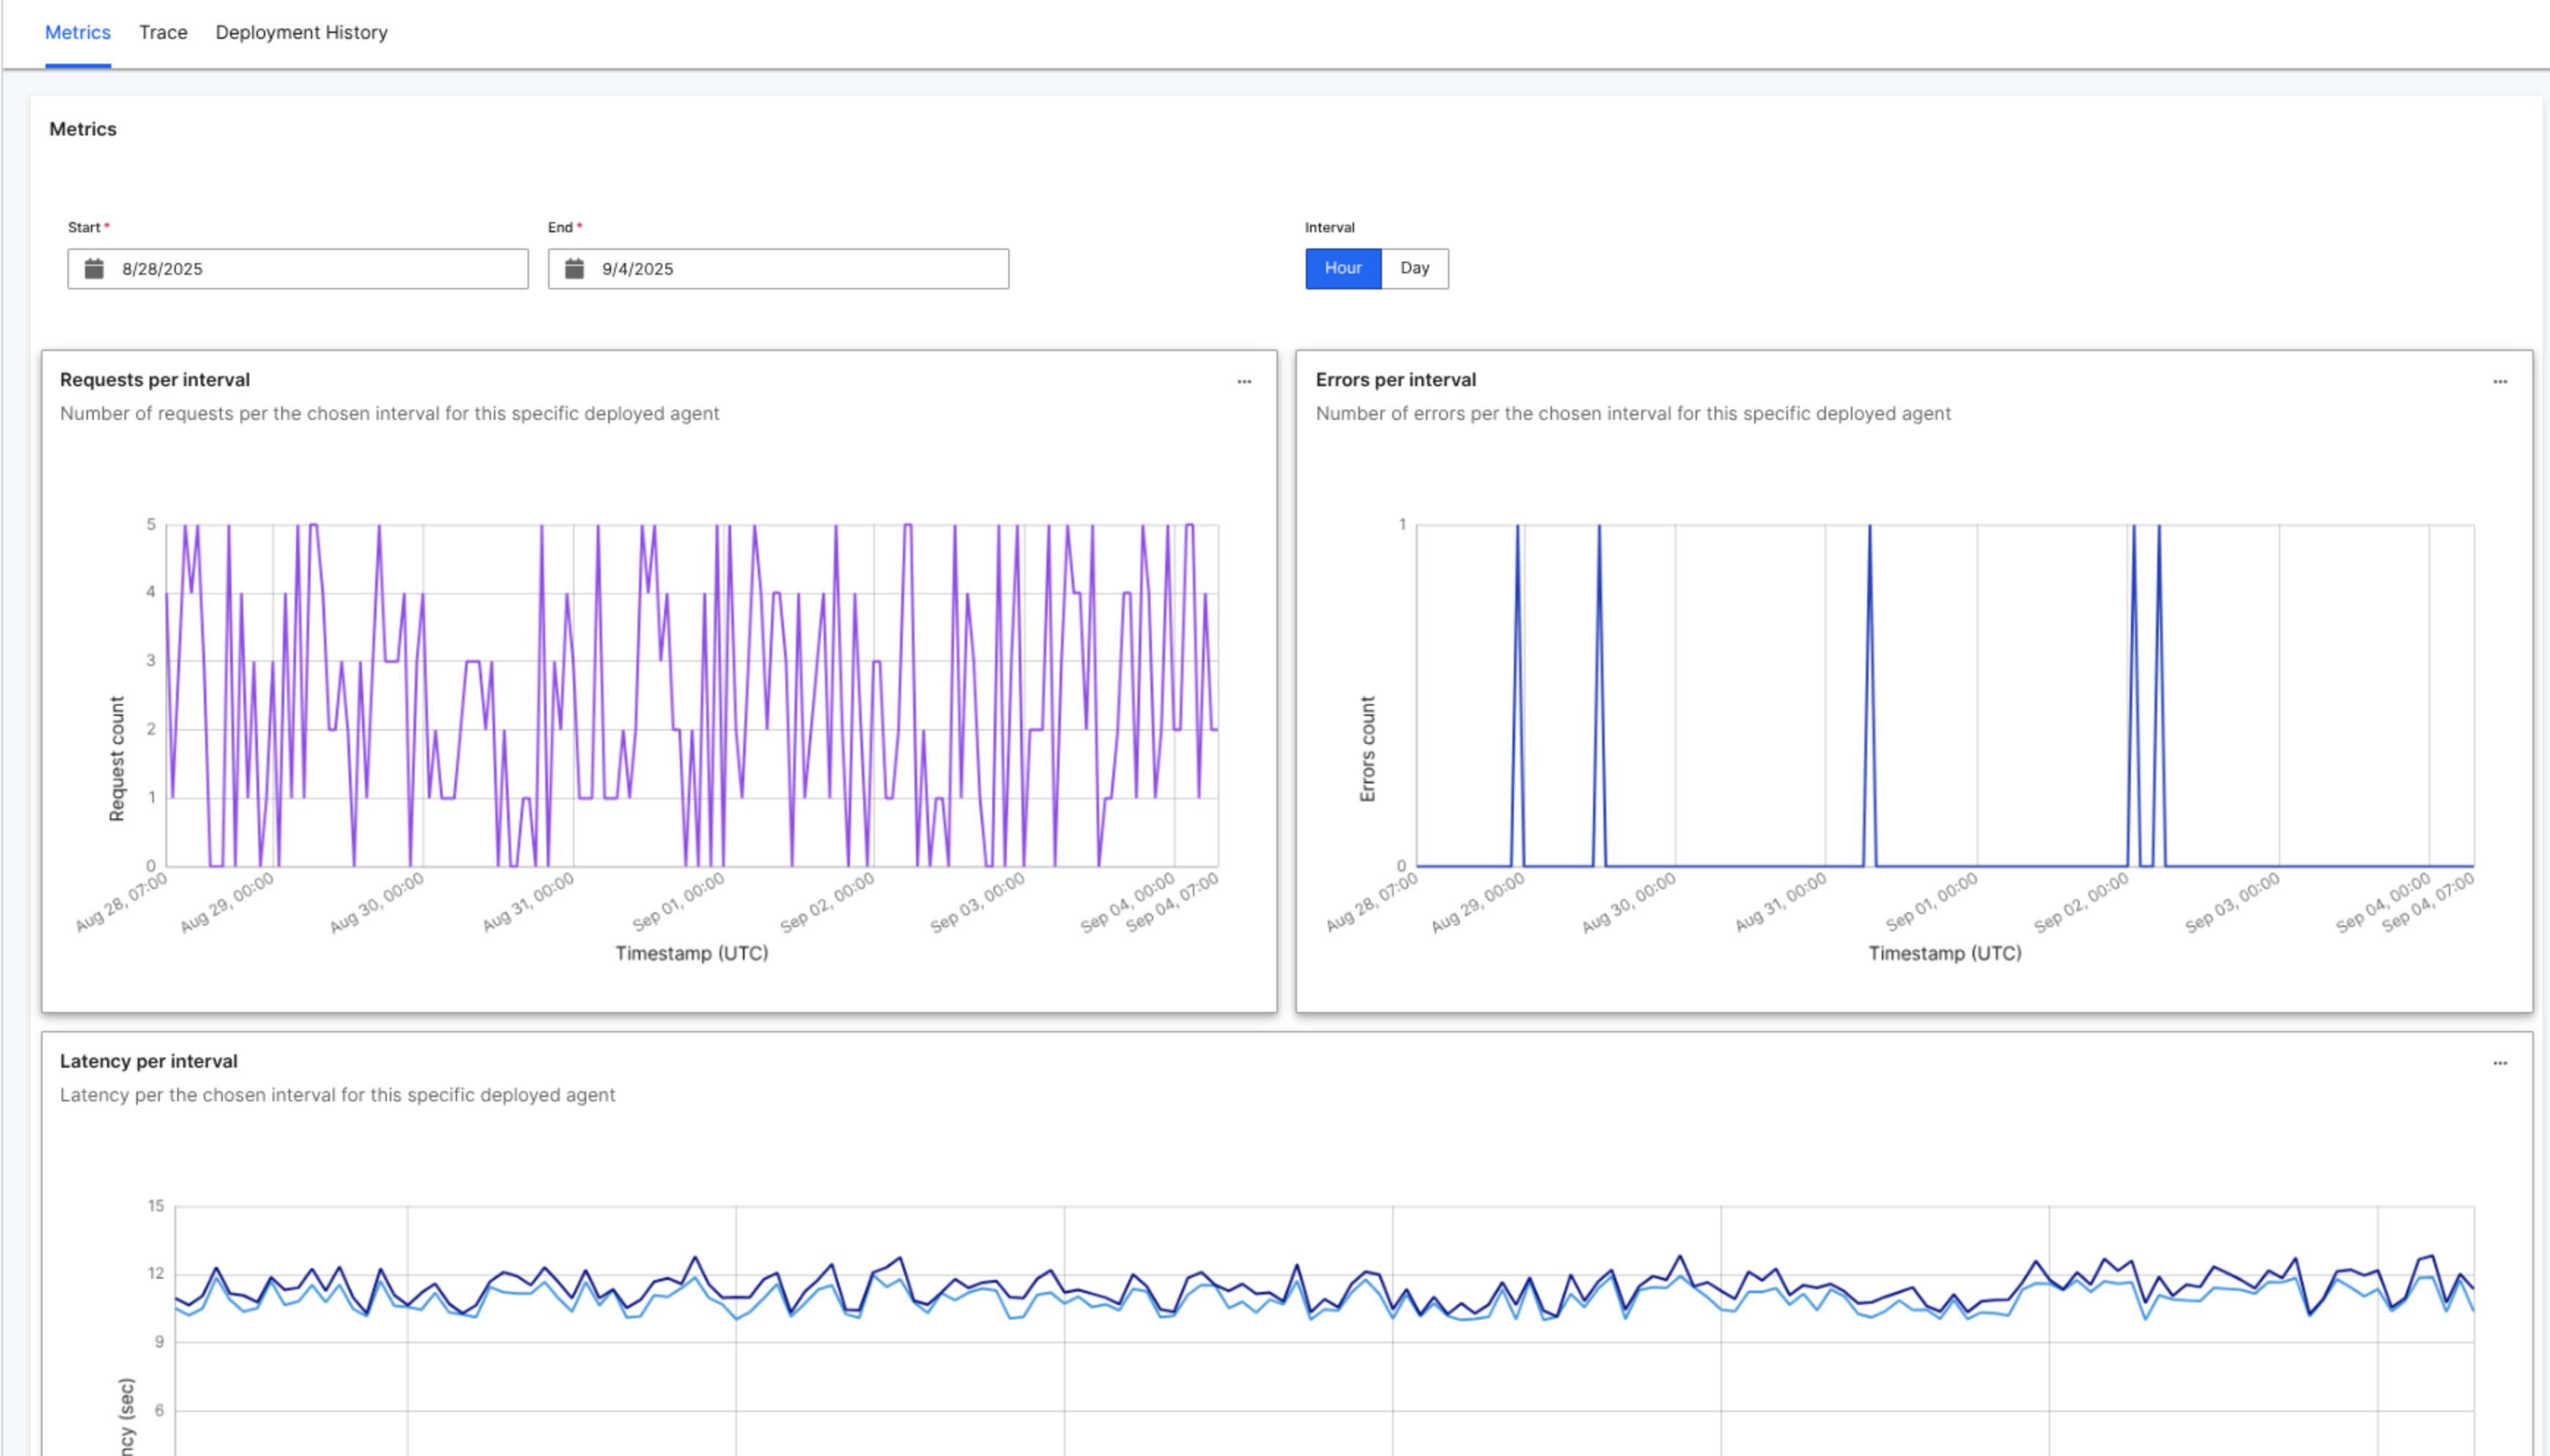
Metrics tab
The Metrics tab displays performance graphs over time:
- Requests per interval: Number of requests received during the selected time range.
- Errors per interval: Number of errors that occurred during the selected time range.
- Latency per interval: Response time measurements including average duration, p90 duration, and deployment version markers.
- Output tokens: Token usage tracking for deployments with tracing enabled.
Use the date selectors at the top of the page to adjust the time range. Select Hour or Day to change the interval granularity.
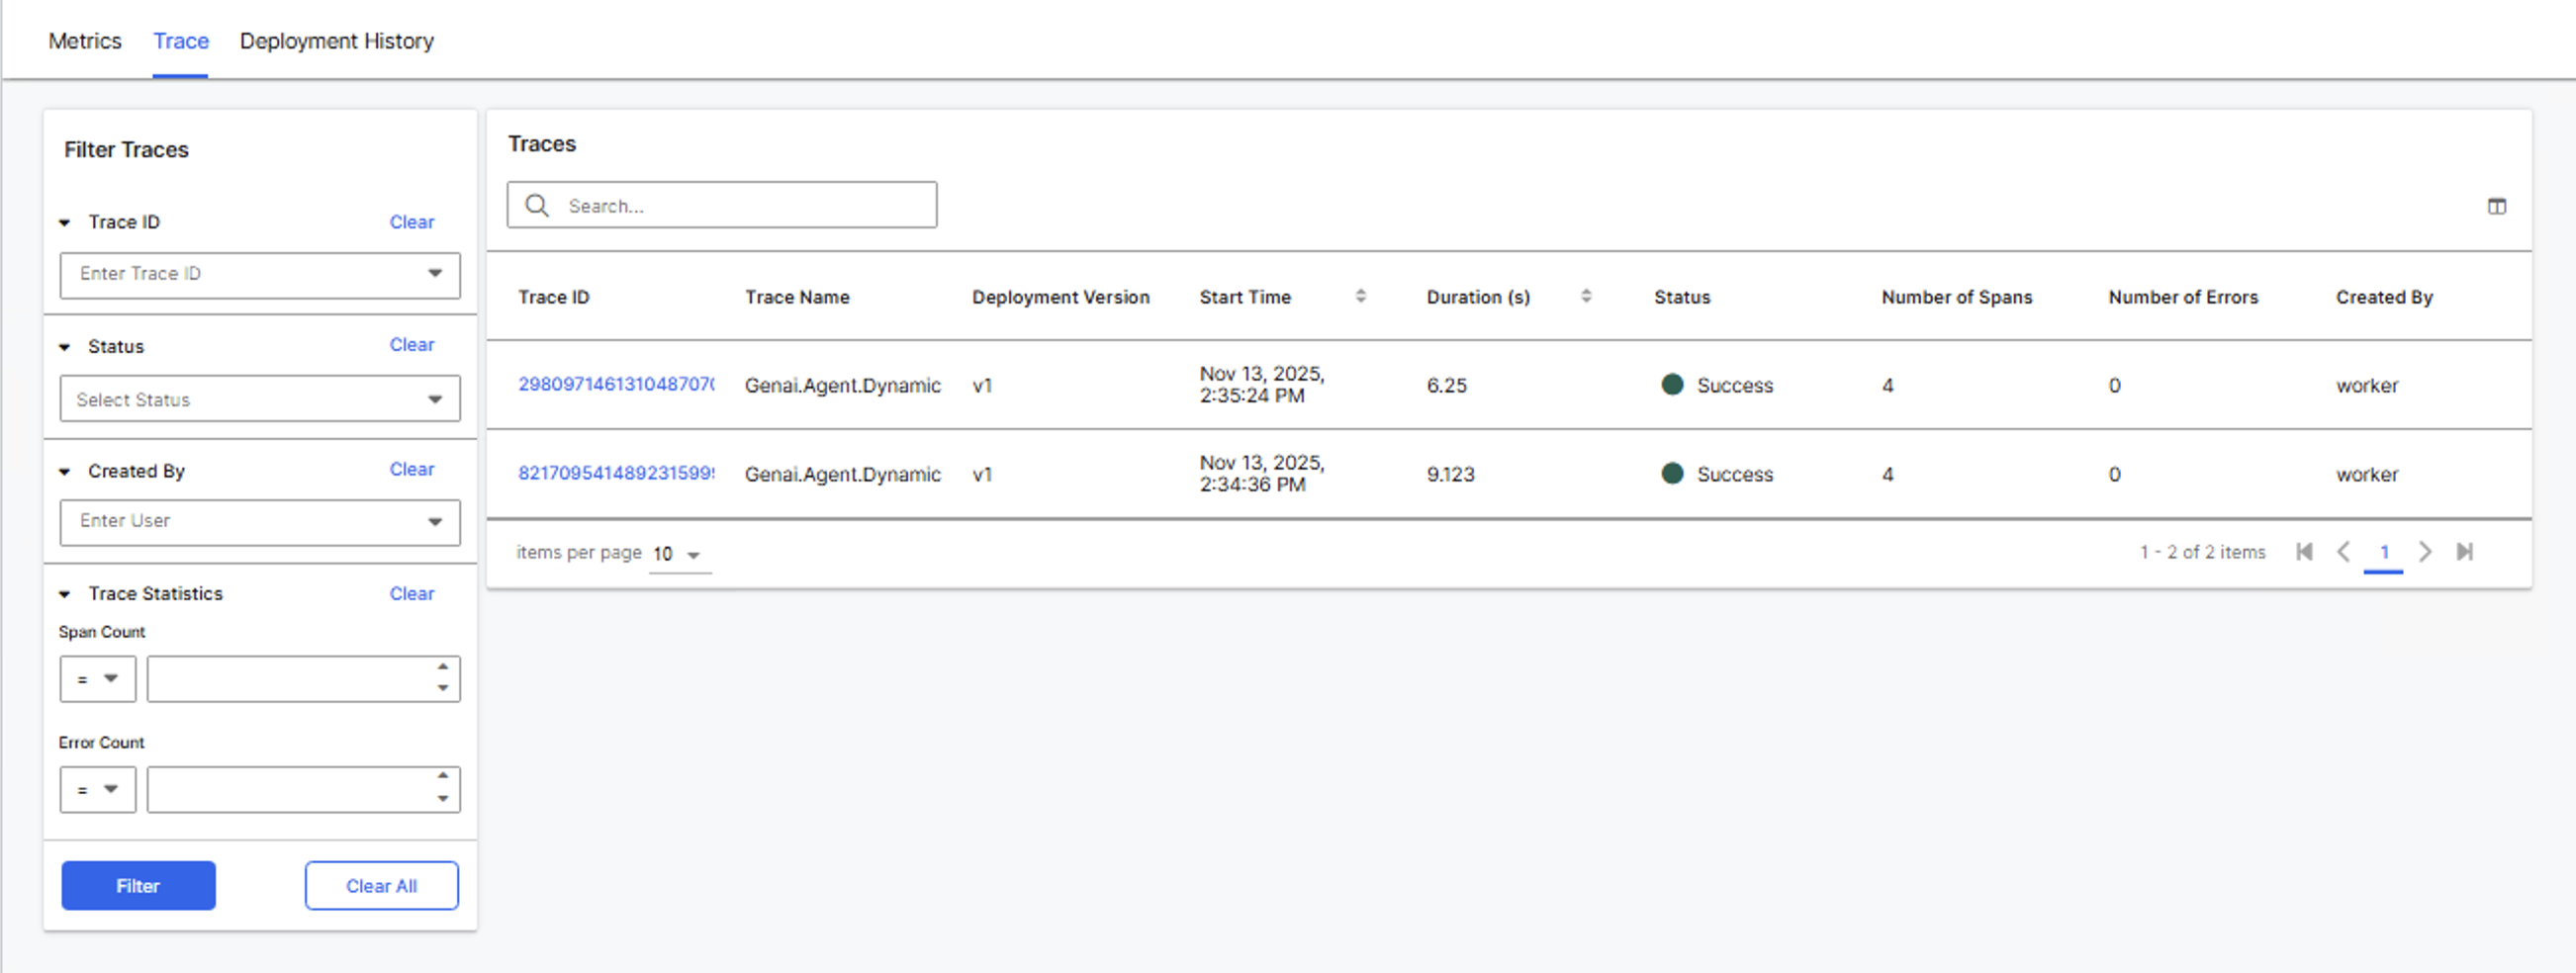
Trace tab
The Trace tab provides detailed execution information for individual agent runs when tracing is enabled. Traces break down agent execution into individual operations called spans, showing exactly what happens during each request.
For a conceptual overview of observability and tracing in the platform, see Observability and Monitoring Overview.
To view traces:
- Select the Trace tab.
- Use the filters on the left to narrow results:
- Trace ID: Enter a specific trace identifier to locate a single execution.
- Status: Filter by Error or Success.
- Created By: Filter by the user who triggered the trace.
- Trace Statistics: Set ranges for Span Count or Error Count.
- Select Filter to apply your criteria, or select Clear All to reset.
- Select a trace ID in the table to open the detailed trace view.
The below are the default display columns, but any attribute of the trace can be added to the chart. The view can be modified by selecting the table icon in the top right of the tab.
- Trace ID: Unique identifier for the execution.
- Trace Name: Name of the agent that ran.
- Deployment Version: Which version of the deployment was used.
- Start Time: When the execution began.
- Duration: Total execution time in seconds.
- Status: Success or Error indicator.
- Number of Spans: Count of operations within the trace.
- Number of Errors: Count of errors during execution.
- Created By: User who initiated the request.
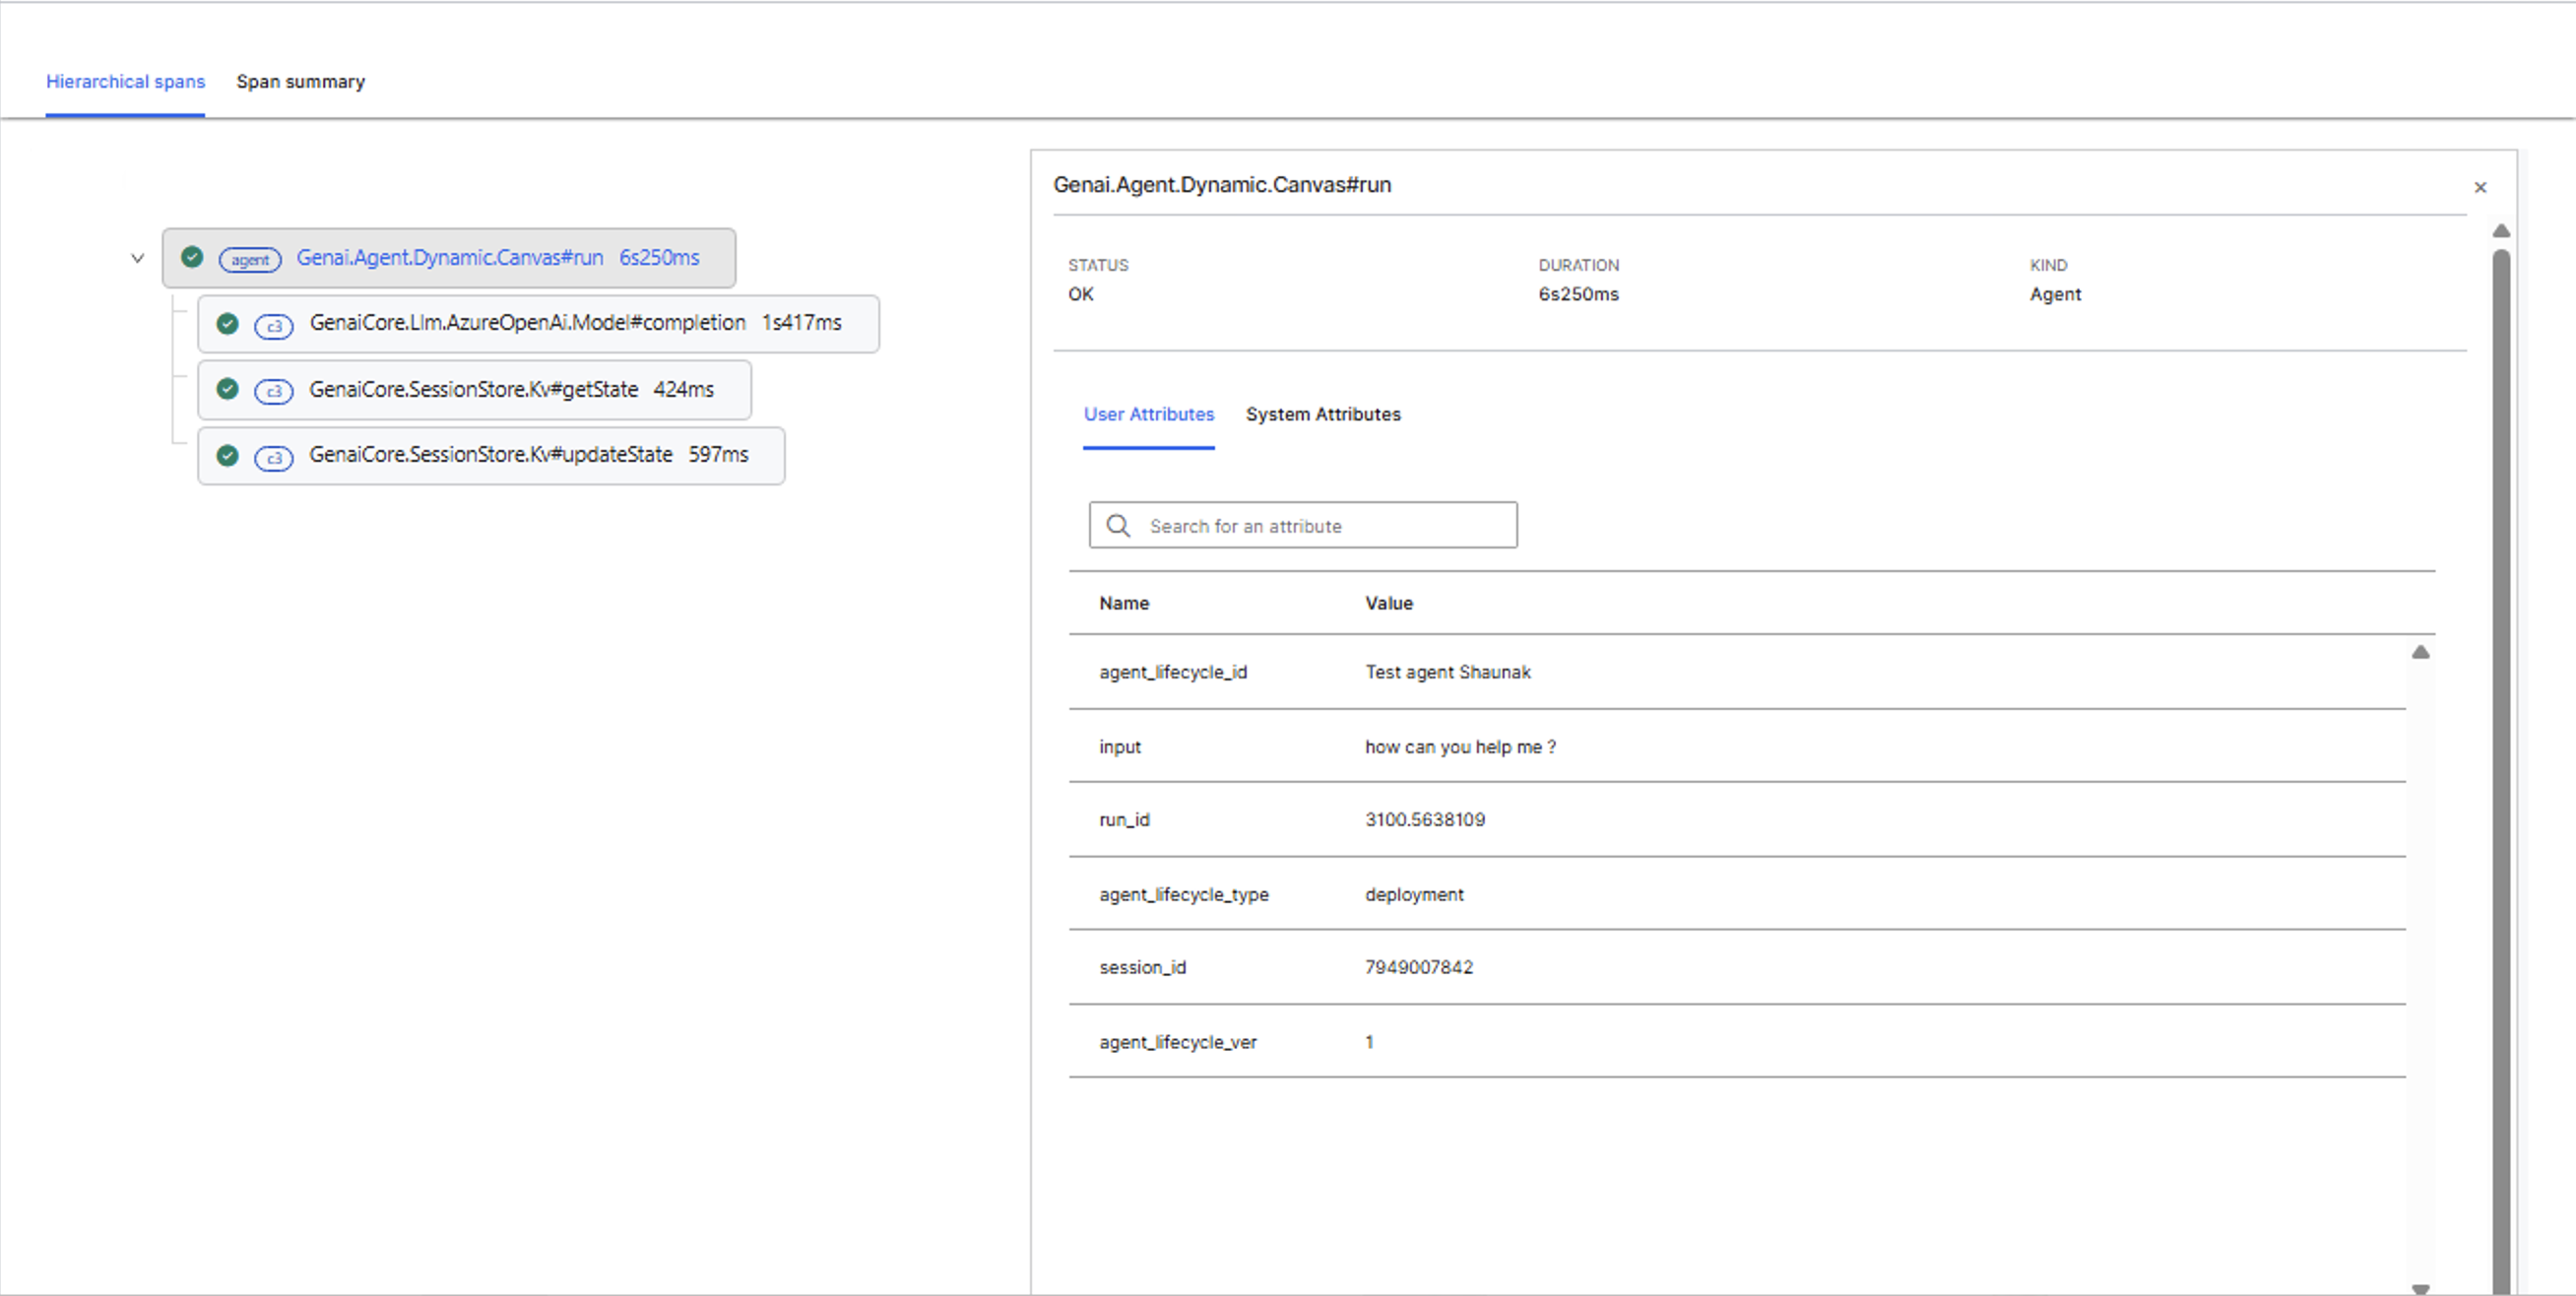
Selecting a trace ID opens the detailed trace view in a separate interface. This view includes:
- Trace name and status
- Total number of spans and errors
- Two viewing modes: Tree view and Span summary
The Hierarchical spans displays operations as a nested tree, showing parent-child relationships between spans. Each span shows its type, duration, and status indicator.
Example span types you might see:
- Agent (top-level span representing the entire agent execution)
- Embedder (text embedding operations)
- c3 (C3 platform operations like vector store searches)
- LLM model completions
Select any span in the tree to view its details in the right panel. The panel includes:
- Status and duration
- Kind (Agent, Embedder, c3)
- User Attributes tab showing execution metadata
- System Attributes tab showing internal platform data
Select the Span summary tab to see all spans in a flat table format. The table includes:
- Name: Span identifier and operation type.
- Kind: Category of operation (agent, Embedder, c3).
- Status: Success or failure indicator.
- Duration: Time taken for the operation.
- User Attributes: Preview of execution metadata.
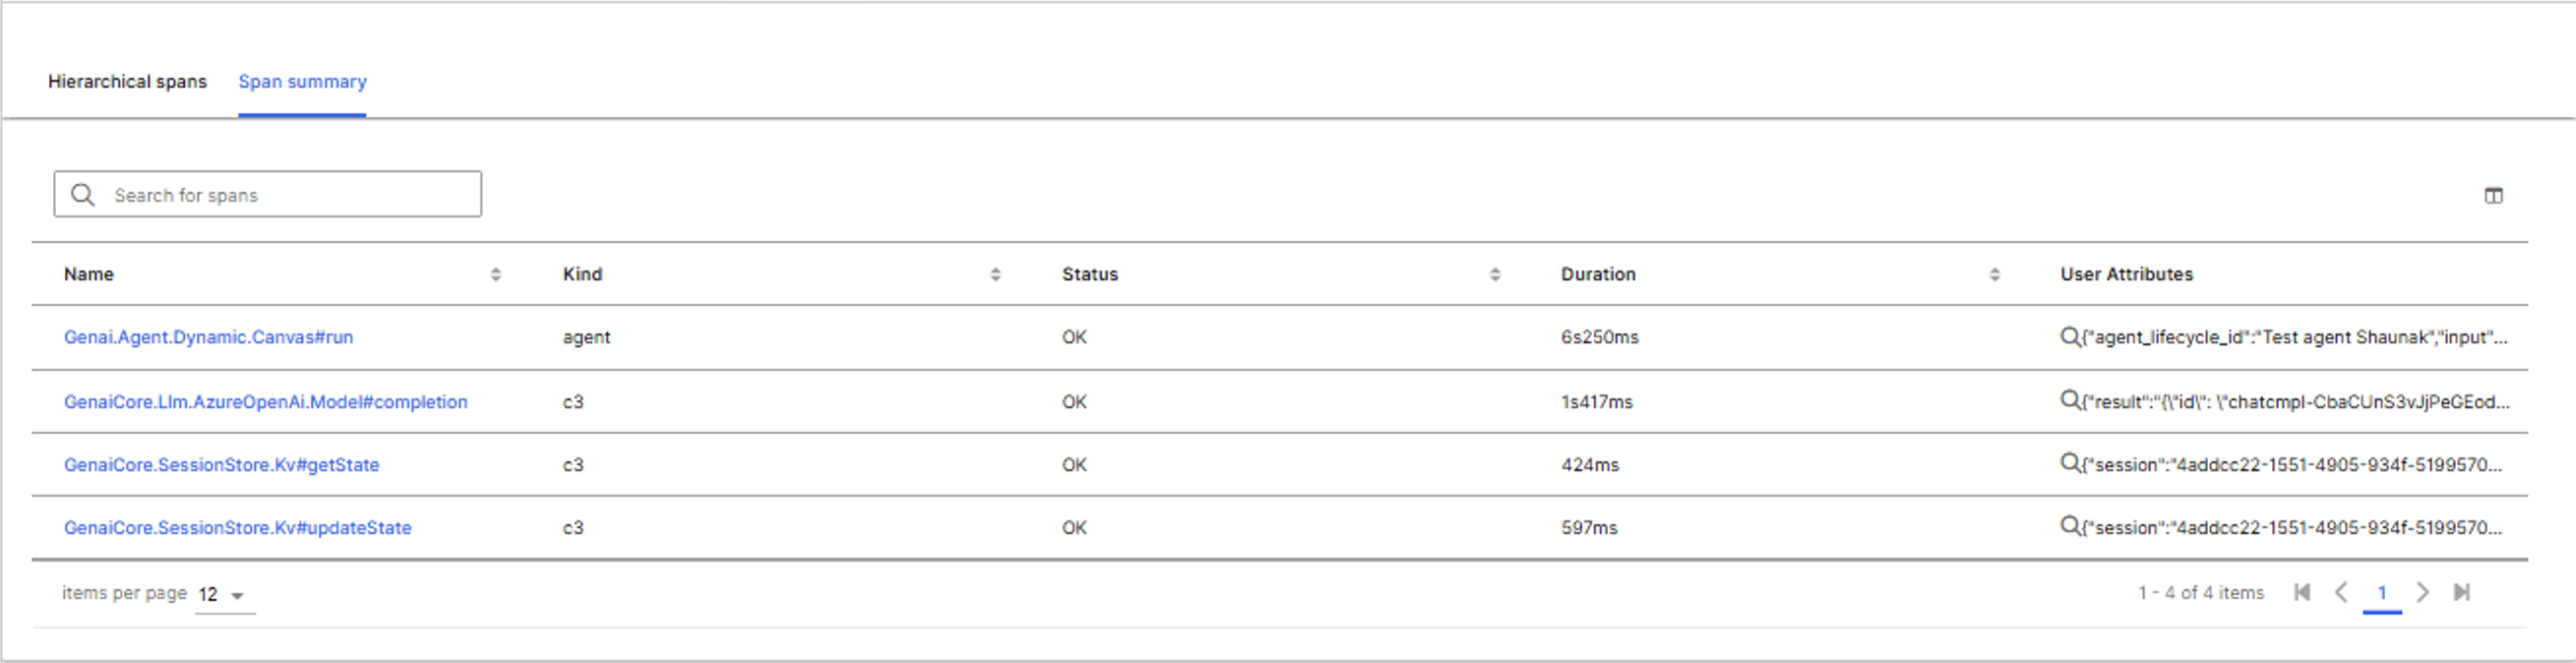
This view helps identify which specific operations took the most time. Search by specific keywords in the Spans, sort by duration to find bottlenecks quickly.
Tracing provides visibility into agent execution steps, helping identify performance bottlenecks or errors. If no traces appear, verify that tracing is enabled for the deployment.
For detailed instructions on working with traces and spans in the agent workbench, see Debug using Traces and Spans.
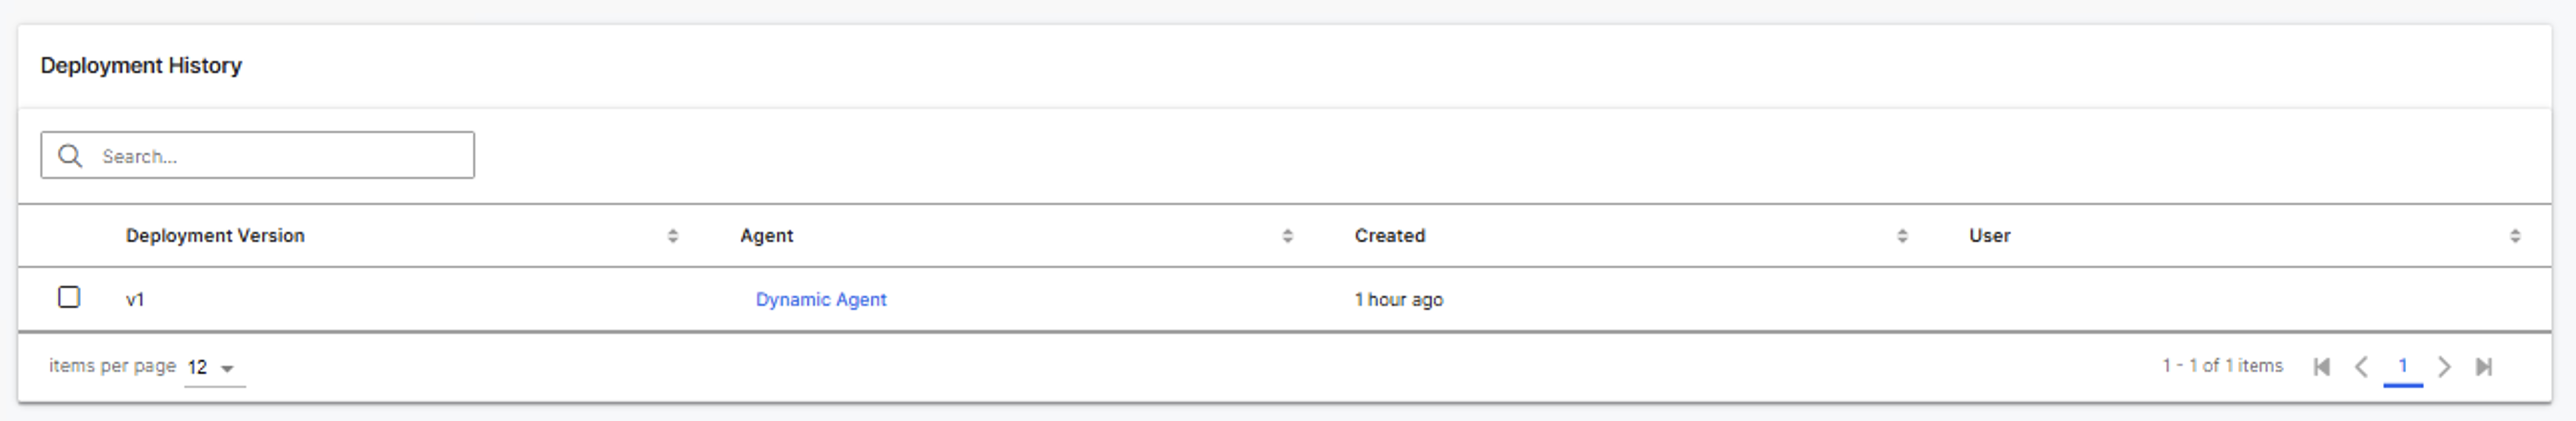
Deployment History tab
The Deployment History tab shows all versions of the deployment.
The history table includes:
- Deployment Version: Version identifier for the deployment.
- Agent: Source agent name (linked to the agent configuration).
- Created: Timestamp when the version was deployed.
- User: User who created the deployment version.
Any deployment operation creates a new version entry in this table. This includes deploying an updated agent, deploying a new agent to an existing deployment, or redeploying an agent created in the workbench or by code. This history tracks changes over time and identifies who made each update.
When you update an agent in the workbench and redeploy with the same deployment name, a new version appears in this table. For details on configuring and updating agents, see Create Agents from Scratch.
Publish Agent Deployment to a package
Publishing an Agent Deployment to a package makes it available for reuse across multiple applications. You must be on a Single Node Environment (SNE) to publish deployments to a package.
To publish a deployment:
- Open the deployment details page.
- Select Publish to package.
- Confirm the publishing action.
Publishing automatically deploys the agent in any application that uses the selected package.
Preview Deployments
Preview deployments are short-lived instances used for testing agents with draft or stored configurations. These deployments clean up automatically after one hour of inactivity.
To view preview deployments:
- Navigate to Agents > Deployments in C3 AI Studio.
- Select the Preview Deployments tab.
The Preview Deployments page displays the same table structure as the Deployments page. You can interact with preview deployments, view their status, and delete them manually if needed.