Observability and Monitoring Overview
The C3 Agentic AI Platform includes observability features for monitoring agent responses and tracking performance.
Understand agent behavior
To build robust and intelligent agents, you must consider complex requirements like language model coordination, session management, and data processing operations. Without visibility into these operations, you cannot assess performance or diagnose issues like slow response times.
With observability features, you can see exactly what happens during message processing. Multiple operations execute in sequence, some complete quickly while others cause delays. This execution visibility helps you build reliable, performant agents.
Observable metrics
When you test agents in the Agent Workbench or monitor deployed agents through the Deployments page, the C3 Agentic AI Platform provides observability for:
- Operation duration and identification of slow processes.
- Language model calls and token consumption.
- Session state management and data retrieval timing.
- Bottlenecks in the agent workflow.
This information appears as traces, visual timelines that break down agent execution into individual steps called spans. Each span represents one operation.
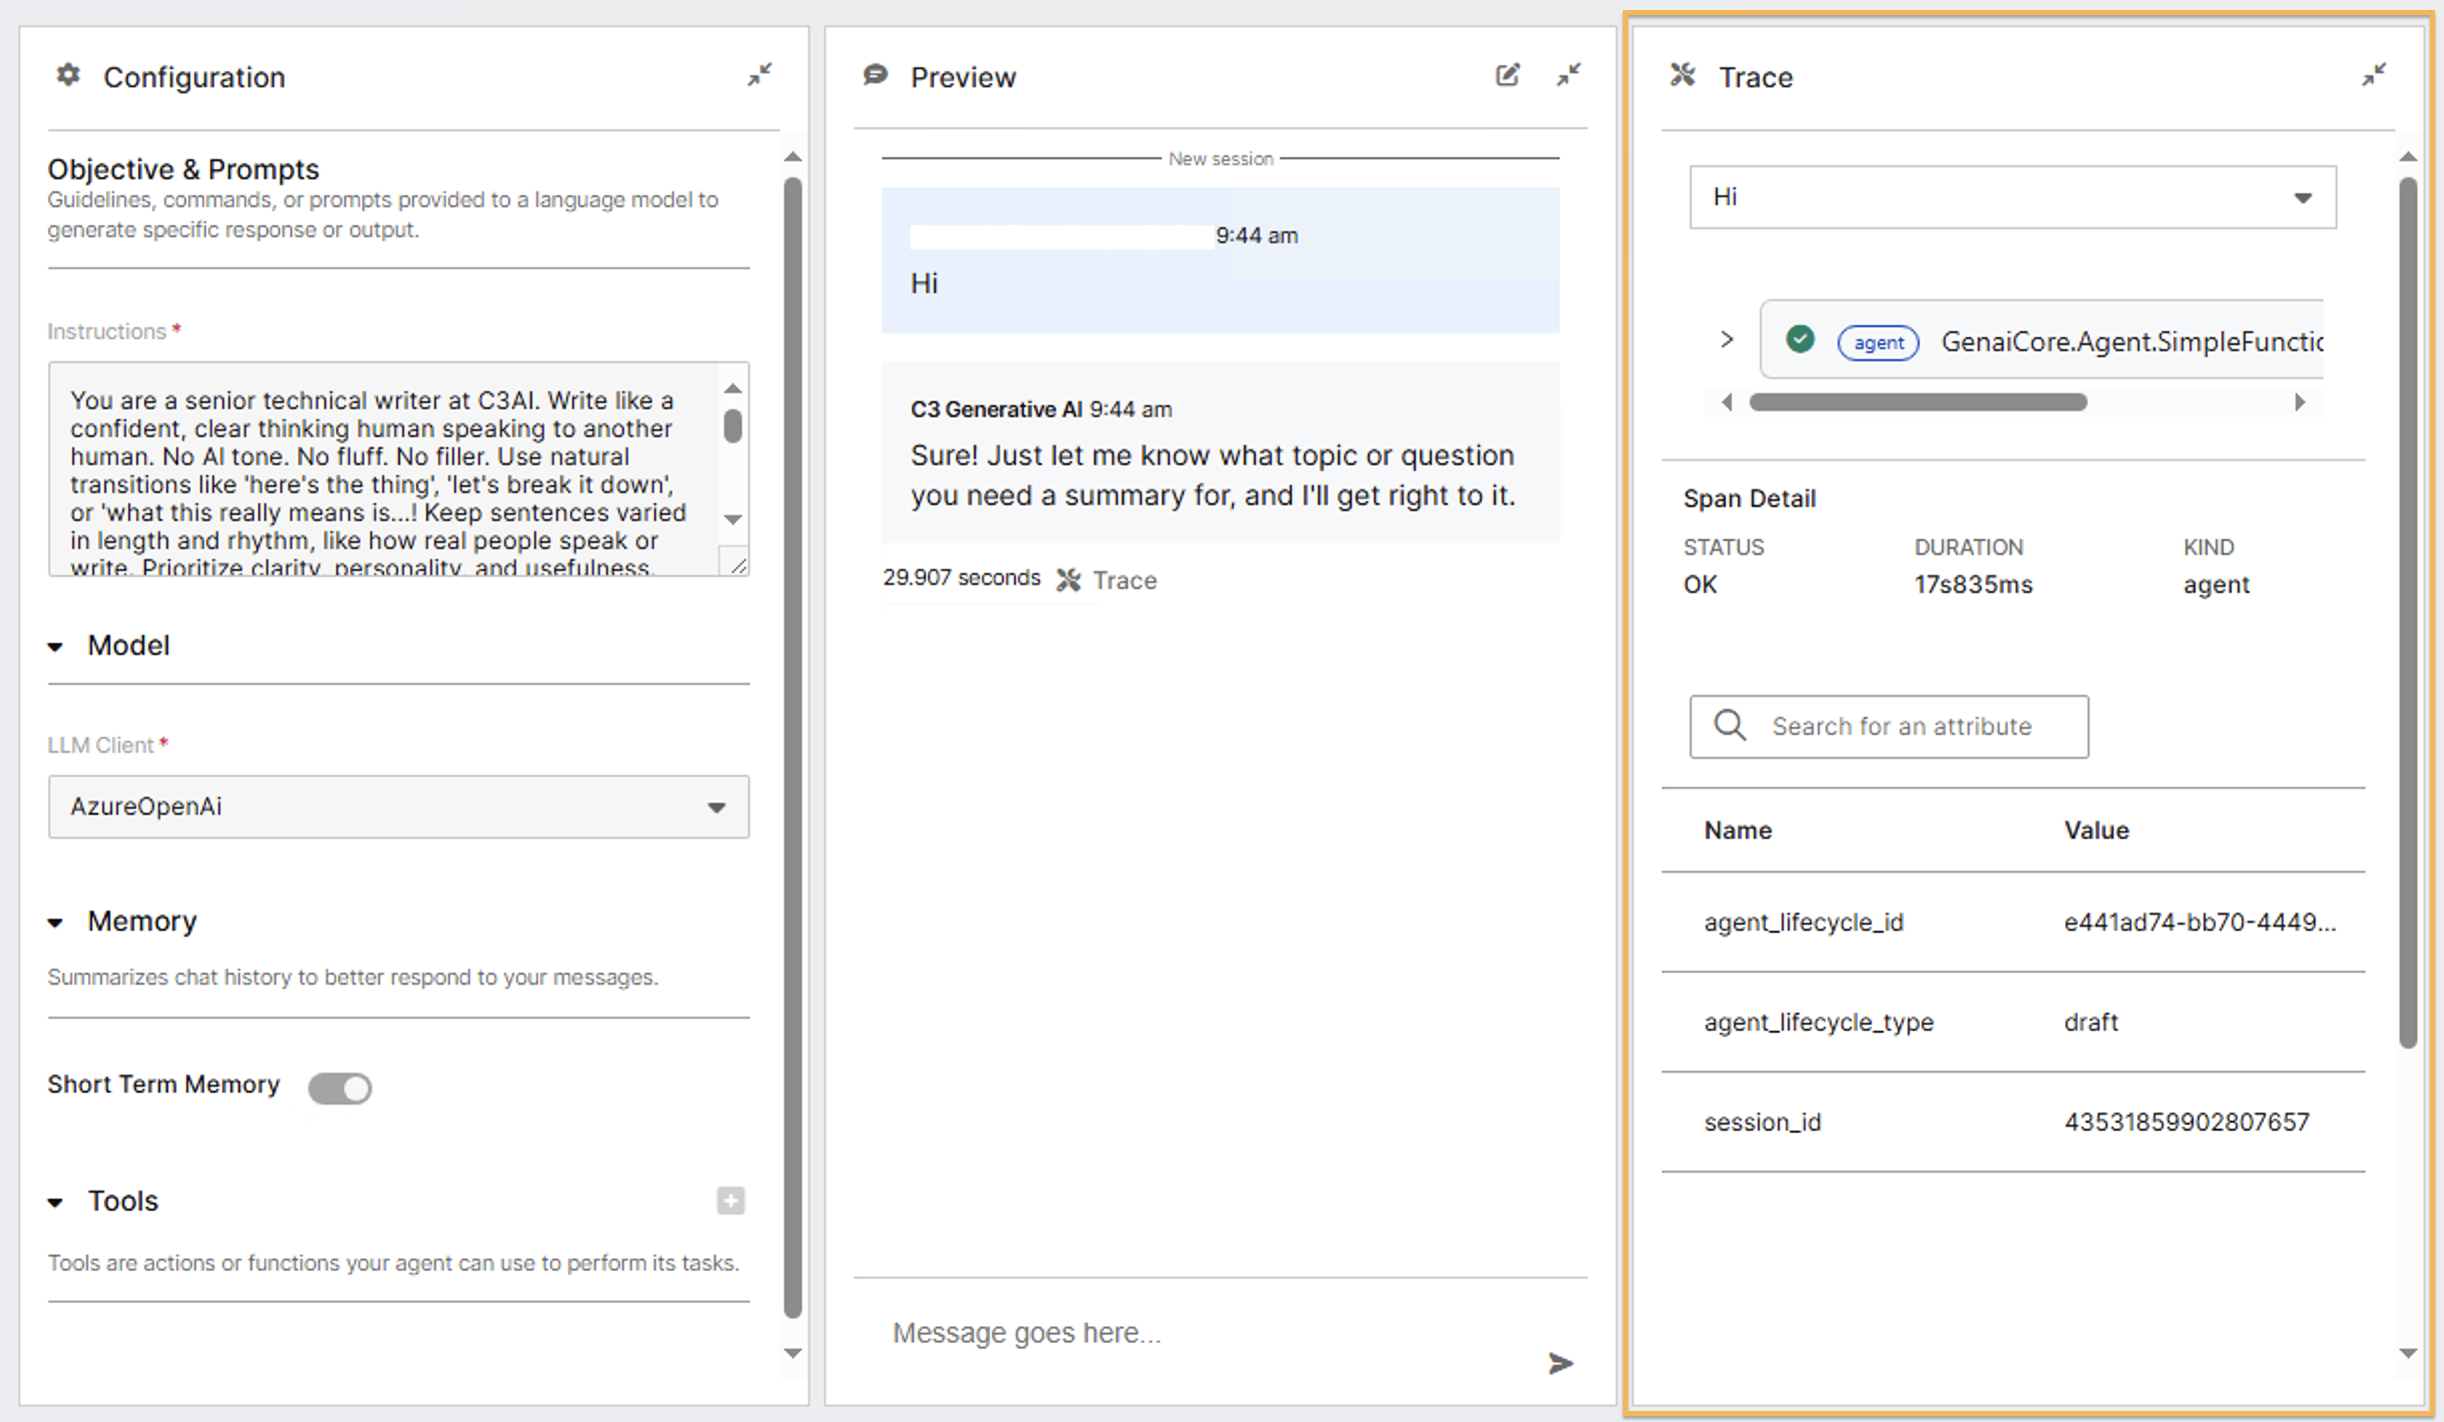
Trace details
Each trace displays spans in order of execution:
- Agent receives and processes user input: Measures how quickly processing starts.
- Session state retrieval from storage: Reveals if context loading delays occur.
- Language model completion calls: Displays response times and token usage.
- Session state updates: Shows how efficiently context is saved.
- Agent response generation: Indicates final processing time.
You can select any span to view details such as duration, token usage, and session data. This shows not just what happened, but why certain operations took longer.
Importance of observability
During development, traces help identify issues before deployment. For example, you might discover unnecessary model calls or excessive session data retrieval.
In production, observability serves as a diagnostic tool. Instead of guessing the cause of issues, you can review the execution path and locate the root cause.
For optimization, traces reveal patterns in agent behavior. Certain types of questions might consistently trigger longer processing times, guiding you to refine configurations.
Access traces
You can access traces in two locations depending on your workflow:
During development: Access traces through the Agent Workbench Trace panel when testing agents. Send test messages and review execution traces in real time. This immediate feedback helps you understand agent behavior as you configure it. For more information, see Debug using Traces and Spans and Agent Workbench.
For deployed agents: Access traces through the Trace tab on the deployment details page when tracing is enabled for your deployment. The Trace tab provides detailed execution information for individual agent runs, allowing you to filter by trace ID, status, created by user, or trace statistics. Select a trace ID to open a detailed trace view with hierarchical spans and span summary. See Agent Deployment Management.