Debug using Traces and Spans
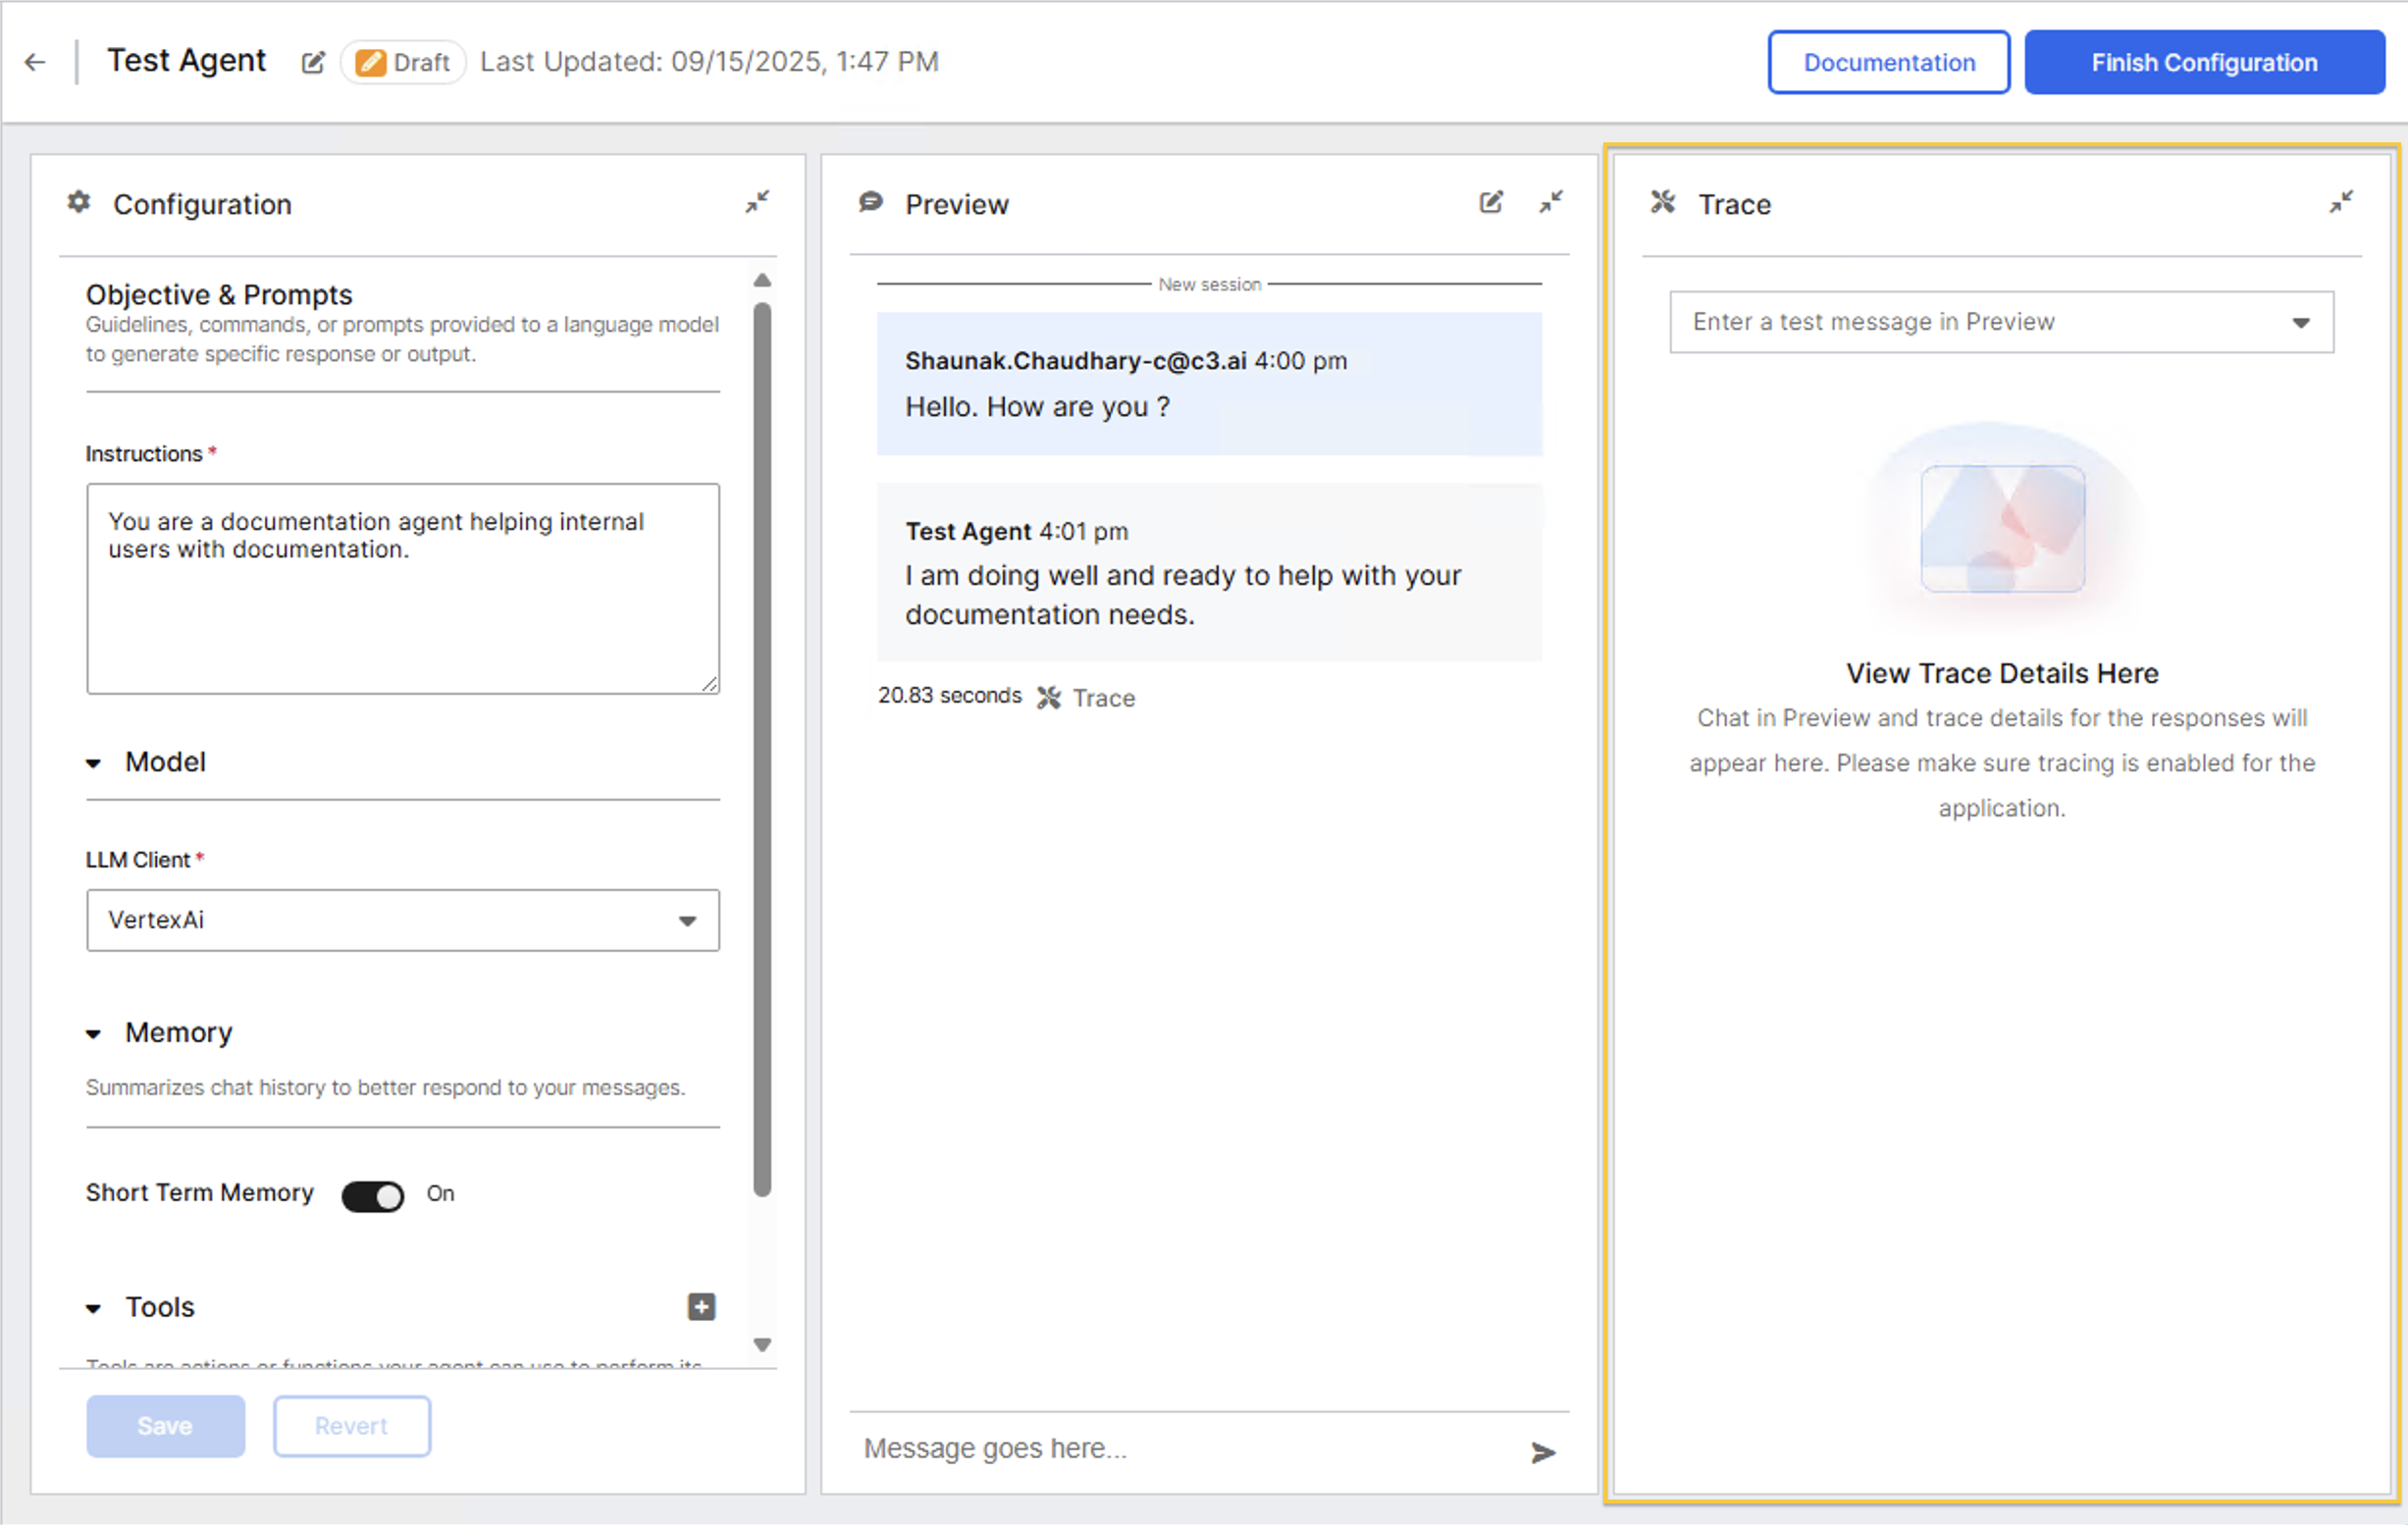
The Trace panel displays detailed execution information when you test agents in the Agent Workbench. Each interaction generates a trace showing the sequence of operations, execution timing, and data exchanged during agent processing.
Access the Trace panel
The Trace panel appears on the right side of the Agent Workbench when you test agent configurations.
To view trace information:
- Open your agent in the Agent Workbench.
- Locate the Trace panel on the right side of the interface.
- Send a test message in the Chat panel.
- Select a trace entry to view its details.
The Trace panel displays View Trace Details Here when no trace data is available.
The Trace panel is collapsed by default. Expand it to view execution details.
Understand the Trace panel layout
The Trace panel contains two main sections:
- Tree view (upper section): Displays operations in hierarchical order with execution durations.
- Span Detail (lower section): Shows detailed information about the selected operation.
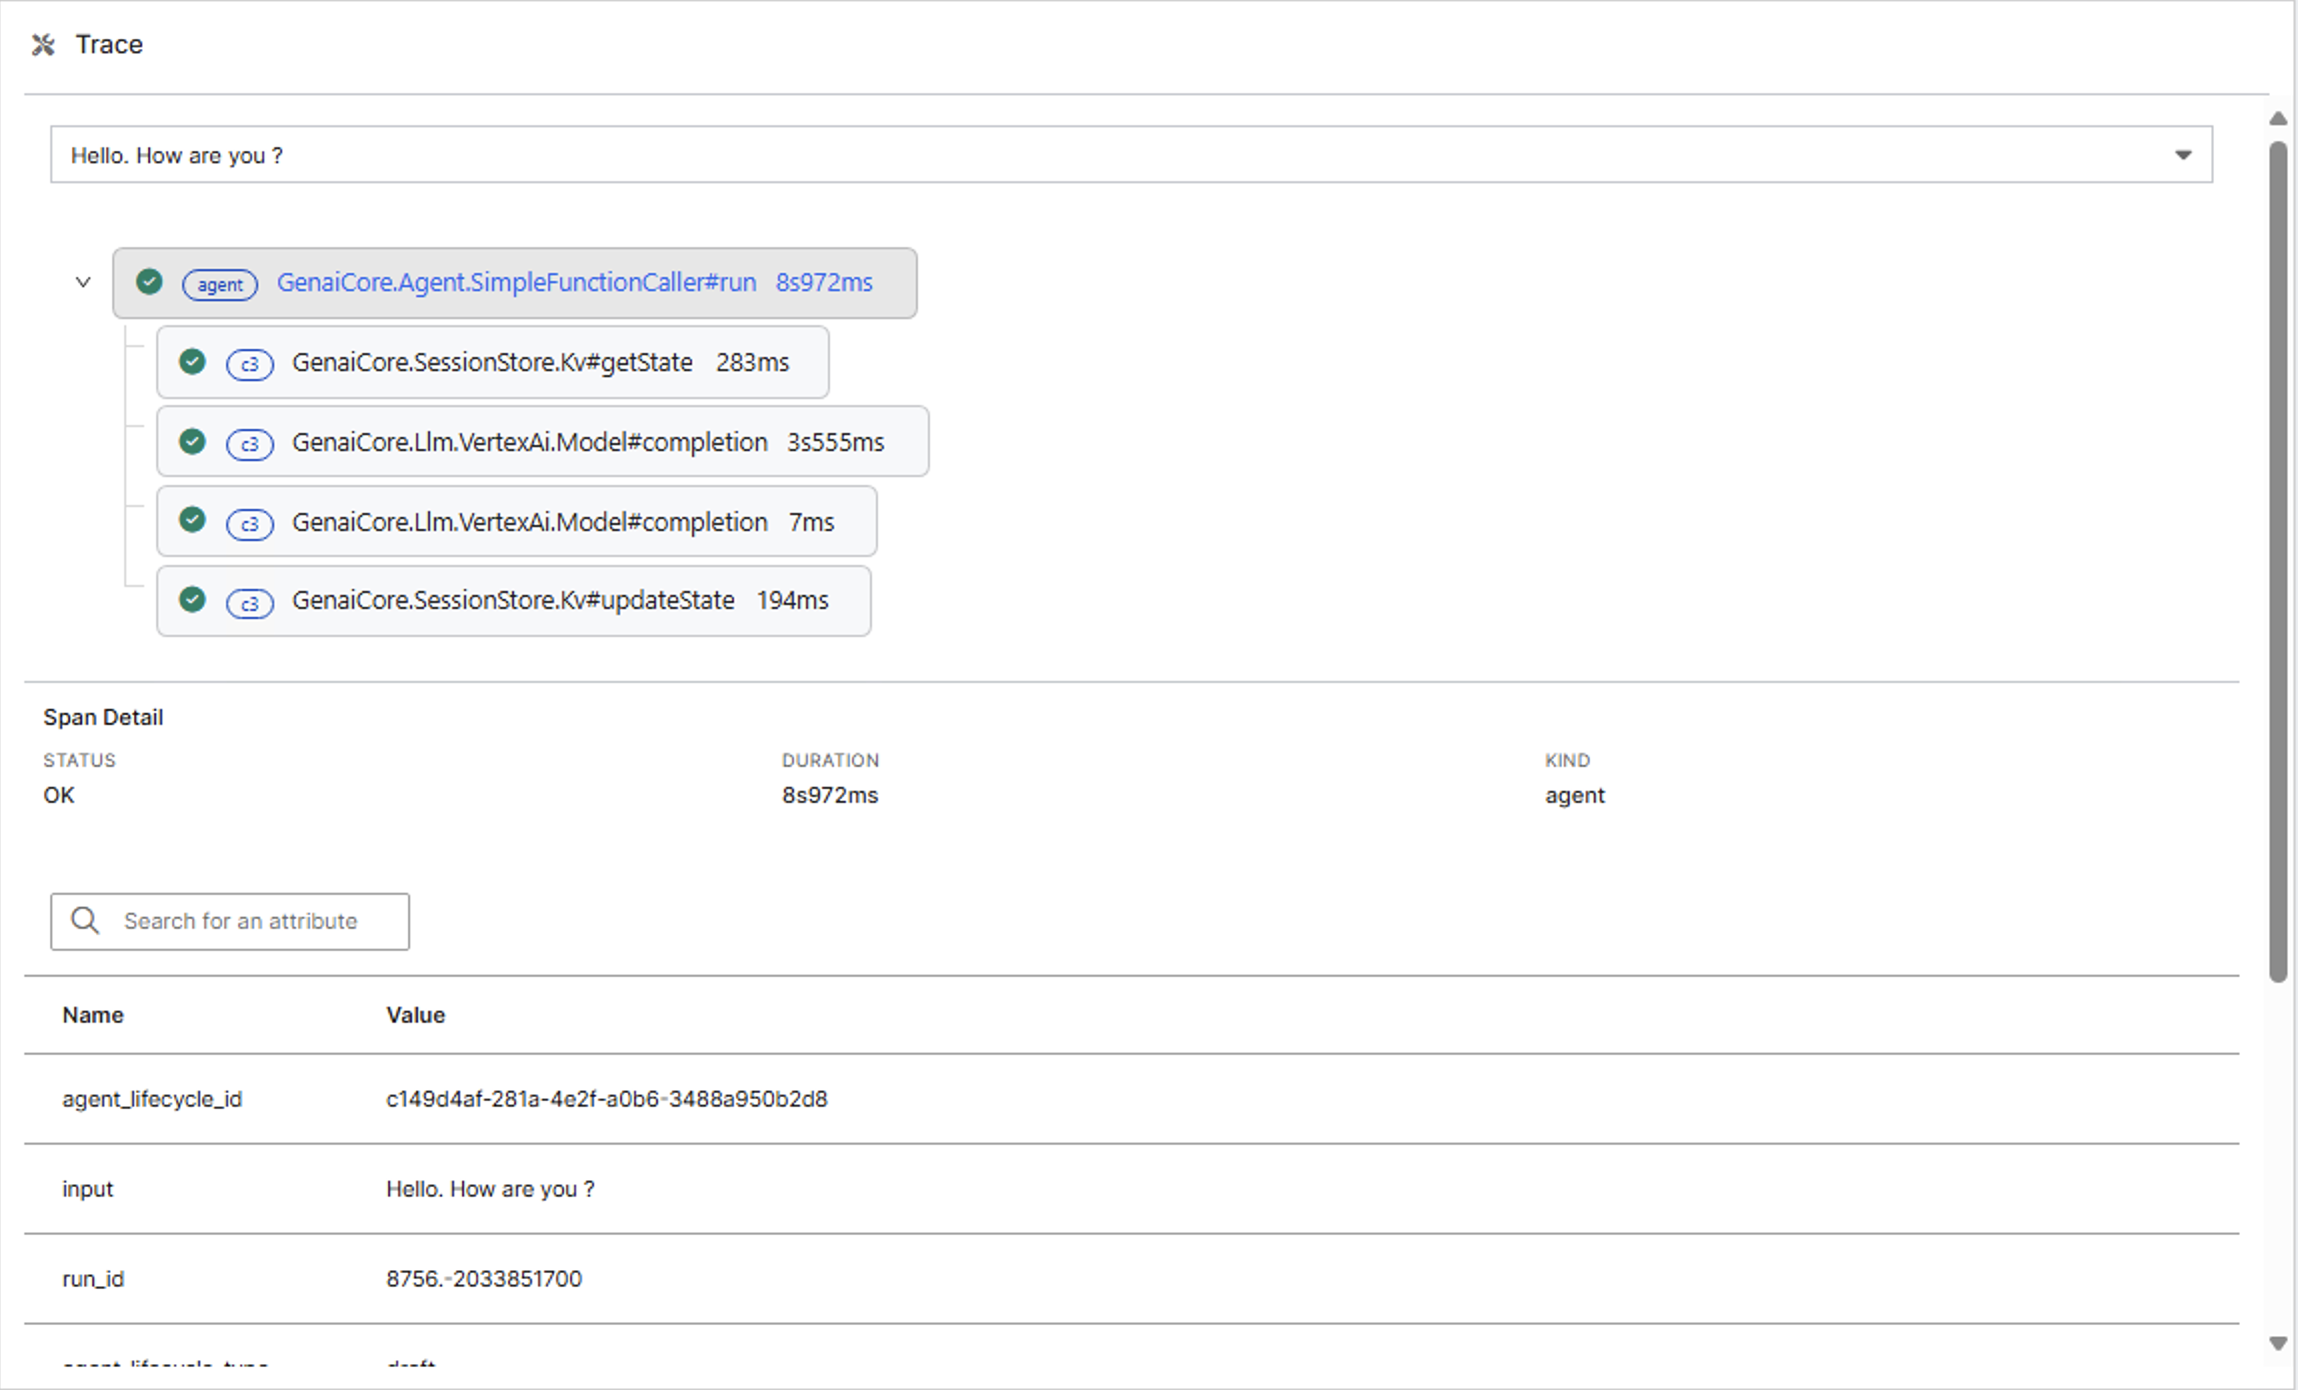
Each operation shown in the tree view is called a span. This term appears in the Span Detail section when viewing information about a selected operation.
Navigate the tree view
Each trace displays as a hierarchical tree showing operations in execution order. Operations appear as expandable items that display their duration.
The tree view shows:
- Operation names with their execution duration.
- Hierarchical relationships between operations.
- Expand/collapse controls for nested operations.
The operations in the tree view represent method calls executed within the C3 AI Type System. You can see spans like GenaiCore.Agent.SimpleFunctionCaller#run at the top level, with nested operations including GenaiCore.SessionStore.Kv#getState and GenaiCore.Llm.VertexAi.Model#completion. Each span shows a specific Type method executing during agent processing, with durations displayed. The exact Types and methods you see depend on your agent configuration and the tools it uses.
Select operations
To view details for any operation:
- Locate the operation in the tree view.
- Select the operation name.
- Review the information in the Span Detail section below.
The Span Detail section updates immediately when you select a different operation. Each operation displays different information based on its type and function.
Expand nested operations
To view operations nested within a parent operation:
- Locate the parent operation in the tree view.
- Select the expand arrow to the left of the operation name.
- Select any nested operation to view its details.
Nested operations show their relationship to parent operations through indentation in the tree view.
Switch between traces
To view a different trace:
- Select the dropdown at the top of the Trace panel.
- Choose a trace from the list.
- The tree view updates to show the selected trace.
Each trace in the dropdown shows the query text for identification.
View operation details
The Span Detail section displays execution information for the selected operation. This section appears below the tree view and updates when you select different operations.
Each operation displays:
- STATUS: Shows "OK" for successful operations or "ERROR" for failed operations.
- DURATION: Shows execution time.
- KIND: Indicates the operation category such as Agent, Embedder, or c3.

Attribute table
Below the status information, the Span Detail section displays a Name/Value table containing detailed attributes for the selected operation.
Attributes provide detailed information about each operation. The specific attributes you see depend on the operation type and your agent configuration.
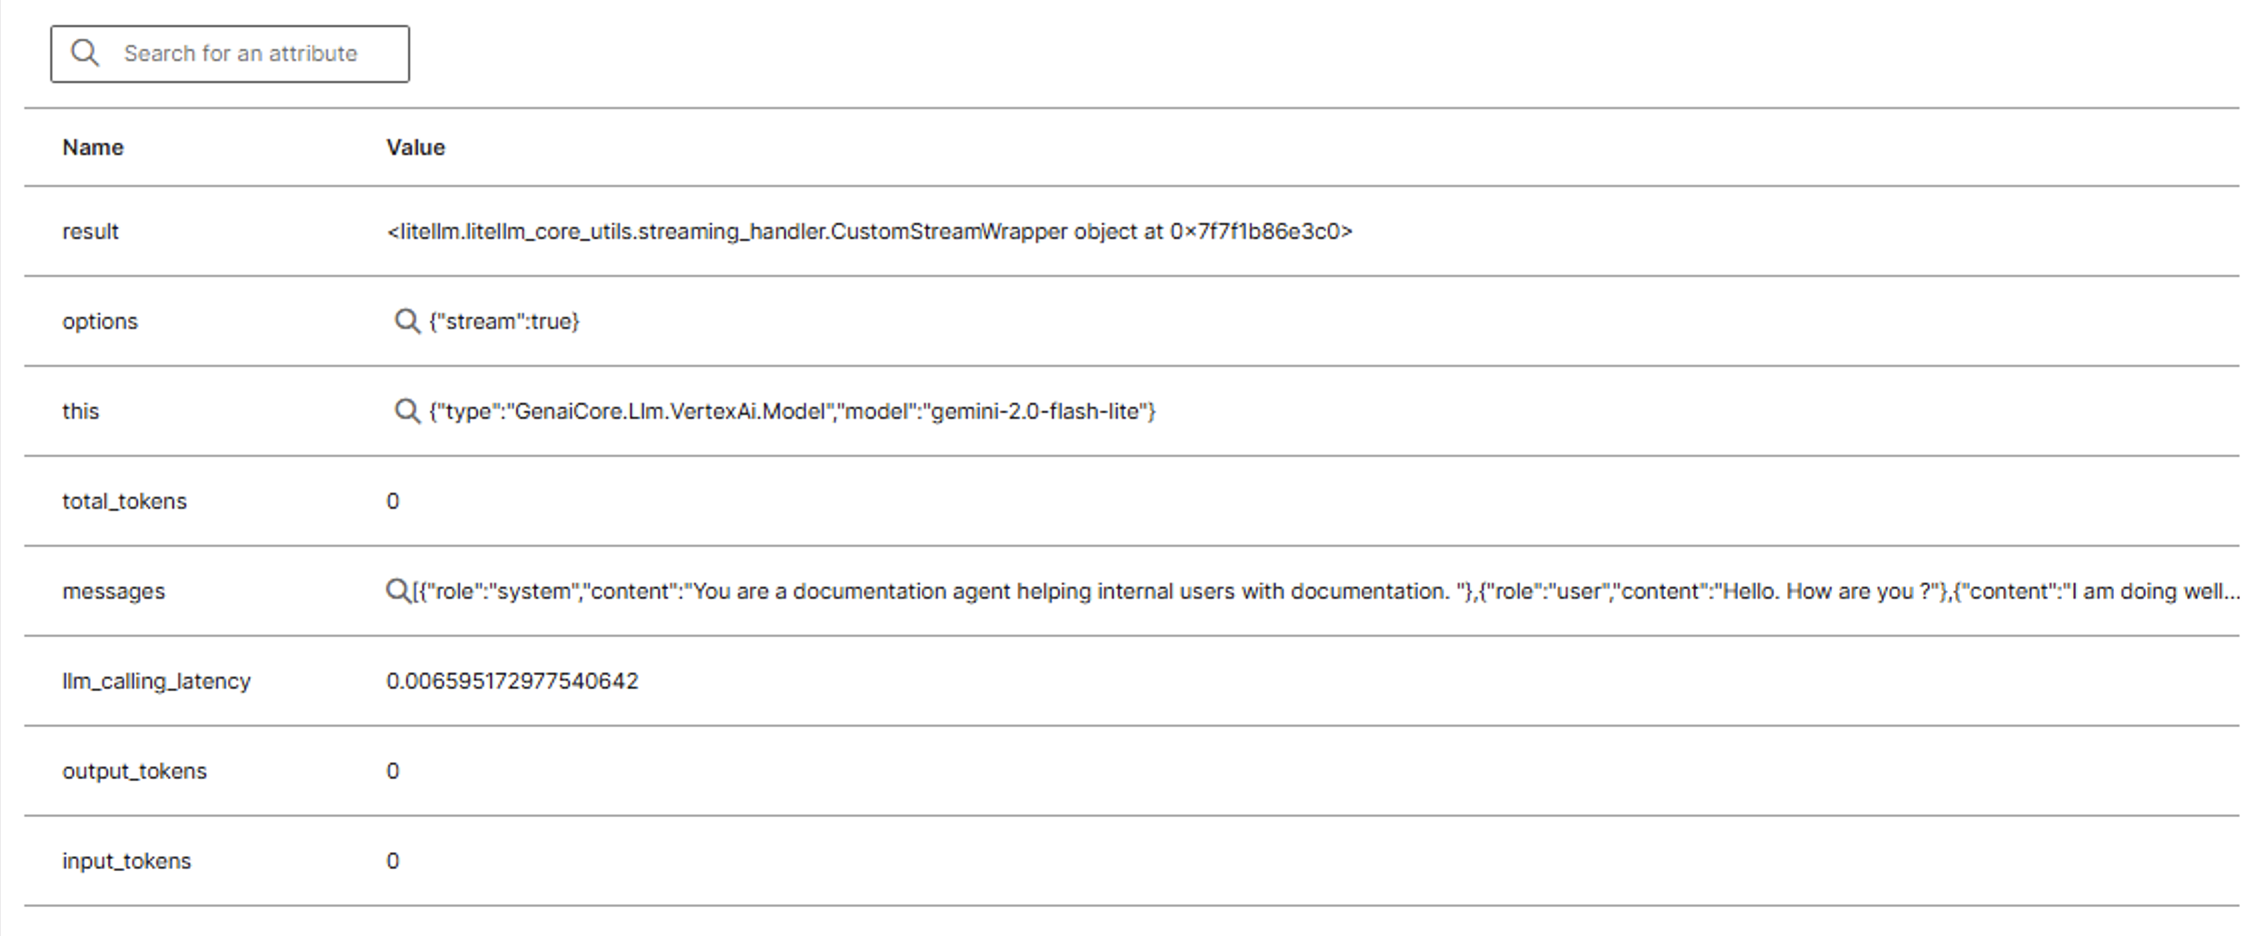
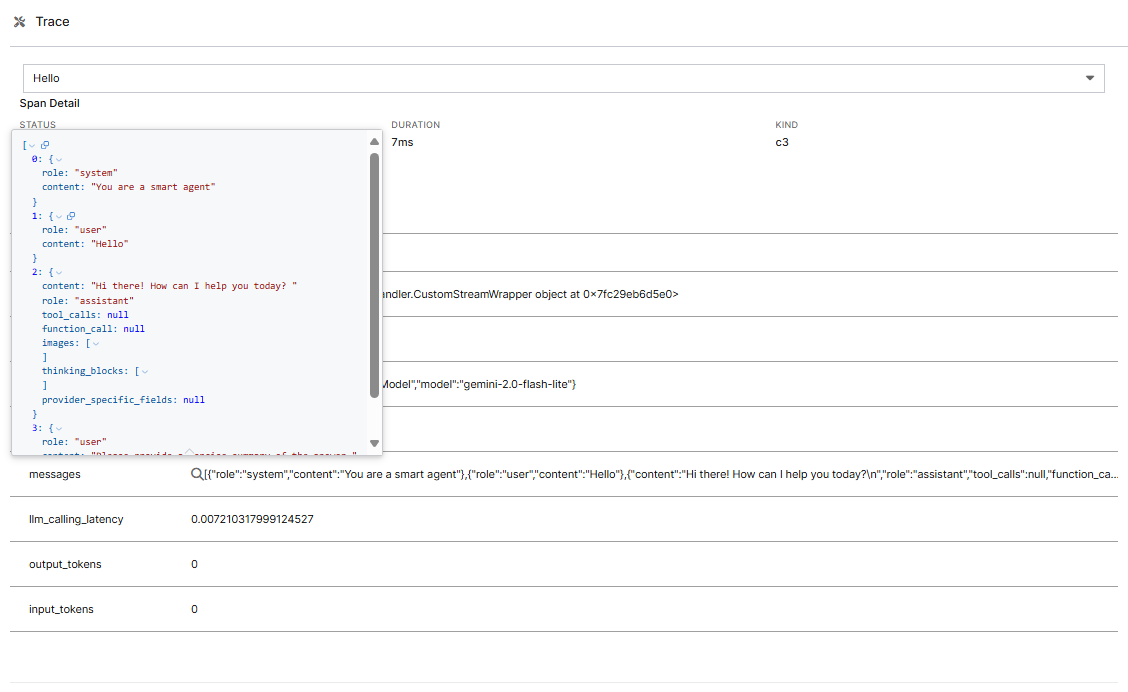
For attributes containing JSON data, select the magnifying glass icon next to the attribute value. This opens a modal display showing the formatted JSON content with proper indentation and syntax highlighting.
The modal display improves readability of complex JSON structures, particularly for attributes such as messages which hold conversation history and agent responses.
The attributes in this table change when you select different operations in the tree view. Each operation displays different attributes based on its type and function.
Search attributes
Use the search box above the attribute table to filter attributes by name. Type any part of an attribute name to show matching rows.
The search filters attributes for the currently selected operation only.
Interpret error states
When an operation fails, the Trace panel highlights the error to help you diagnose issues quickly.
Error indicators in the trace include:
- Red error icons next to failed operations in the tree view.
- STATUS field showing "ERROR" in the Span Detail section.
- Error Logs section displaying detailed error information.
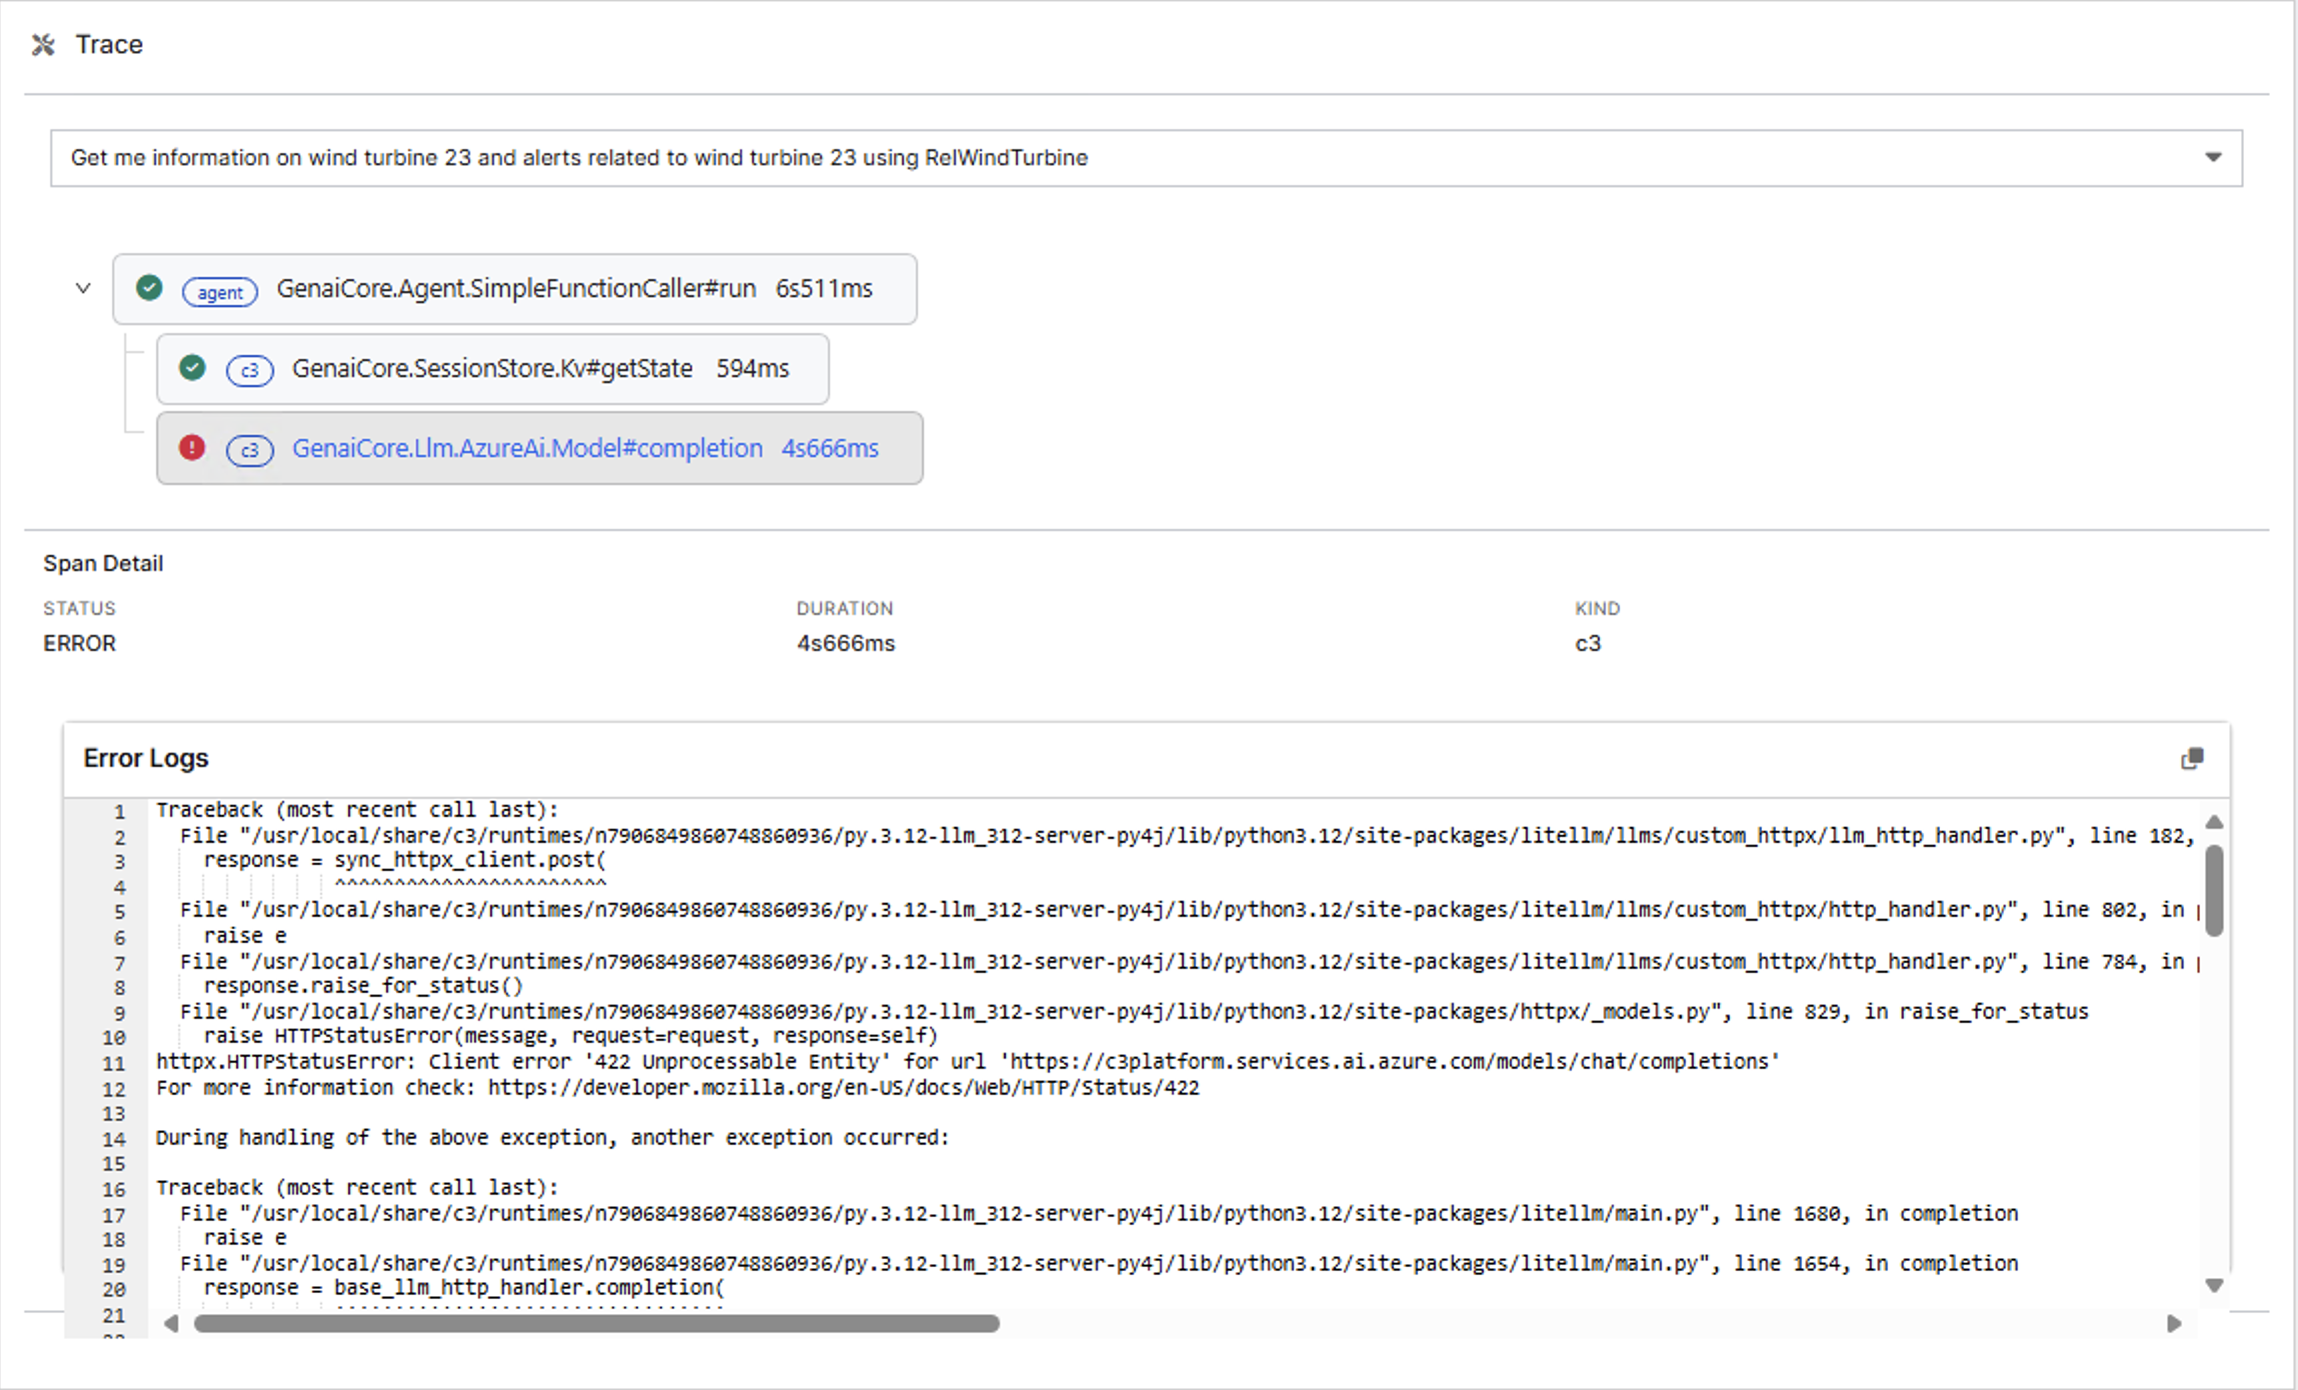
To diagnose an error:
- Locate the operation with a red error icon in the tree view.
- Select the failed operation to view its details.
- Review the Error Logs section in the Span Detail panel.
- Examine the error message and stack trace to identify the root cause.
The Error Logs section provides the complete error traceback, including file paths, line numbers, and specific error messages. For example, an error showing Function name was Empty Tool but must be a-z, A-Z, 0-9, or contain underscores and dashes indicates that the tool name contains invalid characters. Spaces are not allowed in tool names. To resolve this, rename the tool to use only letters, numbers, underscores, or dashes, such as "Empty_Tool" or "EmptyTool".