Common Errors in Jupyter
Jupyter has multiple states where an error can occur; each state helps determine how to troubleshoot issues.
In general, you'll find errors in one of the three states:
- Launch — An error occurs when you ask the service to start. JupyterHub is launching while the loading screen includes a gear icon.
- Spawn — An error occurs after JupyterHub has started and is in the process of building JupyterLab. JupyterLab is spawning while the loading screen includes a flask icon.
- Runtime — An error occurs after Jupyter has launched and spawned. You are working in JupyterLab when encountering issues.
Launch errors
You select 'Launch JupyterLab' from C3 AI Studio and encounter one of the following errors.
Jupyter is stuck on the initial loading screen.
Open Developer Tools in your web browser to review the error log. You can also verify Jupyter's status in C3 AI Console by calling JupyterHub.inst().stats.
Error: "The service did not initialize. Please try again or reach out to the cluster administrator if the issue does not resolve."
Run JupyterHub.ensureService() to identify specific errors. You may need to share the result of the call to your cluster administrator for further troubleshooting.
500 Internal Server
In C3 AI Console, select the Logs tab in the leftmost navigation bar. You'll see two tabs: Application and Server. The Application tab surfaces both key lifecycle events and errors from the server logs. Locate the error in Application and search for it in Server to identify the specific error.
403 Forbidden Error
Check application access and permissions in the User Management tab of the app's leftmost navigation. If your user account doesn't have the C3.JupyterLab or C3.Developer roles, contact your app administrator to add either role to your account.
503 Service Unavailable
The Kubernetes Jupyter pods are failing. Contact your cluster administrator to identify which pods are failing and why.
Spawn errors
In order to debug spawn errors, select event log on the spawn page. This log offers detailed information about the Kubernetes pod and cluster for identifying and resolving problems.
GPU spawn failures
If you are spawning a GPU profile, it may take more than the default timeout value of 10 minutes. Extend your app's timeout with the following commands:
JupyterHub.stop({waitForDestroy: true})
# update the config
JupyterHub.config().setConfigValue("singleUserStartTimeout", 900)
JupyterHub.ensureService({waitForReady: true})
900 is in second increments. This example increases the timeout value to 15 minutes.
Insufficient CPU or insufficient memory
Insufficient CPU or memory indicate that the cluster has a resource constraint problem. Your cluster admin can add more resources or remove orphaned resources to free up space.
Max node group size reached
If the spawn page states that the max node group size has been reached, the Kubernetes cluster is out of resources to schedule the pod for you. Your Role can add more resources or remove orphaned resources to free up space.
Runtime errors
Jupyter has successfully launched and spawned. You are now in JupyterLab and are experiencing errors.
"Disconnected" status and unexpected file structure
Open the log > jupyter.log to diagnose the error.
- Resolve
HealthCheck.poll()errors by verifying that app-specific folders exist on the external backing storage with your cluster operator. Keep in mind that this error is not specific to Jupyter;HealthCheck.poll()can be run from the console. - If you see
socket.gaierror: [Errno -2] Name or service not known, JupyterLab can't communicate back to the app. Contact the cluster operator to resolve cluster infrastucture or network issues.
"Connected" status with issues
Refer to Jupyter Service Details for debugging info related to the CPU, memory, disk utilization, Jupyter versioning, and logs. More information about debugging JupyterLab can be found in Configure and Use C3 AI-Managed JupyterLab Notebooks.
The modal shows the last 100 lines from when you open it. To access the complete log file, "Download."
Not enough memory
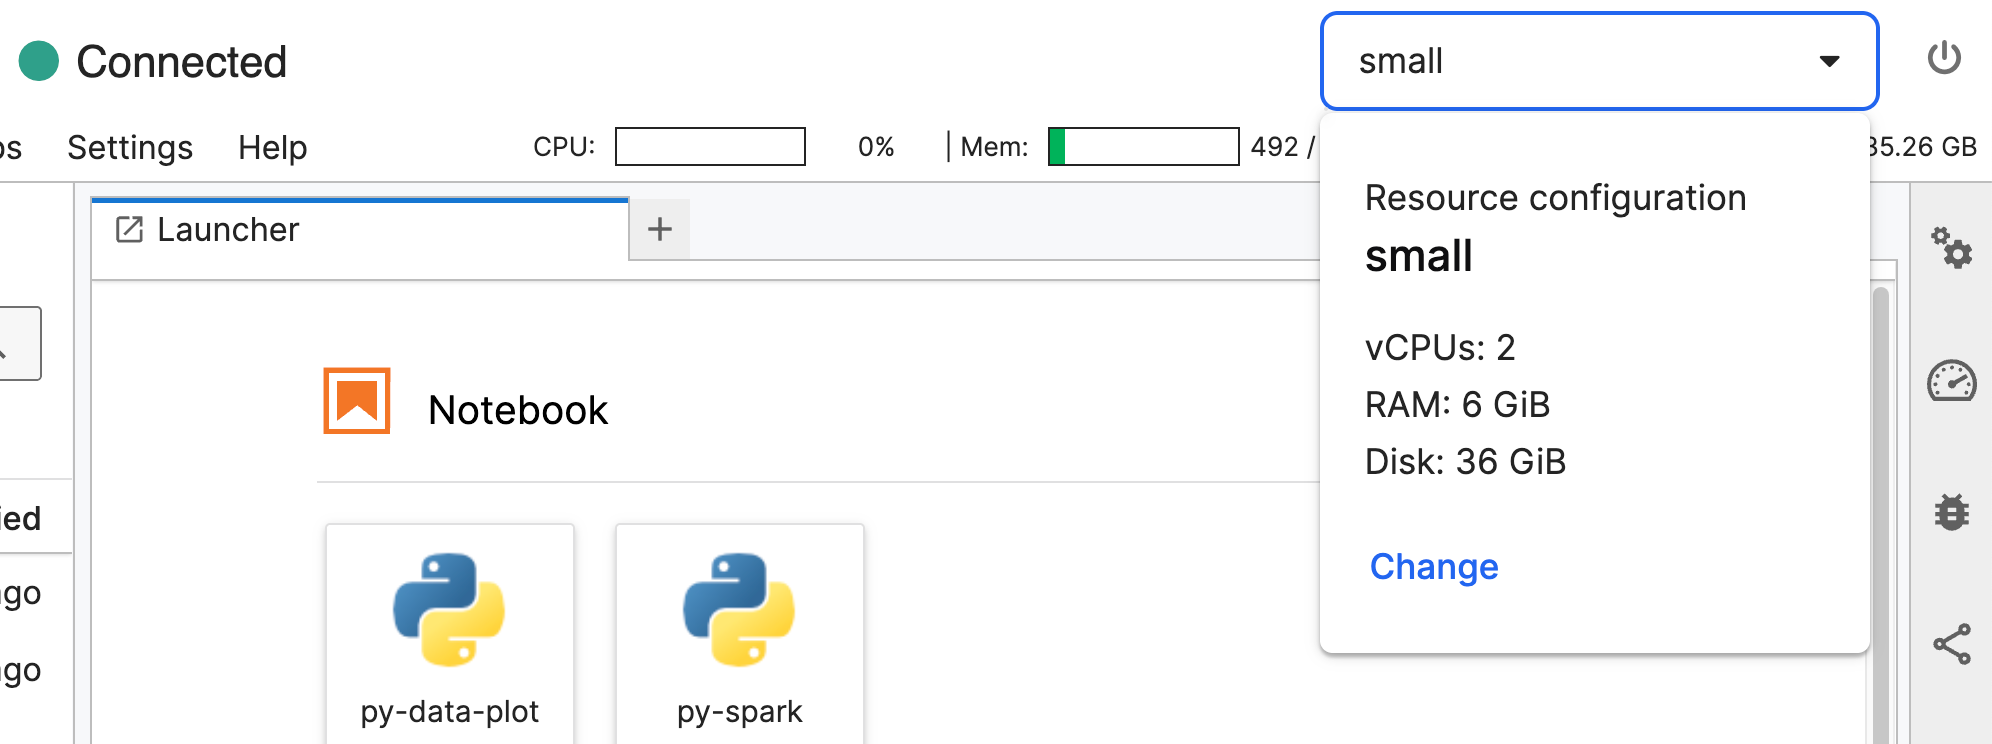
If you see the Mem or Disk reaching full capacity, or if you see consistent maximization of CPU, you can add more resources inside JupyterLab.
In the top right corner, select the dropdown menu that lists your resource configuration (small, medium, or large). Select change to open the Change resource configuration settings menu.
You can update the following settings:
- Size of CPUs and RAM
- Disk size
Select confirm to update your JuptyerLab environment. Refer to the usage bars in your JupyterLab environment to determine how to upgrade your resources. You can only expand resources; you cannot decrease them.
Your AppAdmin can set the upper limit of the Disk size slider by updating jupyterSingleUserStorageCapacityLimit in the JupyterHub configuration. If an app admin changes the upper limit to be lower than your JupyterLab's disk size capacity, you cannot update this slider.
Self Diagnostics API
If the JupyterHub.inst().status never returns available or the JupyterLab server pod is stuck which spawning, an app administrator can run JupyterHub.diagnostics() to retrieve information about the state of the Jupyter pods, which can reveal more information for debugging.
Say you have started JupyterHub either by navigating from the application platform or by running JupyterHub.ensureService() in the console. If Jupyter doesn't run after waiting five minutes, run the following code snippet in console to see the status of the containers.
namePrefix = JupyterHub.config().namePrefix
jupyterPods = JupyterHub.diagnostics().pods
jupyterPods.filter(pod=>pod.resourceName.includes(namePrefix)).forEach(pod=> console.log(pod.resourceName, pod.status))
Refer to the following possible responses:
- Insufficient memory/cpu — Contact your cluster administrator to add resources or remove unused resources.
- Volume note affinity conflict — Terminate your Jupyter Service by calling
JupyterHub.stop{waitForDestroy: true}). This call deletes all unnecessary storage, including unsynced files for every user. Proceed with caution.