Monitor Environments and Applications
C3 AI Studio provides visual monitoring tools on computational resources usage for your environment or application. Use these monitoring tools to see workload metrics while using your application.
You can configure alerts for application and environment health. For steps on how to do so, see Configure Alerts to Monitor System Health.
Monitor an environment
C3 AI Studio provides a few different options for accessing information about an environment, depending on its current status.
Monitor environment creation
After creating an environment, monitor its creation with any of the following methods:
- Use the status indicator in C3 AI Studio to track the environment creation process. The status indicator is in the Status column of the environments list page.
- Use the following URL format to access the environment directly in the C3 AI console:
https://<cluster domain>/<env name>/c3/console/index.html
Replace<cluster domain>with your cluster domain, and<env name>with the environment name.
Monitor an environment after creation
To access the environment monitoring dashboard in C3 AI Studio:
- In the navigation panel, select Envs to navigate to the Environments list.
- Select your target Environment name in the list to navigate to the environment details page.
- In the environment sidebar, select Env Monitoring.
The following environment metrics are available in charts:
- CPU usage
- Memory usage
- Container (node) restarts
- JVM threads state
- Storage
- Per-process memory utilization
Monitor an application
Application monitoring is not enabled by default. You should only enable application monitoring for critical QA or production applications.
Enable application monitoring
Only Studio admin users can enable application monitoring for your application. The instructions below are for Studio admin users to enable application monitoring.
- Navigate to the C3 AI console in one of the following ways:
- Select a target Application name from the application list, then select the console icon.
- Navigate directly to:
https://<cluster domain>/<env name>/<app name>/console/index.html.
Replace<cluster domain>,<env name>, and<app name>with appropriate values.
- Open Chrome Developer Tools using
Ctrl + Shift + Jon Windows, orCmd + Option + Jon Mac. - Run the following command:
   // get the application ID
   var appId = C3.app().id;
   StudioCluster.Monitoring.enable(appId);
When application monitoring is enabled, application monitoring dashboards are available:
- Navigate to the target application in one of the following ways:
- Select the application card on the C3 AI Studio homepage.
- Select the application card on its parent environment details page.
- Select the Application name from the applications list.
- In the application sidebar, select Monitor > App Monitoring.
Available monitoring dashboards
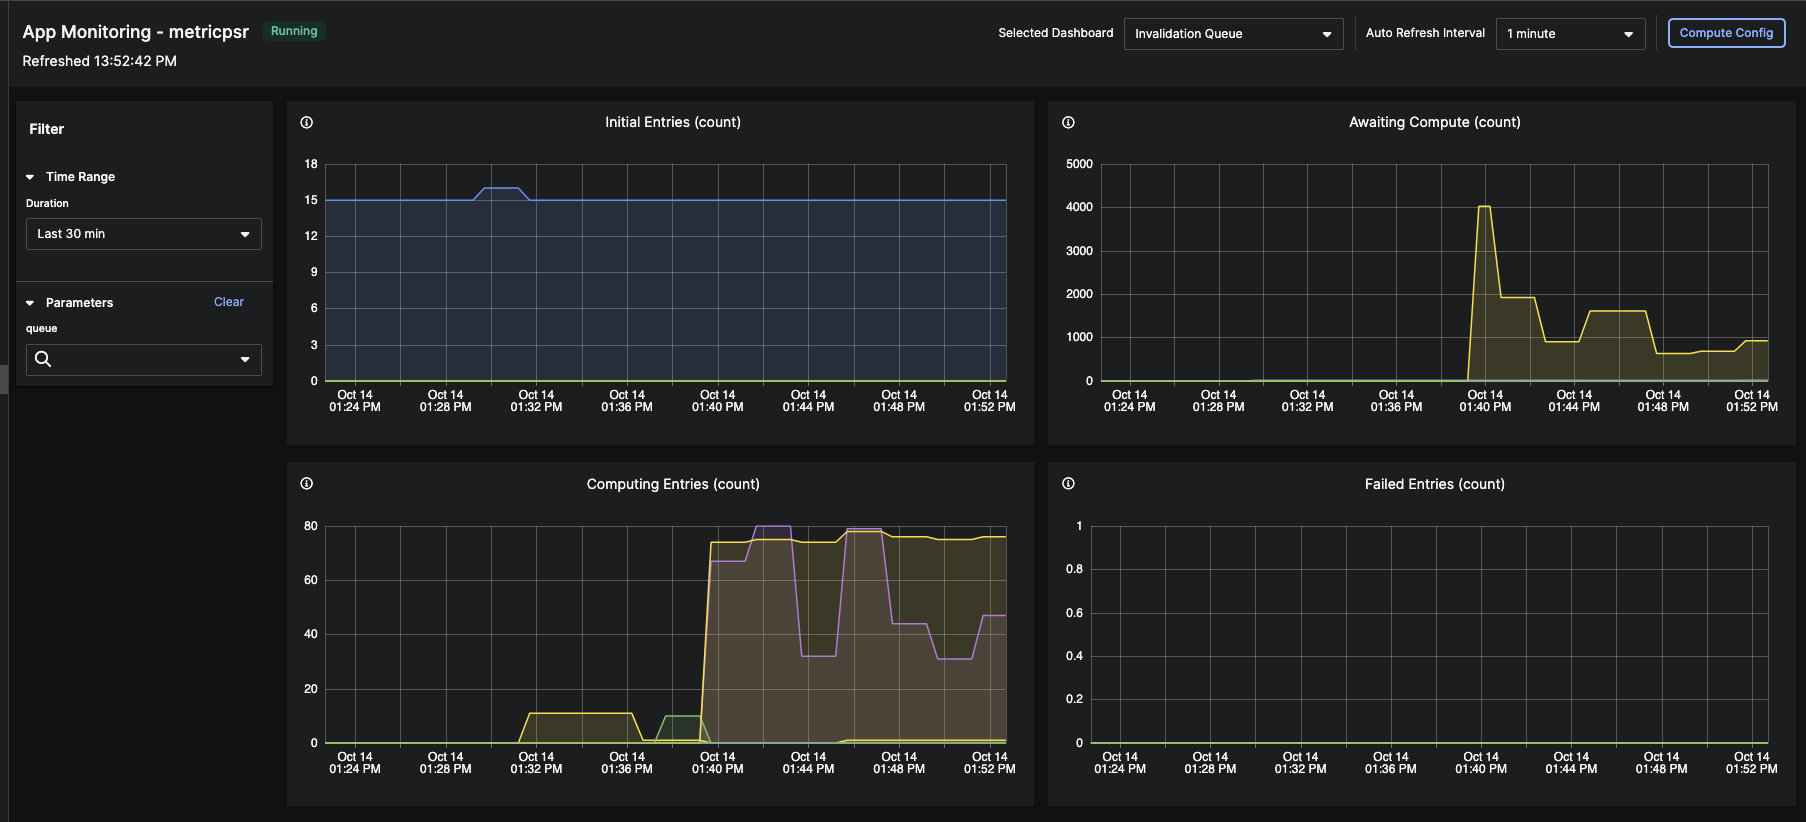
Use the Selected Dashboard menu to view different dashboards for your application or environment. Use the Filter panel to change the data time range or show data from a specific node. Use the Auto Refresh interval menu to set how often the dashboard is updated.
The default metric scrape frequency is 30 seconds. Dashboards do not record variance in time series shorter than 30 seconds.
Application monitoring dashboards
The following dashboards are available for application resource monitoring:
- Invalidation Queue
- ML Jobs
Not all queues are supported. For more information on the Invalidation Queue, see Monitor and Manage Queues.
Application or environment monitoring dashboards
The following dashboards are available in both application and environment monitoring contexts. Select a dashboards to monitor an environment or an application in a shared environment.
In single node environments (SNEs), applications share resources with their parent environment. As a result, you can only access these dashboards for environment monitoring in SNEs.
- Compute Resources (unavailable for SNE applications)
- Storage Utilization (unavailable for SNE applications)
To learn more about monitoring storage utilization, see Monitor Environment and Application Storage Utilization.