1-Sample Proportion
Use Visual Notebooks to determine whether the proportion of true values in a sample differs significantly from a specified value.
Configuration
| Field | Description |
|---|---|
| Name default=none | Name of the node |
| An optional user-specified node name displayed in the workspace, both on the node and in the dataframe as a tab. | |
| Column Required | Column to use in the calculation |
| Select the column that contains the data you want to use in the calculation. The selected column must contain Boolean values. | |
| Target value for proportion (%) Required | The proportion of true values in the larger population |
| Enter a decimal or integer. | |
What do you want to determine? default=is the % proportion of the sample column that is labeled as true, greater than the target value% | The relationship between the target proportion and the sample proportion |
| Select less than, greater than, or different than for the selected test metric. Selecting different than runs a 2-tailed test, while selecting greater than or less than runs a 1-tailed test. | |
Desired Significance Level - 𝛼 default=0.05 | The probability of an error |
| Select 0.01, 0.05, 0.1, 0.2, or Custom. This value represents the confidence in the test's findings. | |
| Custom value for alpha default=none | Custom probability of an error |
| If Custom is selected for the Desired Significance Level, enter a number between 0 and 1 for the alpha value. |
Node Inputs/Outputs
| Input | A dataframe in Visual Notebooks |
|---|---|
| Output | Results of the 1-sample proportion test |
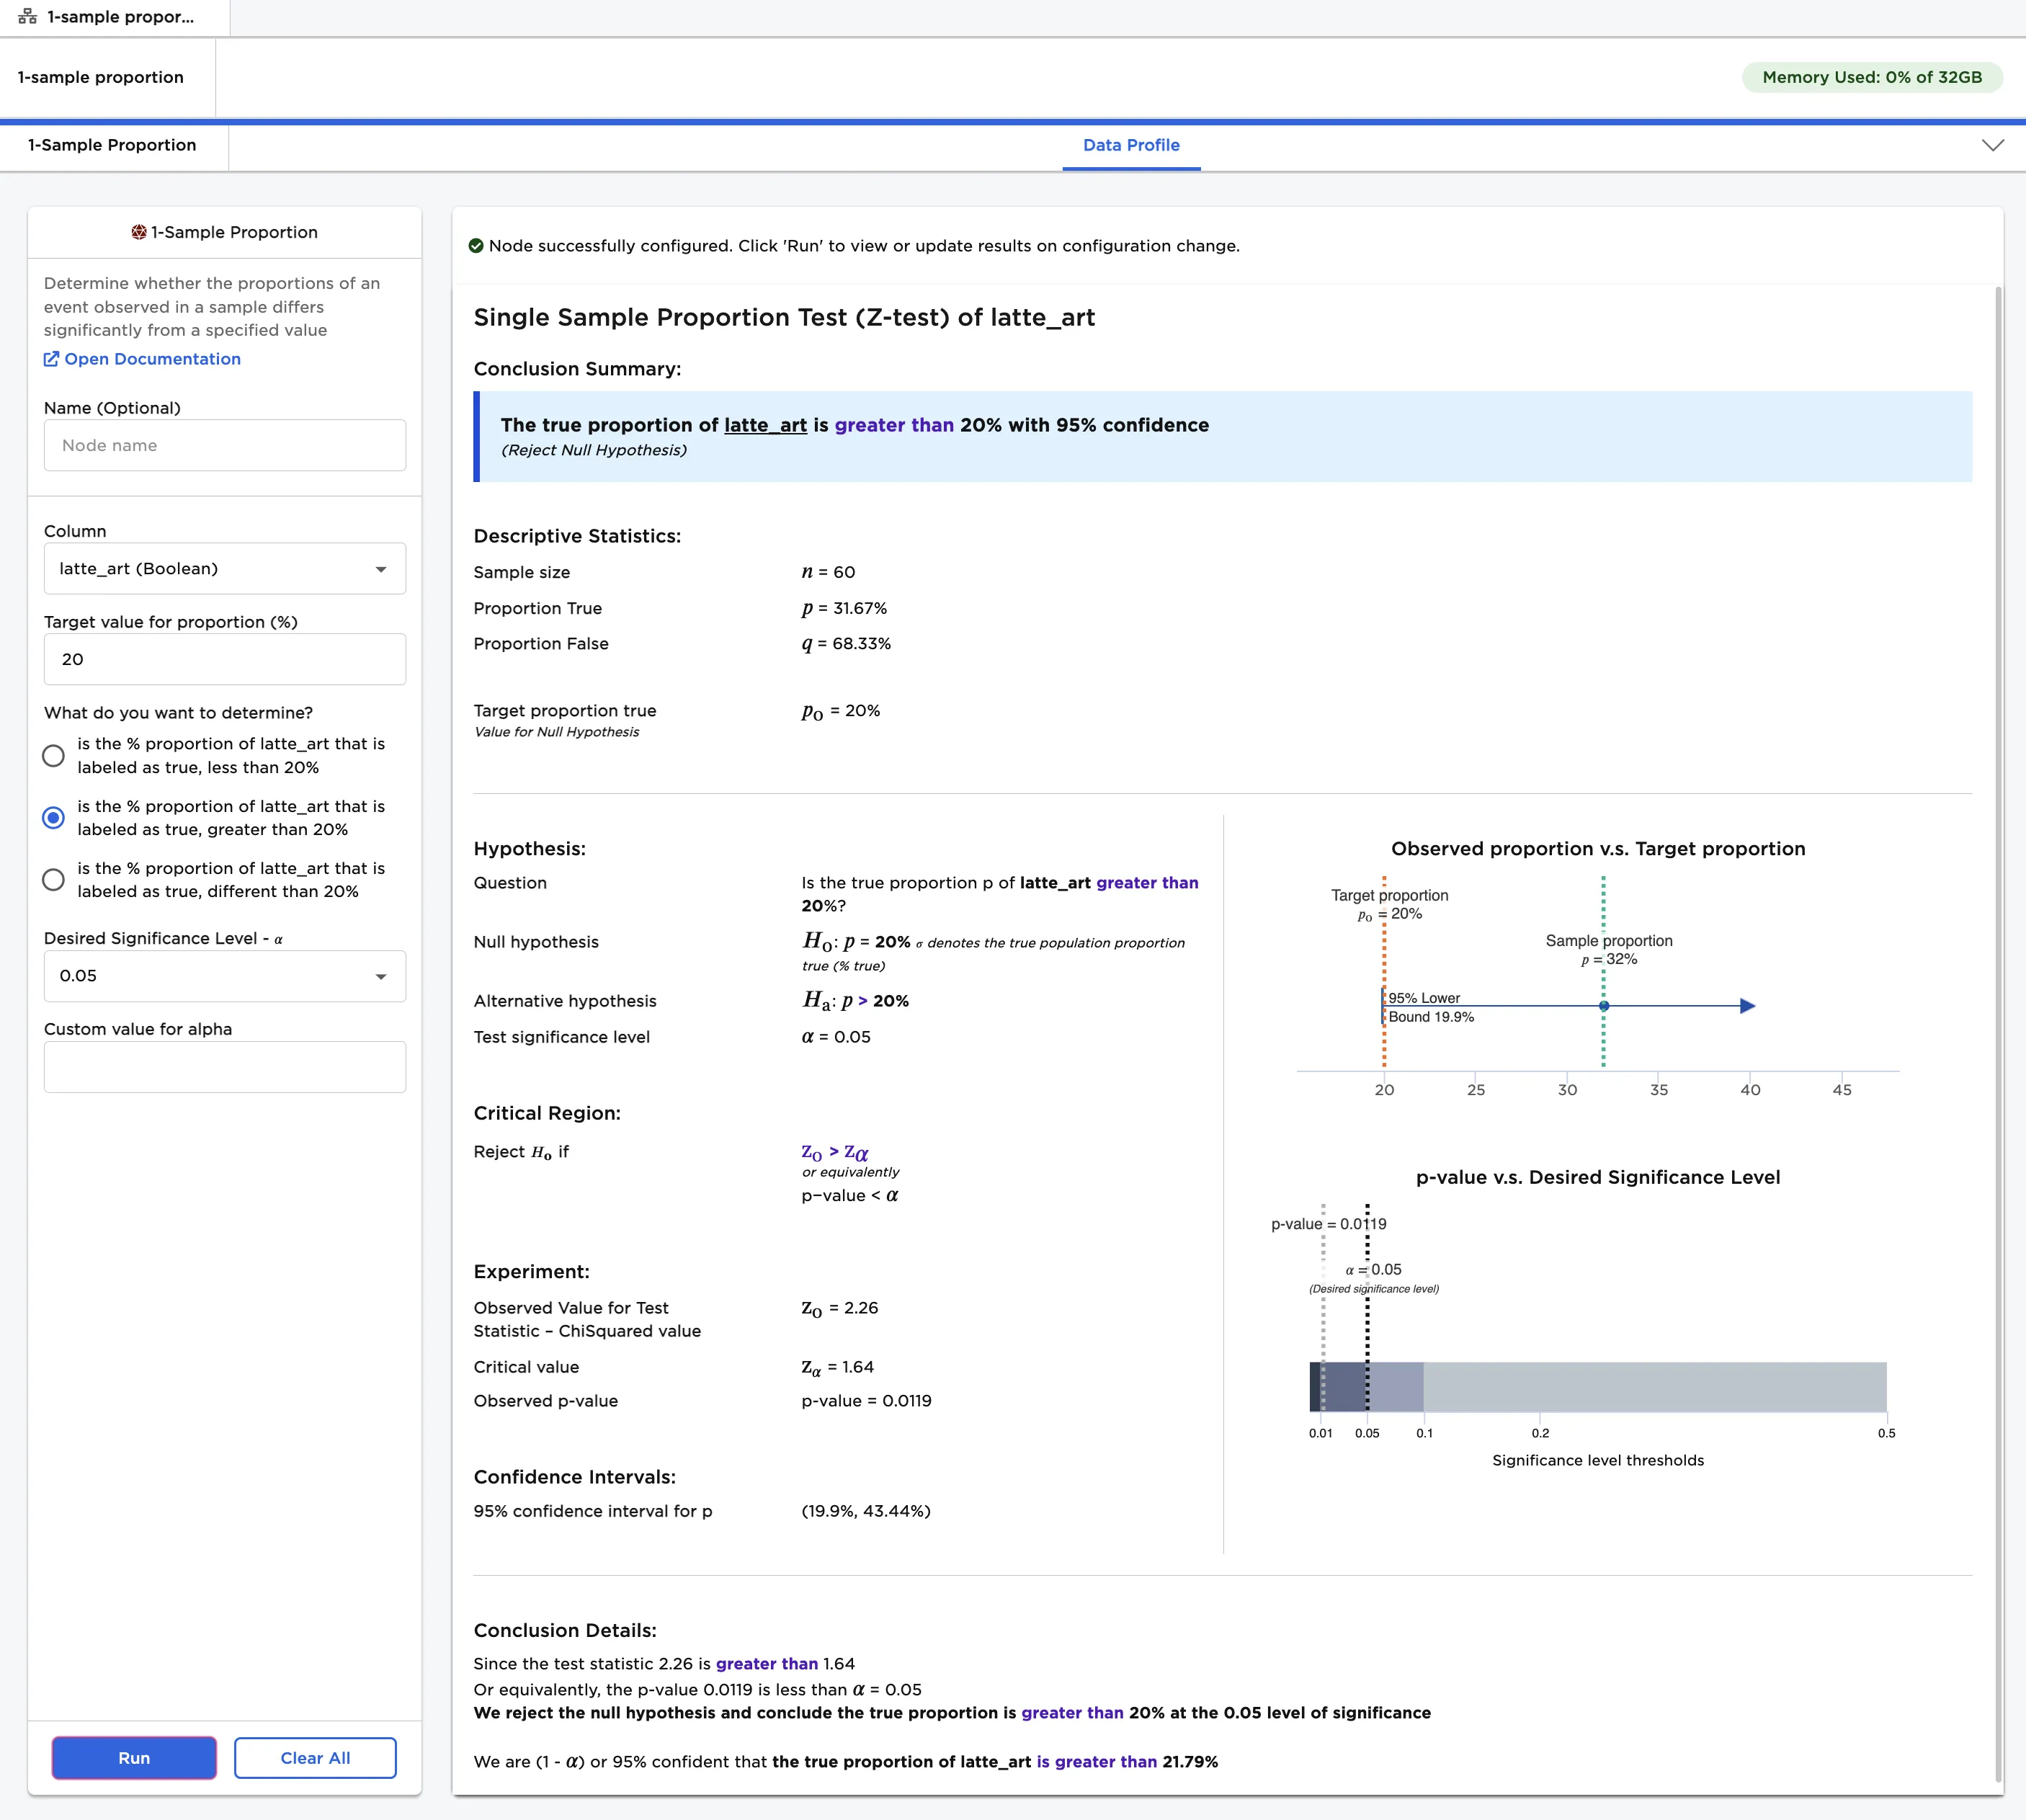
Figure 1: Example output
Examples
Imagine that you frequently visit independent coffee shops and order lattes. You notice that your lattes sometimes feature latte art, and sometimes do not. You decide that you want to determine whether you are likely to receive a latte with latte art. When you go to an independent coffee shop, what is the chance that your latte has art?
You can't go to all of the independent coffee shops in the world to find the answer, but you can record your experiences at a small selection of cafés and try to gain insight from the sample. Over a period of time, you order 60 lattes from various independent coffee shops. You note the name of the coffee shop, the price of the latte, and whether the drink features latte art. The data you collect is shown in Figure 2.
Note that the column "latte_art" contains Boolean values. Lattes with art have a value of "true," while lattes without art have a value of "false." You want to determine the proportion of true values within the total latte sample. This will represent the likelihood of receiving latte art at any café in the world, if your café sample is a good representation of the world's cafés.
To follow along with the examples.
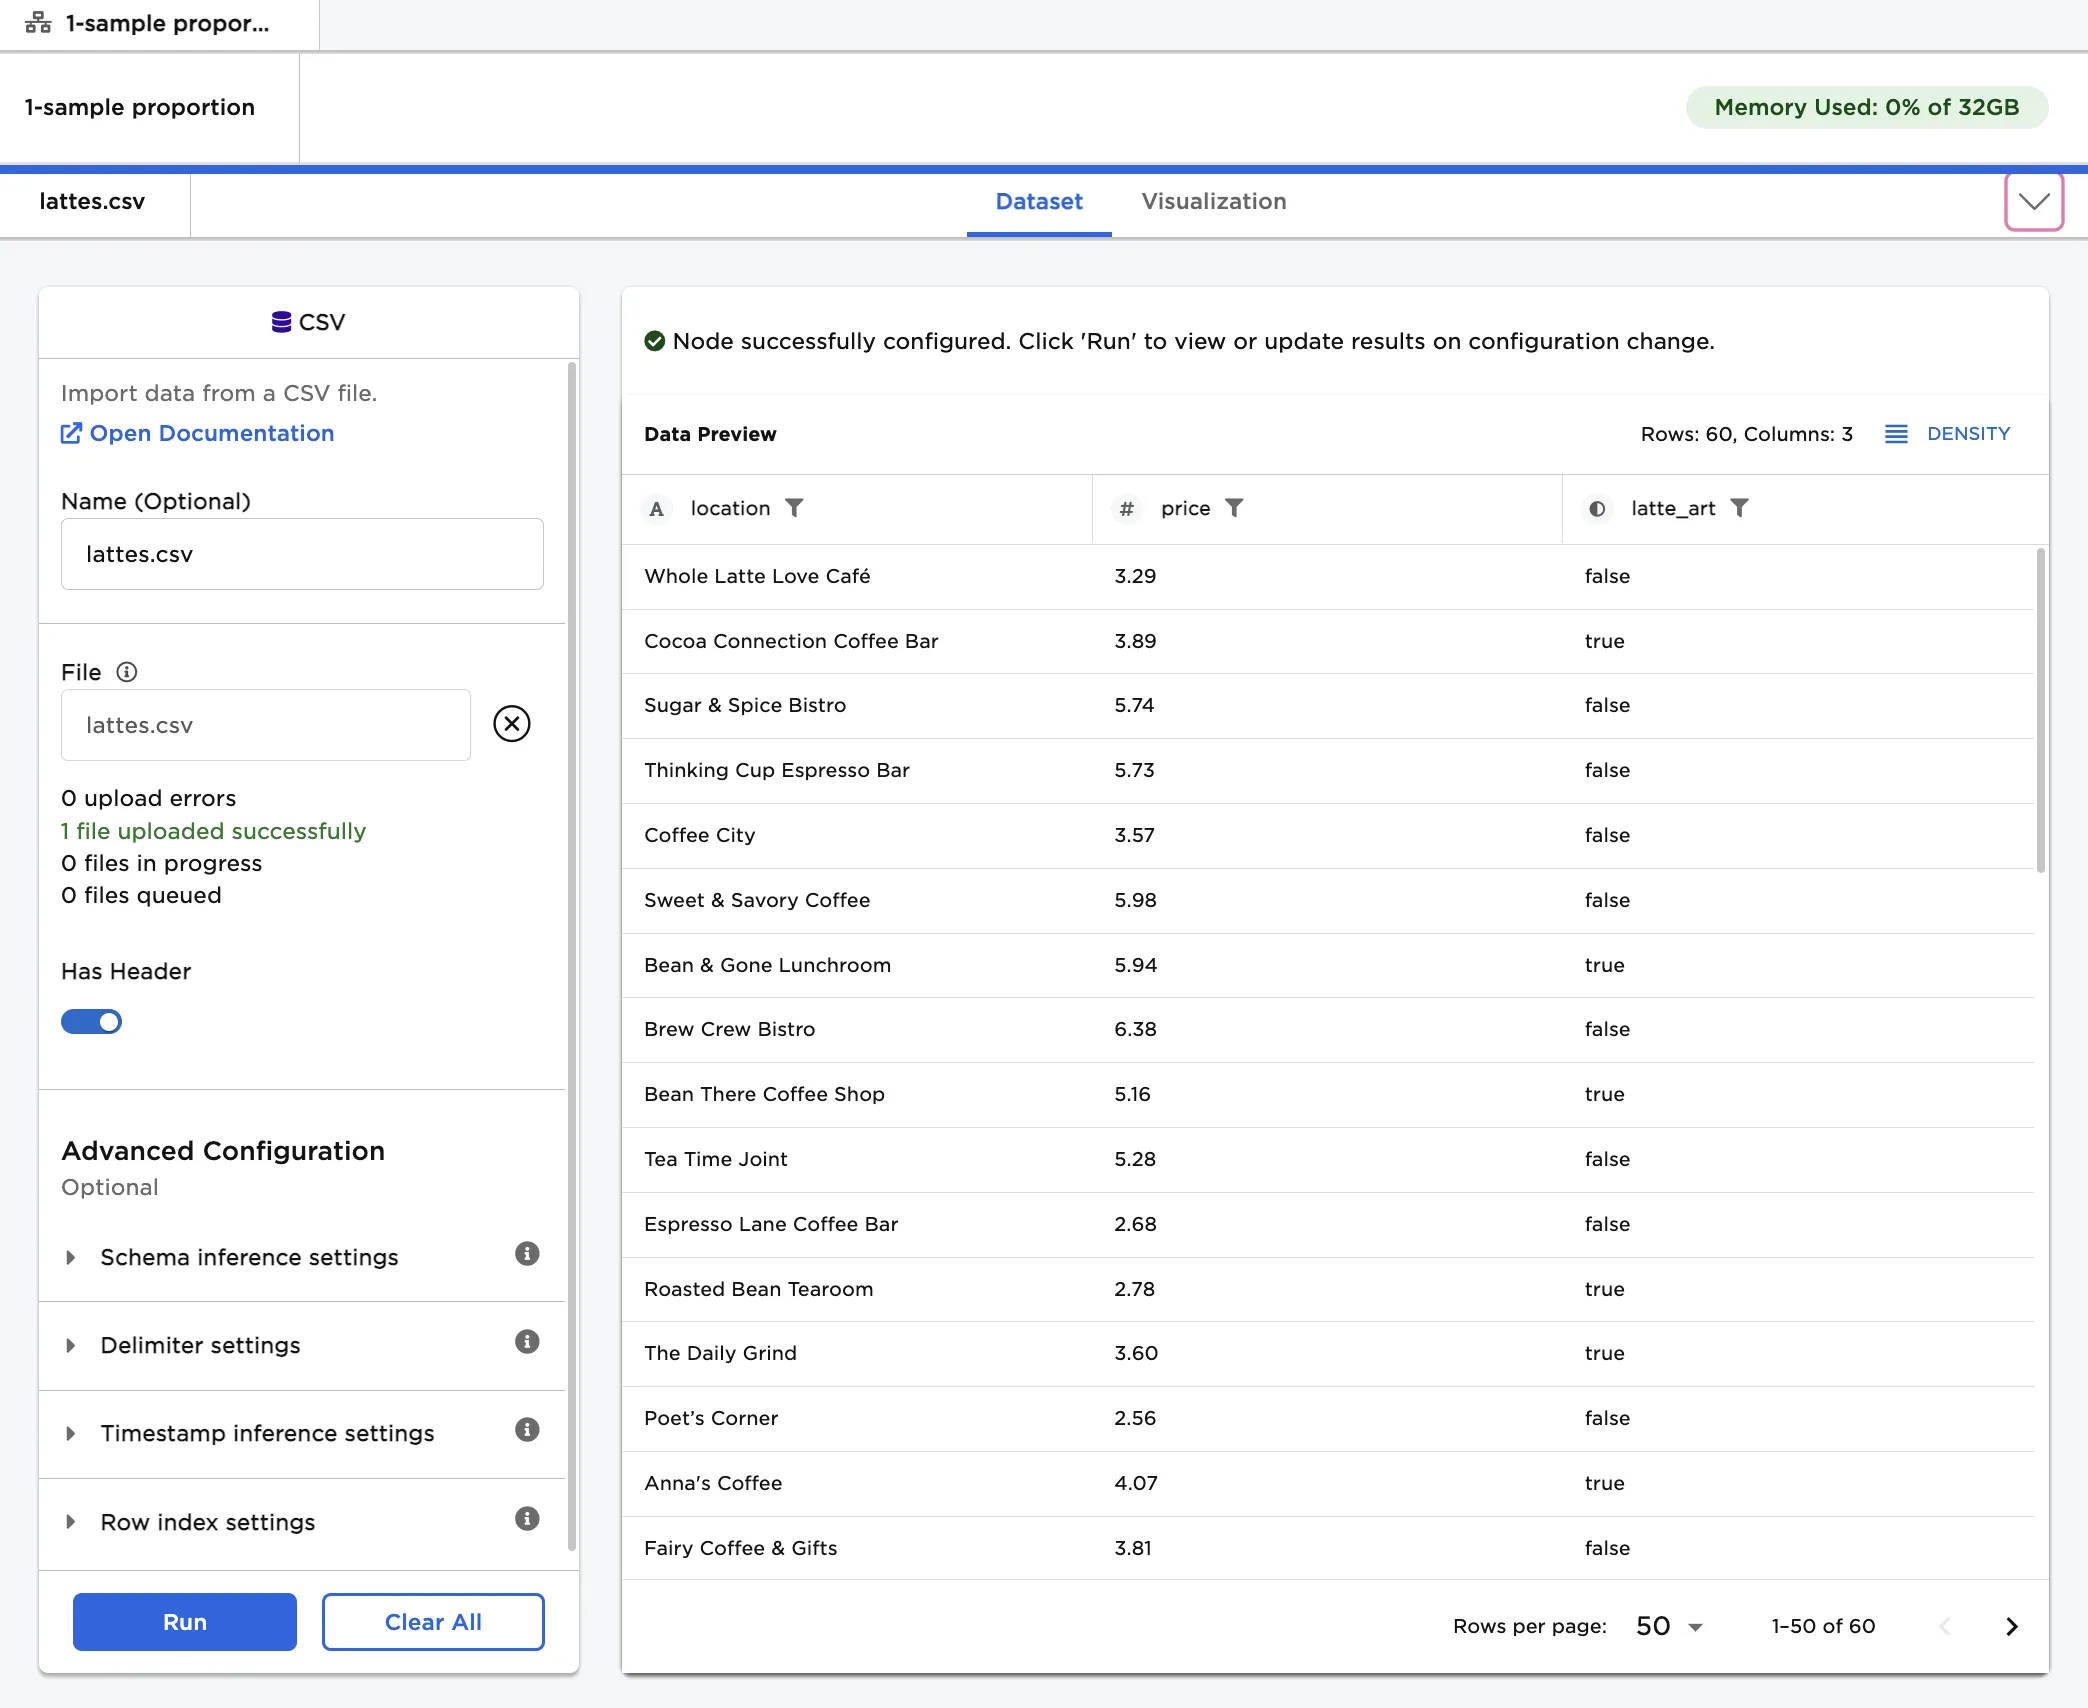
Figure 2: Example input
You suspect that the percentage of lattes with art is greater than 20%. Given this use case, the following terminology is used in the rest of this example:
- "Population" is the immeasurable group of lattes in the world.
- "Sample" is the small, hand-collected group of lattes used for testing.
- The "null hypothesis" is the information you are disputing: the proportion of true values in the latte population is 20%.
- The "alternative hypothesis" is the theory you are proposing: the proportion of true values in the latte population is greater than 20%.
Follow the steps below to determine whether the proportion of true values in the population is greater than 20%.
- Connect a 1-Sample Proportion node to an existing node. In this example, connect the 1-Sample Proportion node to a CSV node that contains the sample data.
- Select the 1-Sample Proportion node to configure it.
- Select latte_art (Boolean) for the Column field.
- Enter "20" for the Target value for proportion (%) field.
- Select Run to perform a 1-sample proportion test with the default settings.
Notice that Visual Notebooks presents a page of results. At the top of the page is a single-sentence summary. In this case, the test determined that the proportion of true values in the population is greater than 20% with 95% confidence. In other words, you are likely to receive a latte with art more than 20% of the time.
Figure 3: 1-sample proportion test with default settings
The desired significance level, or alpha (𝛼), is the probability of making a false conclusion. A small alpha value allows you to make strong, well-tested claims. A large alpha value allows you to make more general, speculative conclusions. Alpha is used to calculate the confidence that the result of the test is accurate.
Follow the steps below to run a 1-sample proportion test with a large alpha value.
- Select Custom for the Desired Significance Level - 𝛼 field.
- Enter "0.4" for the Custom value for alpha field
- Select Run to perform a 1-sample proportion test with a custom alpha value.
As noted, using a large alpha value results in more speculative predictions. Running the node with an alpha value of 0.4 suggests that the proportion of true values in the population is actually greater than a minimum value 30.15%, but the confidence in that prediction is only 60%. When alpha was set to 0.05, Ex Machina determined that the proportion of true values was greater than a minimum value of 21.79% with 95% confidence.
Notice that alpha is related to the p-value. In this example, the p-value is the likelihood that the proportion of true values in the population is still 20% even though the proportion of true values in the sample is greater than 20%. The p-value is extremely small, so you can assume that the proportion of true values in the population is greater than 20%. If the p-value is less than the specified alpha value, the test is deemed significant.
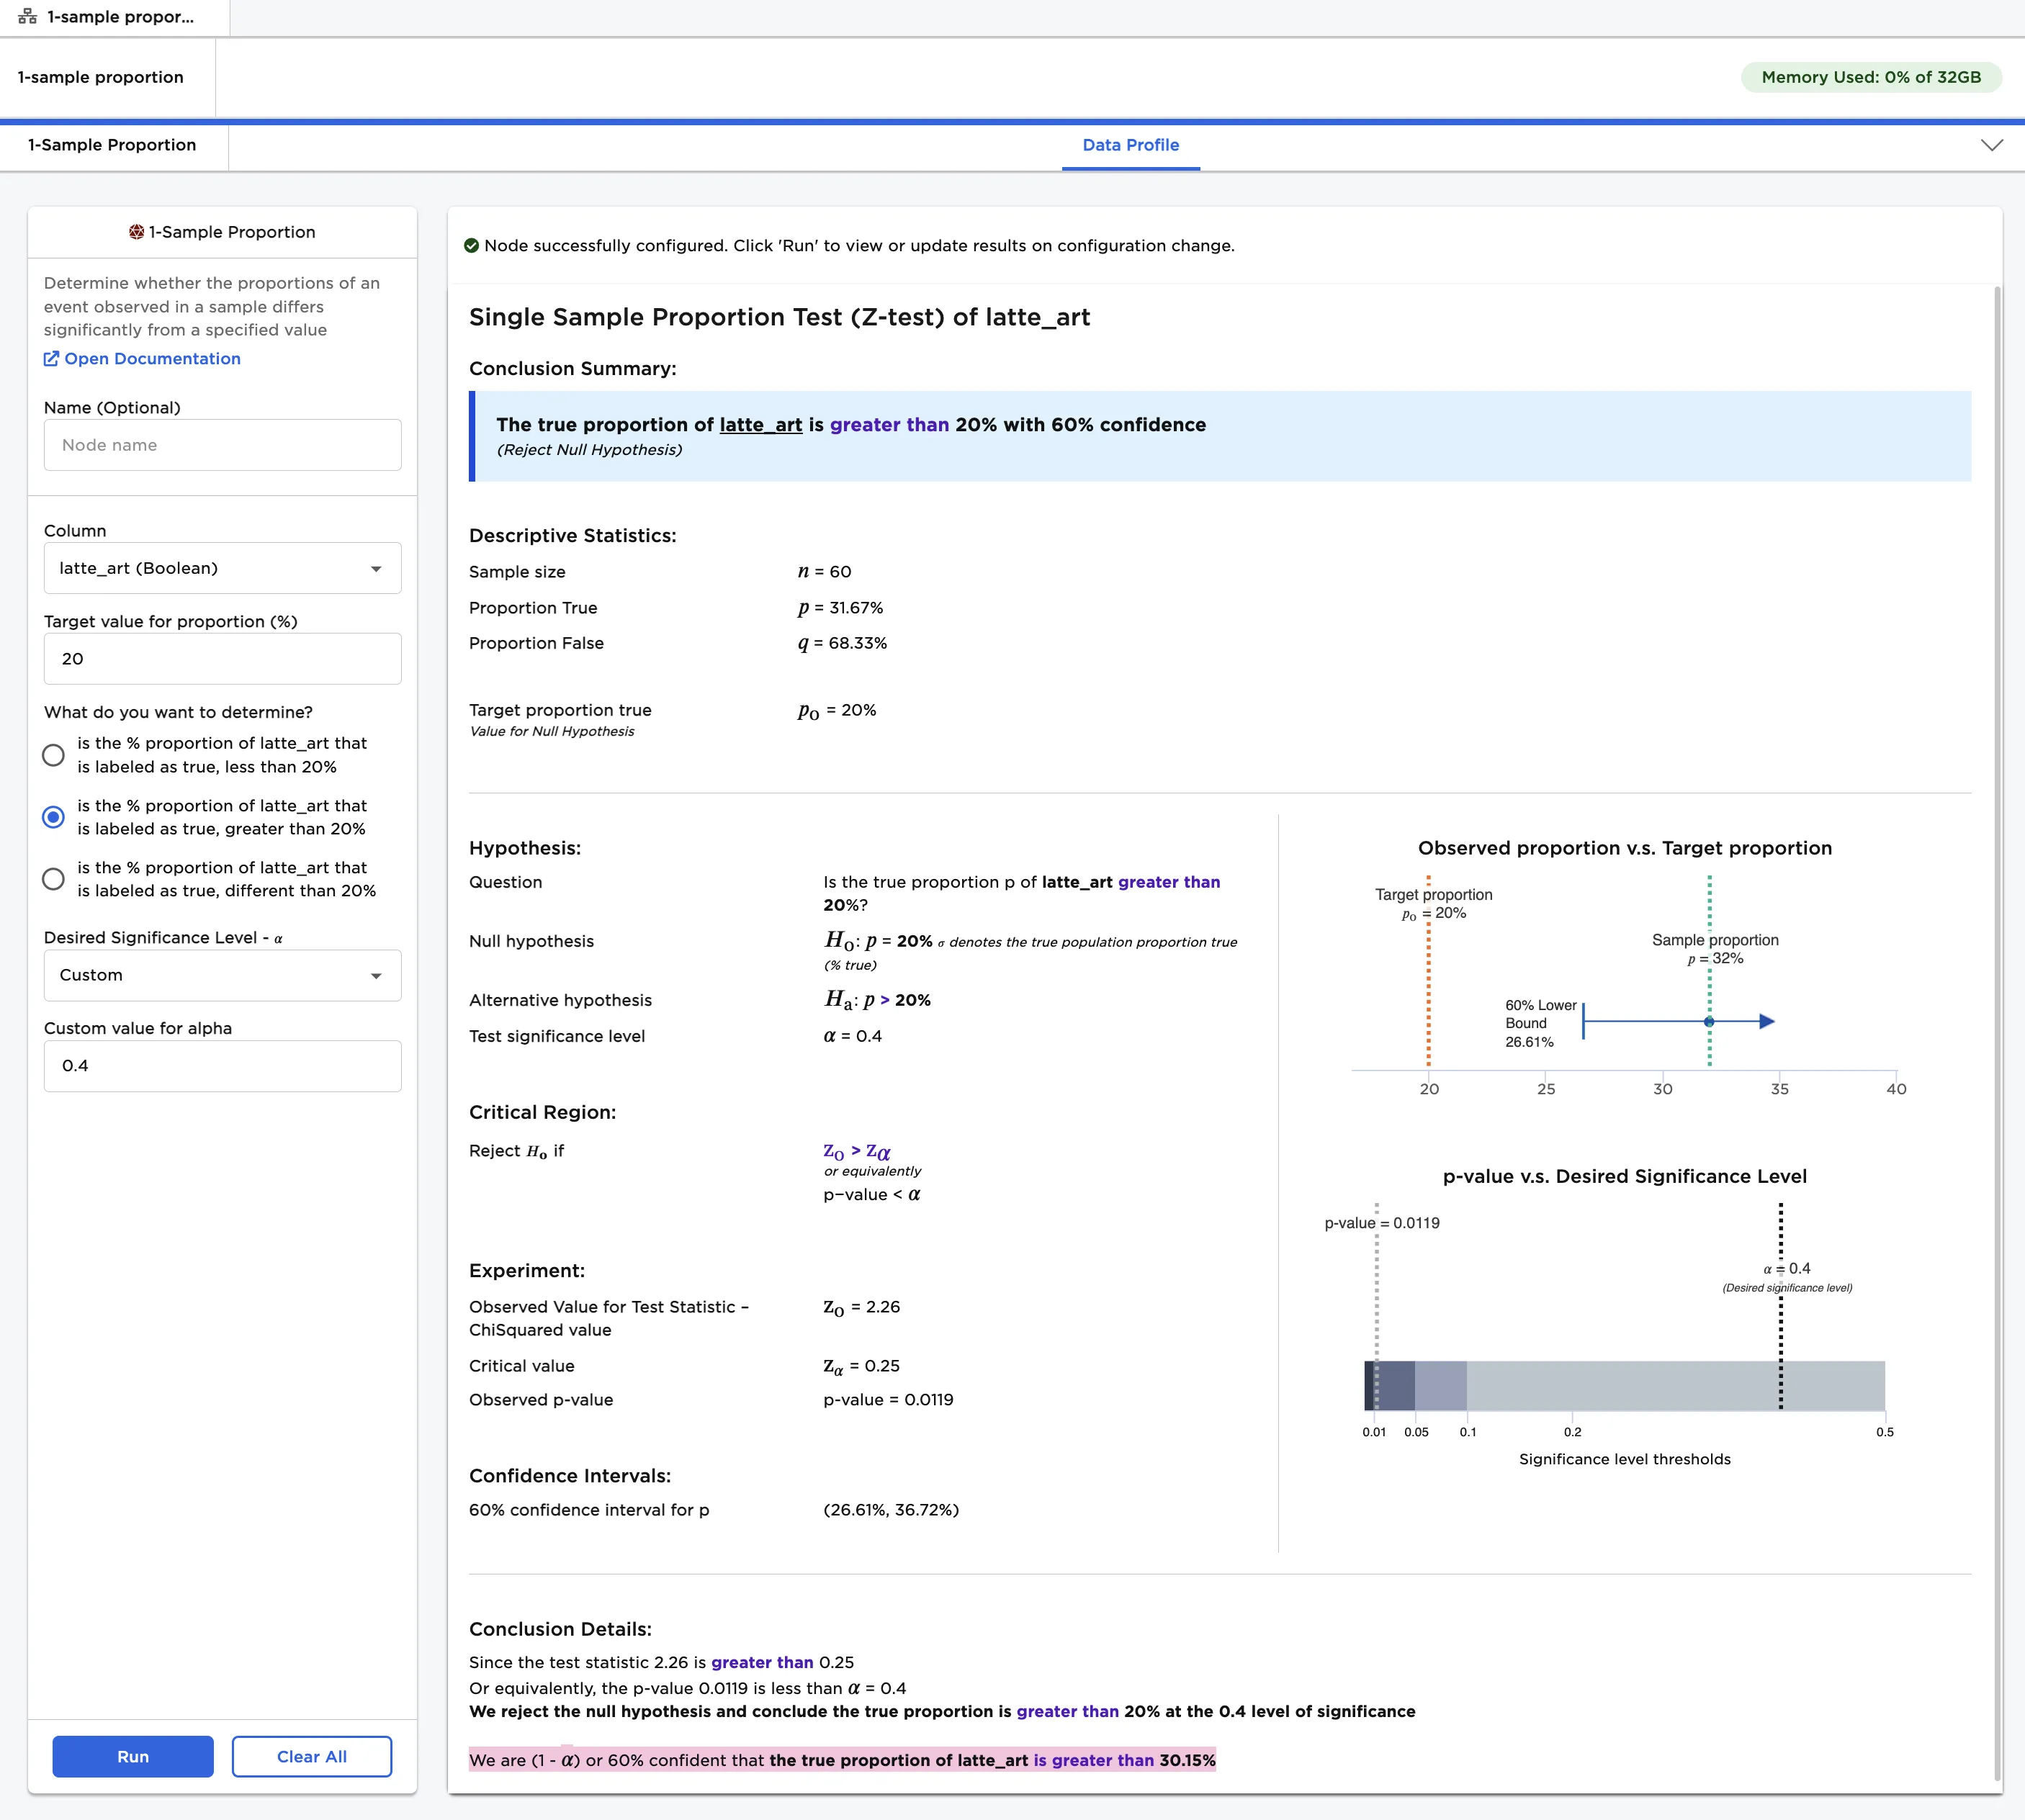
Figure 4: 1-sample proportion test with a custom alpha value
Since is the % proportion of latte_art that is labeled as true, greater than 20% was selected in previous examples, Visual Notebooks performed a 1-tailed test. A 1-tailed test determines whether the proportion differs in one direction. Selecting is the % proportion of latte_art that is labeled as true, less than 20% would also perform a 1-tailed test.
For this example, select is the % proportion of latte_art that is labeled as true, different than 20% to perform a 2-tailed test. A 2-tailed test determines whether the proportion is different than 20% in either direction--greater than or less than. Instead of just outputting a minimum or maximum value for the population proportion, a 2-tailed test outputs a range of possible values.
- Select 0.05 for the Desired Significance Level - 𝛼 field.
- Change the What do you want to determine? field to is the % proportion of latte_art that is labeled as true, different than 20%
- Select Run to perform a 2-tailed 1-sample proportion test.
Notice that the output looks very similar to the output for a 1-tailed test. Instead of only calculating a lower bound, Visual Notebooks calculates both a lower bound and an upper bound for the proportion of true values in the population. The chance that you will receive a latte with art is between 19.9% and 43.44%.
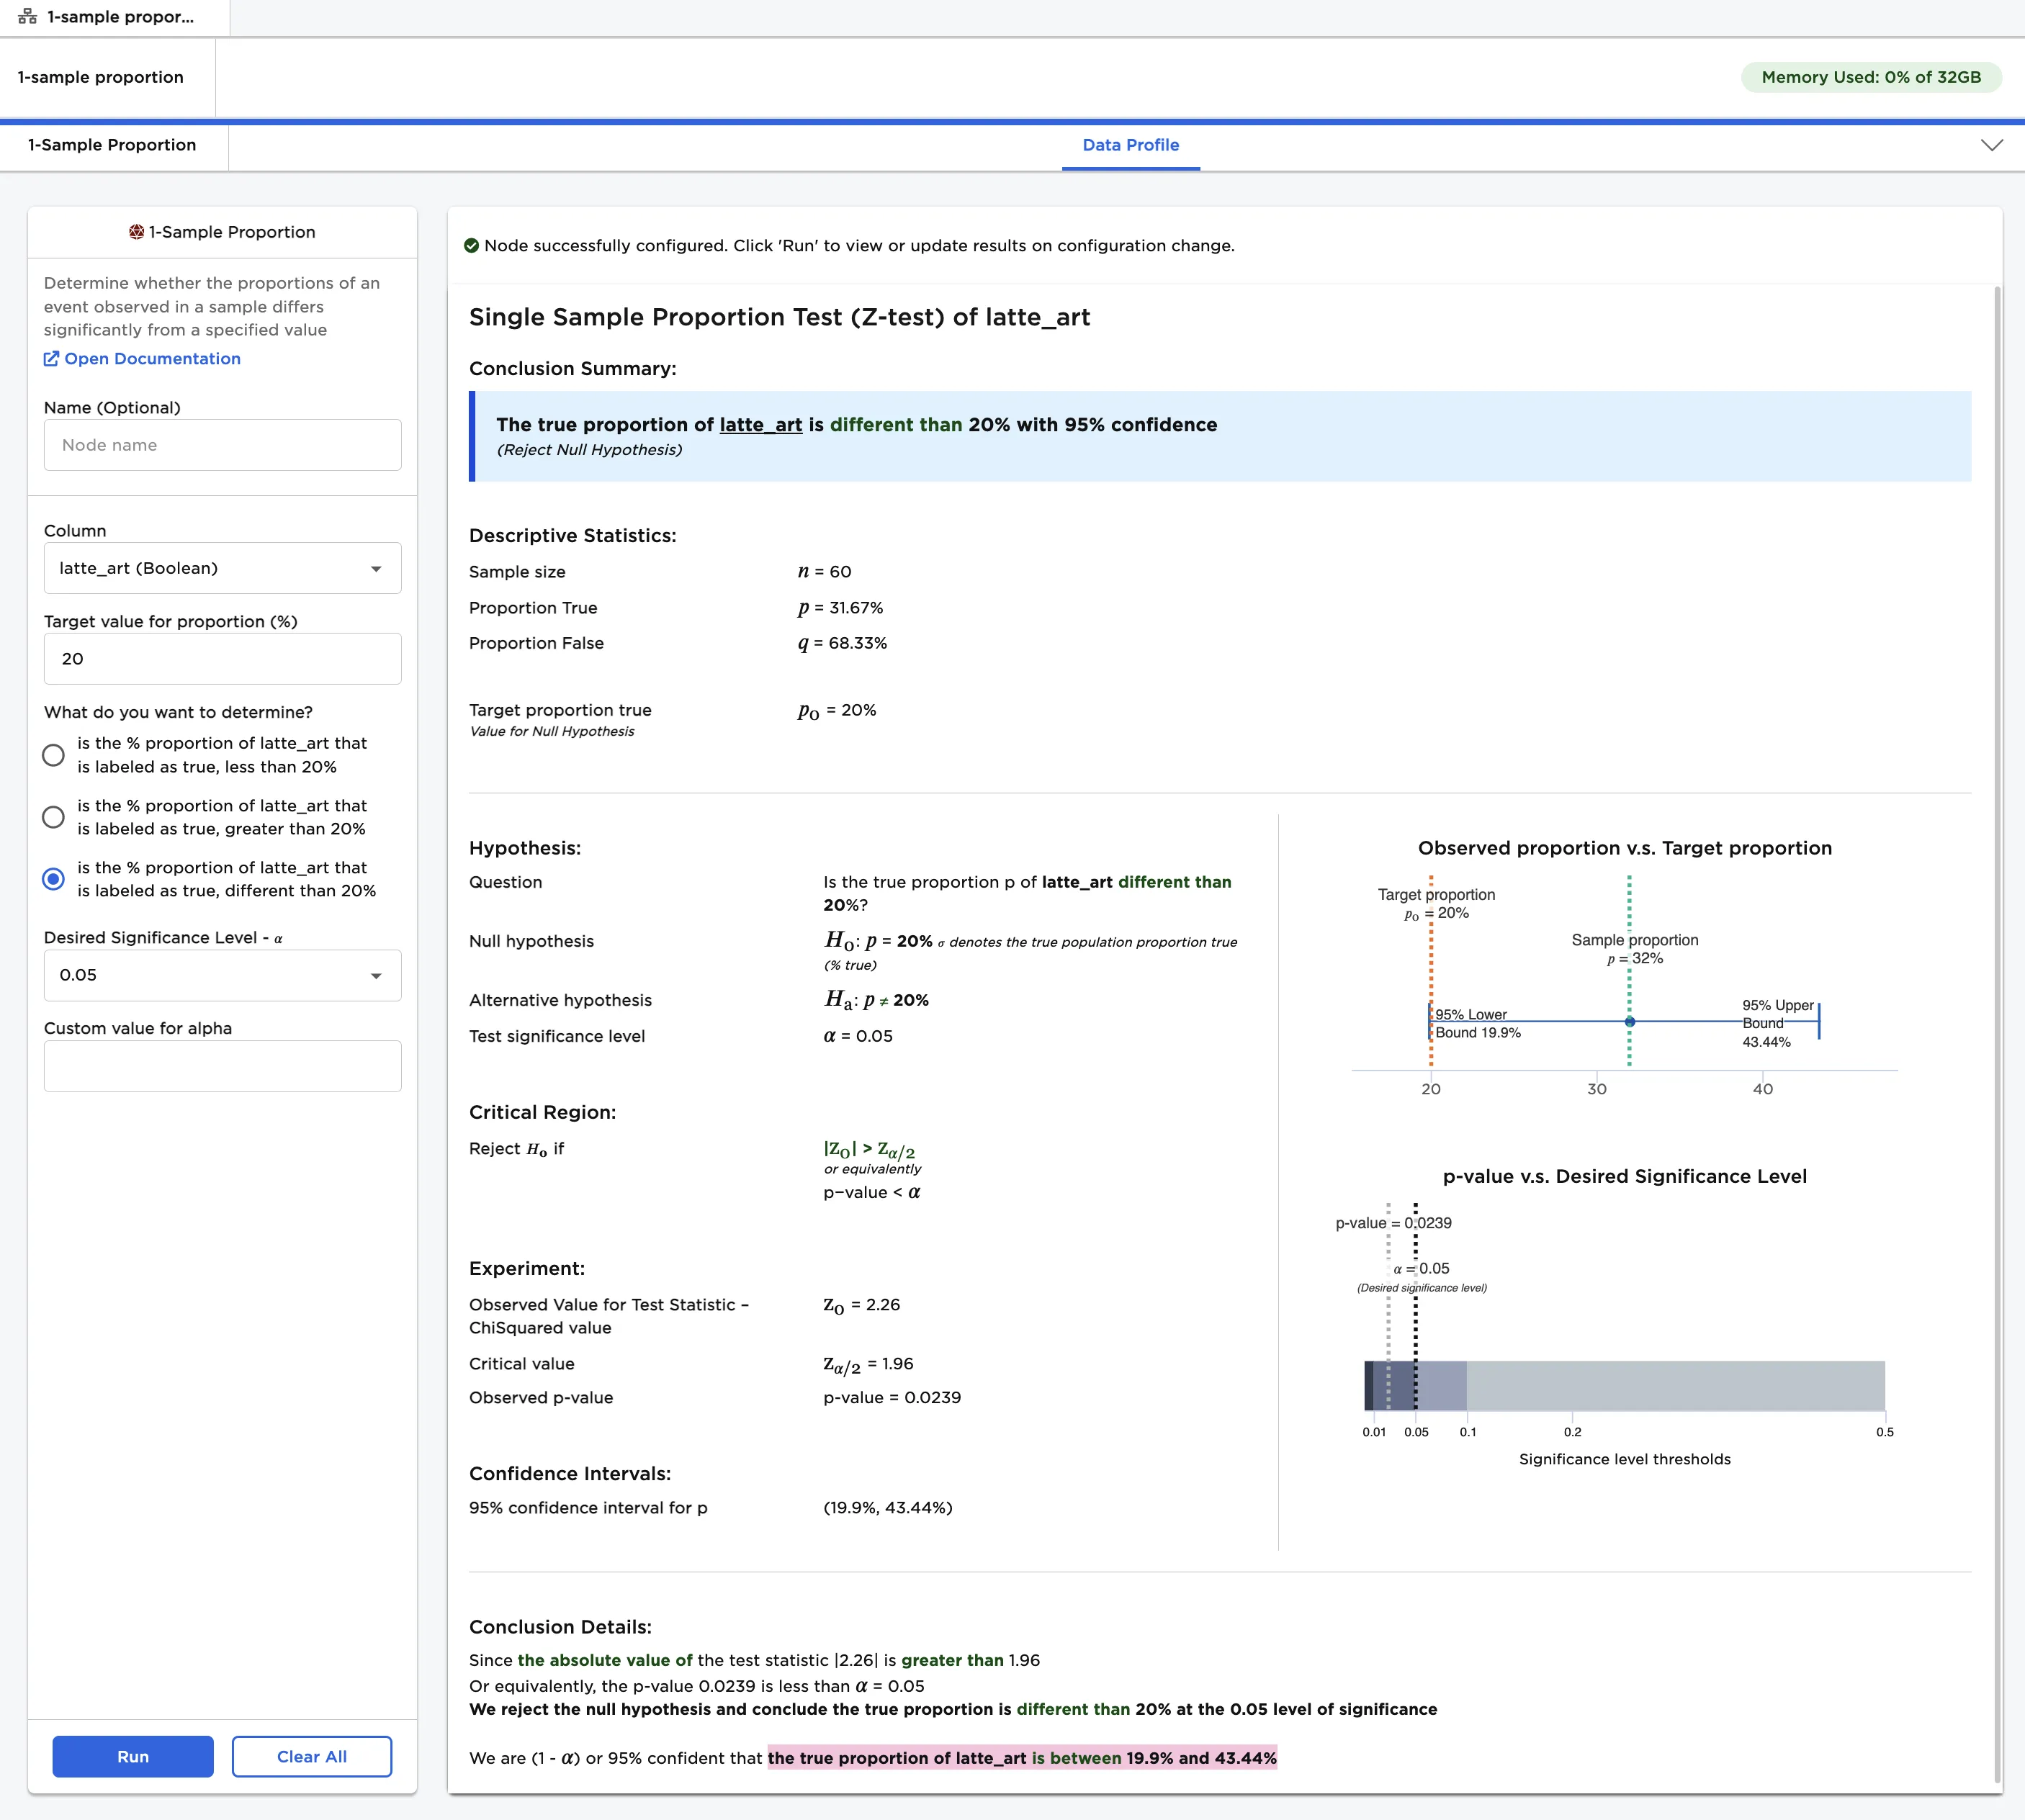
Figure 5: 2-tailed 1-sample proportion test