2-Sample Mean
The 2-Sample Mean node in Visual Notebooks determines whether the mean of two datasets differs significantly from a specified value. This node requires two datasets to be connected.
The two-sample test is used to determine if two population means are equal or unequal. A common application is to test if a new process or treatment is superior to a current process or treatment.
Configuration
| Field | Description |
|---|---|
| Name default=none | Field to name the node |
| An optional user-specified node name displayed in the workspace, both on the node and in the dataframe as a tab. | |
| Select Sample 1 Column Required | Column to use in the calculation |
| Select the column from the First Dataset that contains the data you want to use in the calculation. | |
| Select Sample 2 Column Required | Column to use in the calculation |
| Select the column from the Second Dataset that contains the data you want to use in the calculation. | |
| Target difference of Means (default 0) 𝛿₀ = 𝜇₁ −𝜇₂ Required | The mean difference between two datasets |
| Enter a decimal or integer. | |
What do you want to determine? default=is the mean of sample column 1 greater than the mean of sample column 2 (𝜇₁ > 𝜇₂) | The relationship between the target mean and the sample mean |
| Select less than, greater than, or different than. Selecting different than runs a 2-tailed test while selecting greater than or less than runs a 1-tailed test. | |
Desired Significance Level - 𝛼 default=0.05 | The probability of an error |
| Select 0.01, 0.05, 0.1, 0.2, or Custom. | |
| Custom value for alpha default=none | Custom probability of an error |
| If Custom is selected in the field above, enter a number between 0 and 1. |
Node Inputs/Outputs
| Input | A dataframe in Visual Notebooks |
|---|---|
| Output | Results of the 2-sample mean test |
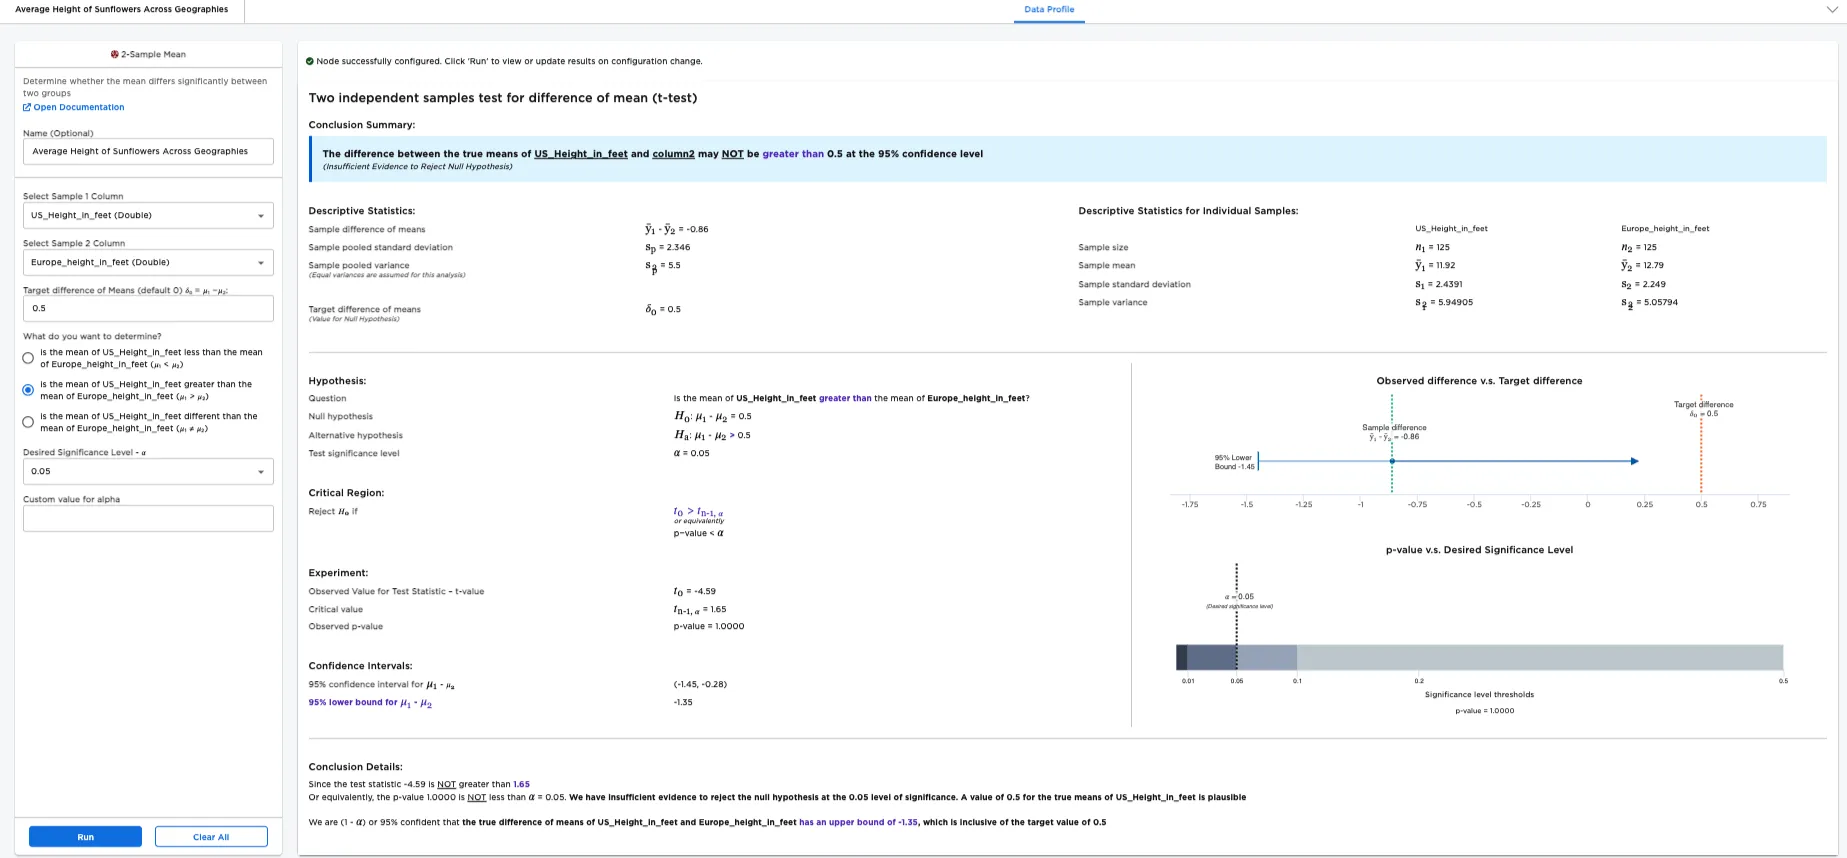
Figure 1: Example output
Examples
There is a unique need for sustainable as well as aesthetic landscaping. Sunflowers are a bright addition to mild climate landscapes that are not destructive to the environment. Planning a landscape requires some understanding of the height of these sunny flowers. The below examples use the 2-Sample Mean node to find the difference in mean between two different datasets for sunflowers - one dataset contains sunflower height information from Atlanta, Georgia and Santa Barbara, California in the United States; the other contains sunflower height information from Florence, Tuscany, Italy and Saint-Remy-de-Provence, Provence, France.
Note: The examples use European measurements converted to US measurements. If European measurements are preferred, the data can be updated using different Visual Notebooks nodes to change the column labels (Columns - Rename) and calculate to European measurements (Arithmetic).
The data we are using is a sample of sunflowers in these locations, but this node gives us information about the population of sunflowers in those locations. For example, since we can't measure every sunflower in Italy and France, we measure a small sample of sunflowers and try to learn about the entire Italian and French sunflower population from that sample. The more height information that is available, the more differences in species of sunflowers, growing climates, and other factors can be mitigated.
Given this use case, the following terminology is used in the rest of this example:
- "Population 1" is the immeasurable group of sunflowers in two US cities.
- "Population 2" is the immeasurable group of sunflowers in Italy and France.
- "Sample 1" is the small, hand-measured group of sunflowers from the Atlanta and Santa Barbara used for testing.
- "Sample 2" is the small, hand-measured group of sunflowers from Italy and France used for testing.
- The "null hypothesis" is the information you are disputing: the mean height of sunflowers in the US is 0.5 ft taller than the mean height of sunflowers in Italy and France.
- The "alternative hypothesis" is the information you are disputing: the mean height of sunflowers in the US is over 0.5 ft taller than the mean height of sunflowers in Italy and France.
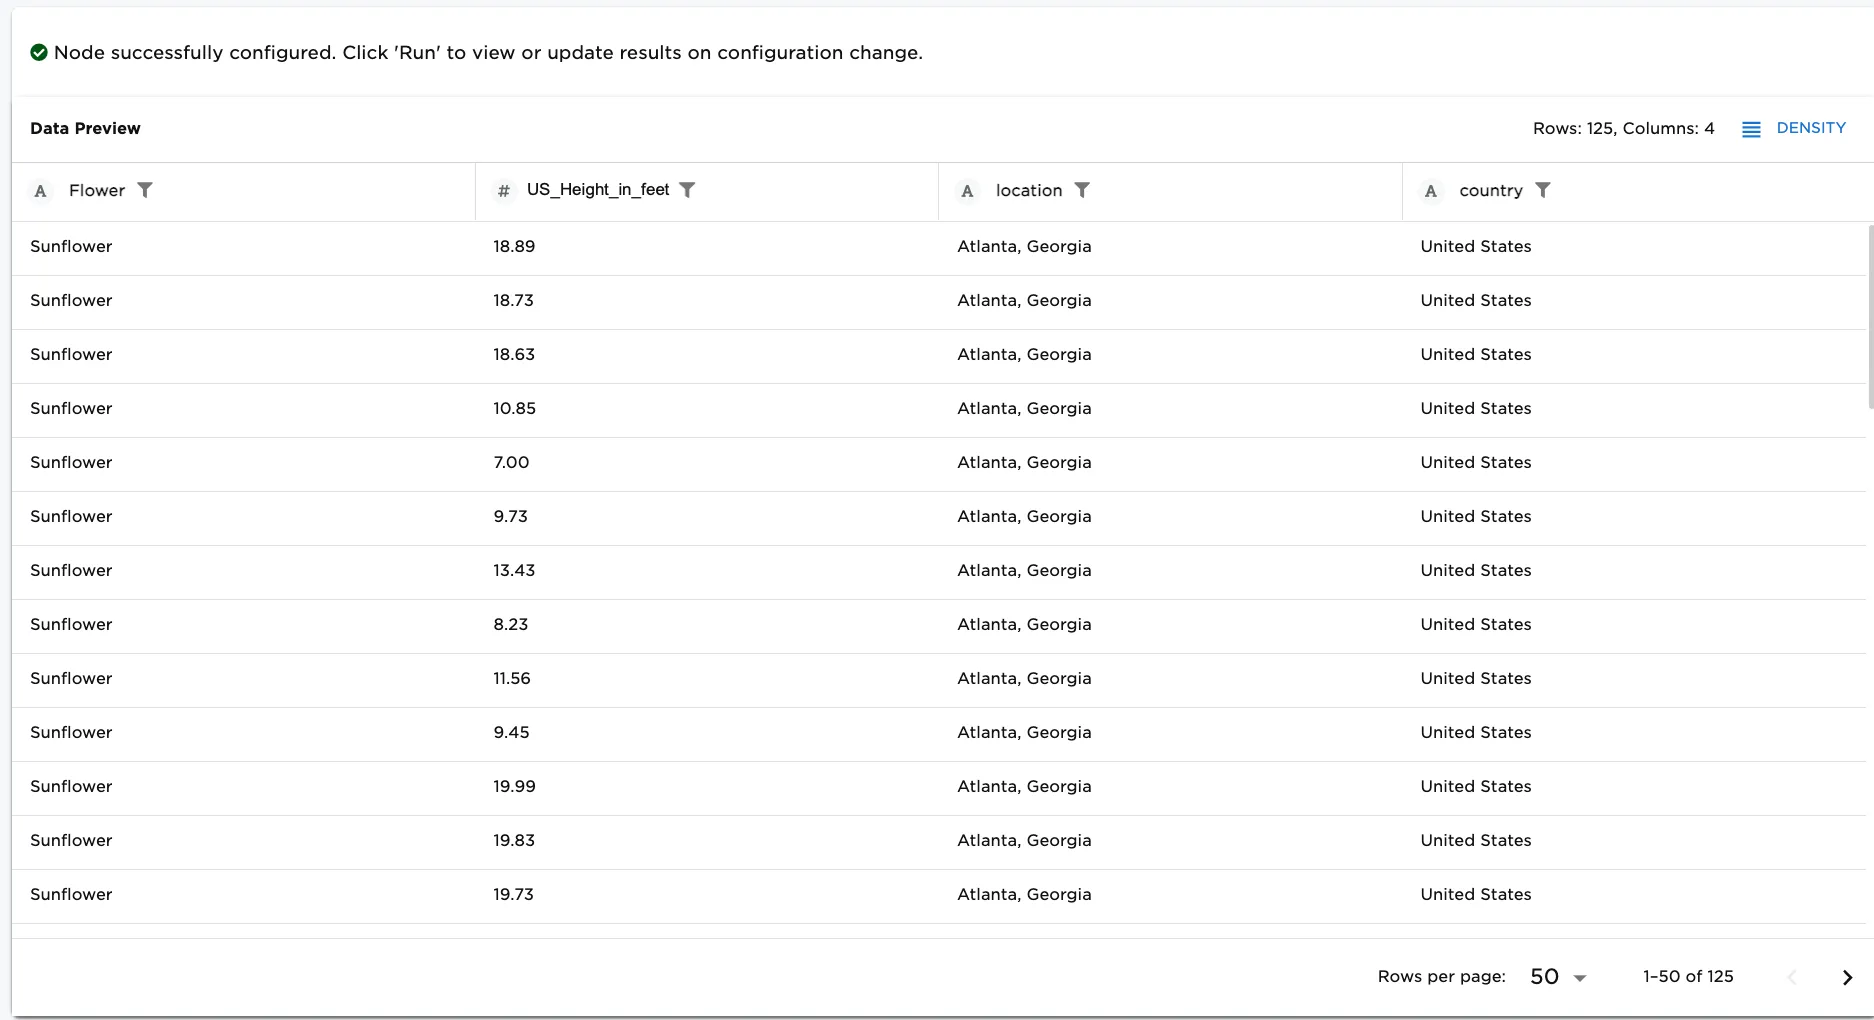
Figure 2a. Example input First Dataset-sunflowers in the US
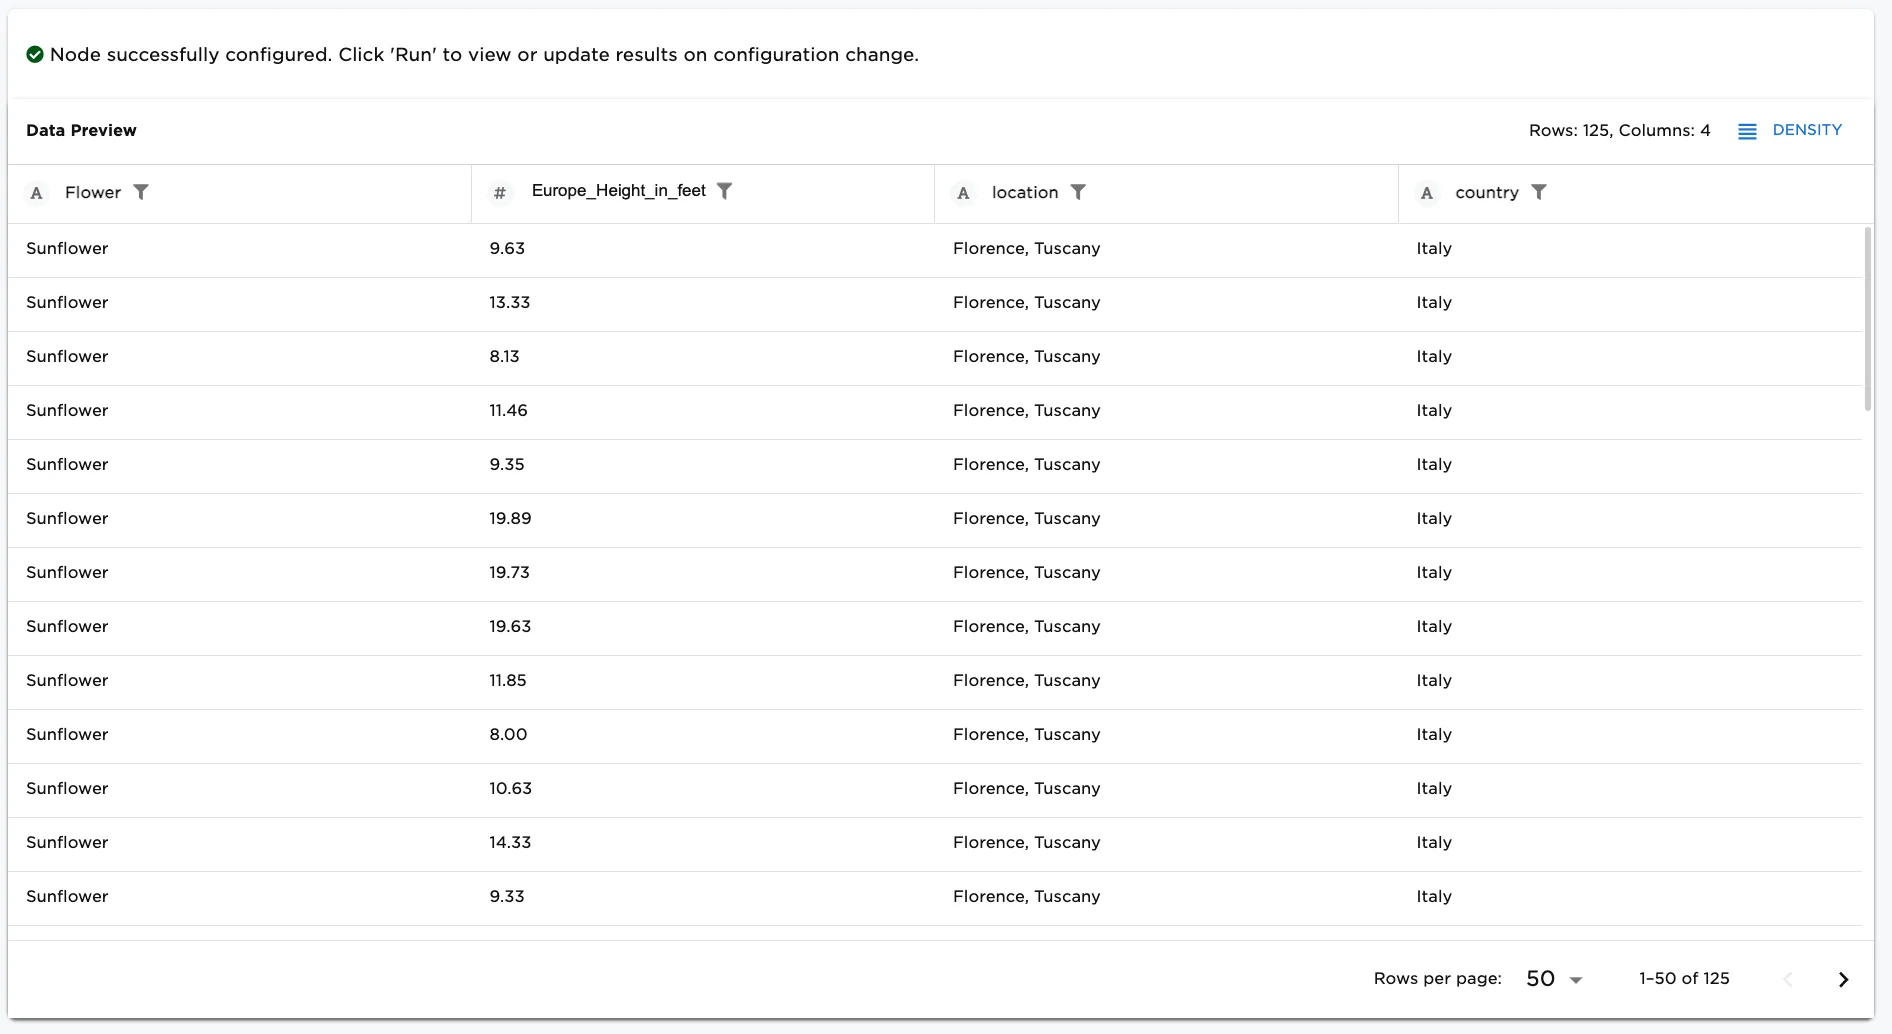
Figure 2b. Example input Second Dataset-sunflowers in Italy and France
Note: Changing any field changes the hypothesis you are testing. For example, changing the Target difference of Means from .05 changes the hypotheses:
- The new null hypothesis would be: the mean height of sunflowers in the US is x ft taller than the mean height of sunflowers in Italy and France.
- The new alternate hypothesis would be: the mean height of sunflowers in the US is over x ft taller than the mean height of sunflowers in Italy and France.
- Connect a 2-Sample Mean node (First Dataset and Second Dataset) to existing nodes. In this case, a sunflowers in the US are used as the first dataset and sunflowers in Europe are used as the second dataset.
- Select "height" for the Column field.
- Enter "0.5" as the Target difference of Means (default 0) 𝛿₀ = 𝜇₁ −𝜇₂.
- Select what you'd like to determine about the mean of the two populations. Is the mean of population 1: less than the mean of population 2 (𝜇₁ < 𝜇₂)? Is it greater than the mean of population 2 (𝜇₁ > 𝜇₂)? Or is it different from the mean of population 2 (𝜇₁ ≠ 𝜇₂)? In this case, is the mean of US_Height_in_feet greater than the mean of Europe_Height_in_feet (𝜇₁ > 𝜇₂) is selected.
- Enter the Desired Significance Level - 𝛼. In this case, .05 has been entered.
- Select Run to perform a 2-sample mean test with these settings.
Notice that Visual Notebooks presents a page of results. At the top of the page is a single-sentence summary. In this case, the test determined that the Difference between the true means of Height_in_feet and column2 may NOT be greater than 0.5 at the 95% confidence level. (Insufficient Evidence to Reject Null Hypothesis). Therefore, we cannot determine with a 95% confidence level that the greater population of sunflowers in the US is taller than the population of sunflowers in Europe by 0.5 ft or more.
Figure 3: Example 2-sample mean test with default settings
The desired significance level, or alpha (𝛼), is the probability of making a false conclusion. A small alpha value allows you to make strong, well-tested claims. A large alpha value allows you to make more general, speculative conclusions. Alpha is used to calculate the confidence that the result of the test is accurate.
Notice that alpha is related to the p-value. In this example, the p-value is the likelihood that the difference in population mean is .05 even though the sample mean difference is greater than .05. The p-value is extremely low, so you can confidently assume that the difference in population mean is indeed greater than .05. If the p-value is less than the specified alpha value, the test is considered to reveal significant findings.
So far, we have focused on determining whether the difference in mean is greater than (option: is the mean of US_Height_in_feet greater than the mean of Europe_Height_in_feet (𝜇₁ > 𝜇₂)) our selected number. To view the results for lesser than or different than, follow these steps.
Note: If greater than or lesser than is selected, Visual Notebooks performs a 1-tailed test. A 1-tailed test determines whether the proportion differs in one direction. Selecting different than performs a 2-tailed test. A 2-tailed test determines whether the Height in feet is different in either direction--greater than or less than. Instead of just outputting a minimum or maximum value for the difference in population mean, a 2-tailed test outputs a range of possible values.
- Select .05 for the Target difference of Means (default 0) 𝛿₀ = 𝜇₁ −𝜇₂ selection.
- Select .05 for the alpha, Desired Significance Level - 𝛼, selection.
Figure 4 is the result for running the report for lesser than (option: is the mean of US_Height_in_feet less than the mean of Europe_Height_in_feet (𝜇₁ < 𝜇₂))
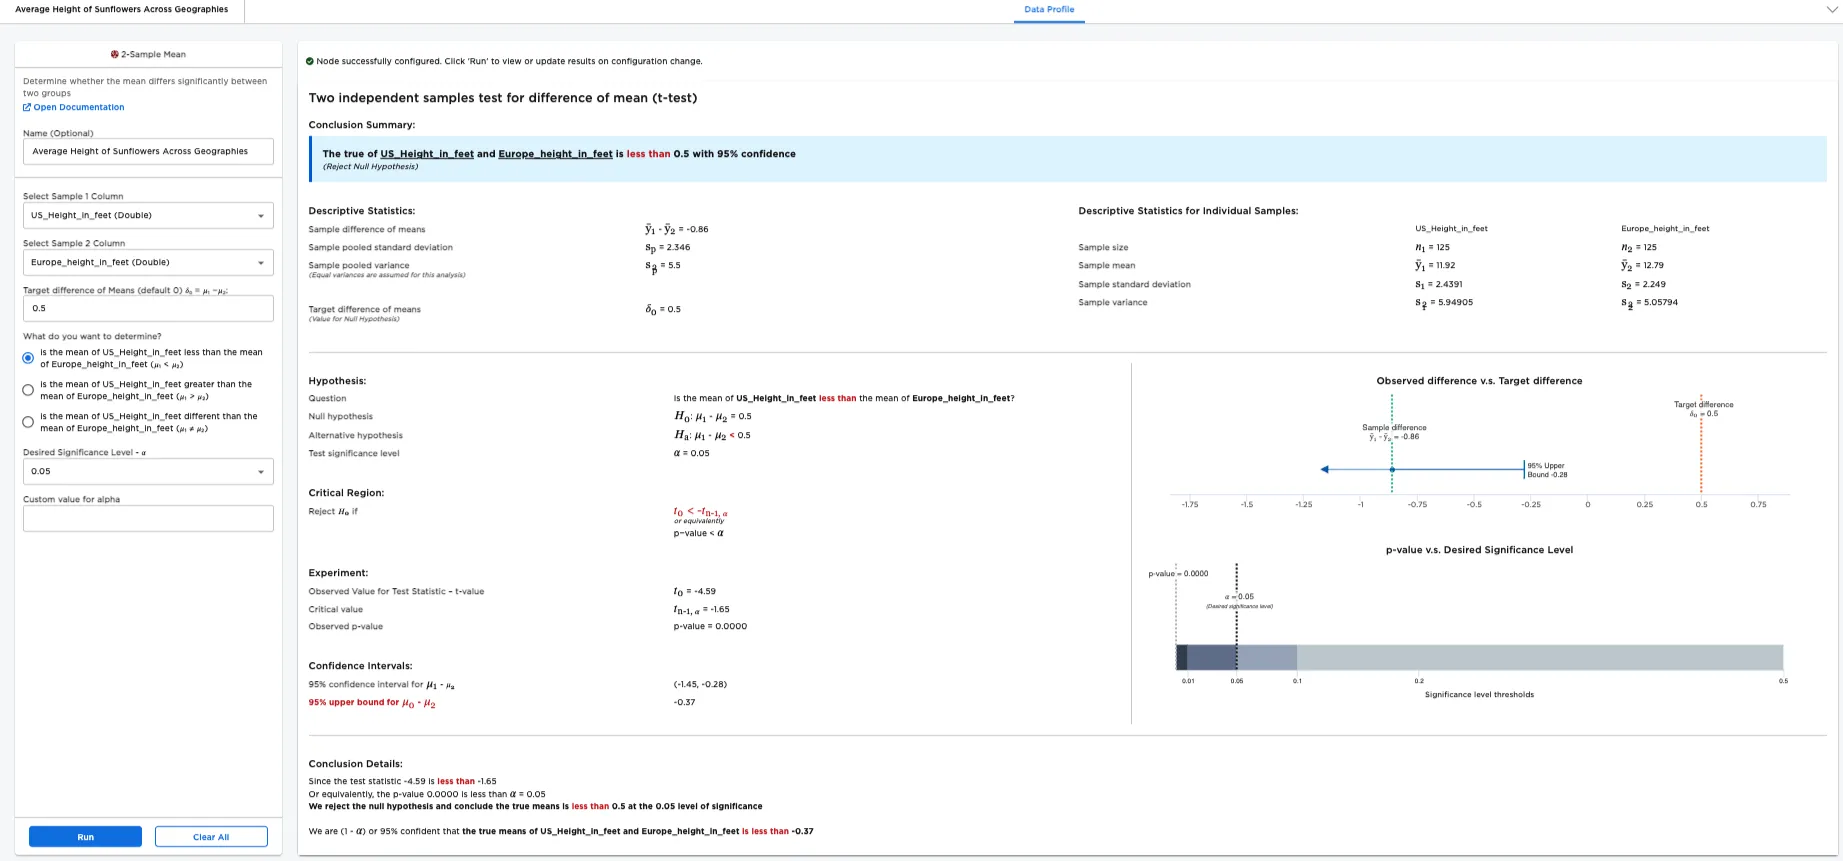
Figure 4: Example "lesser than" report
Figure 5 is the result for running the report for different than (option: is the mean of Height_in_feet different than the mean of Height_in_feet (𝜇₁ ≠ 𝜇₂))
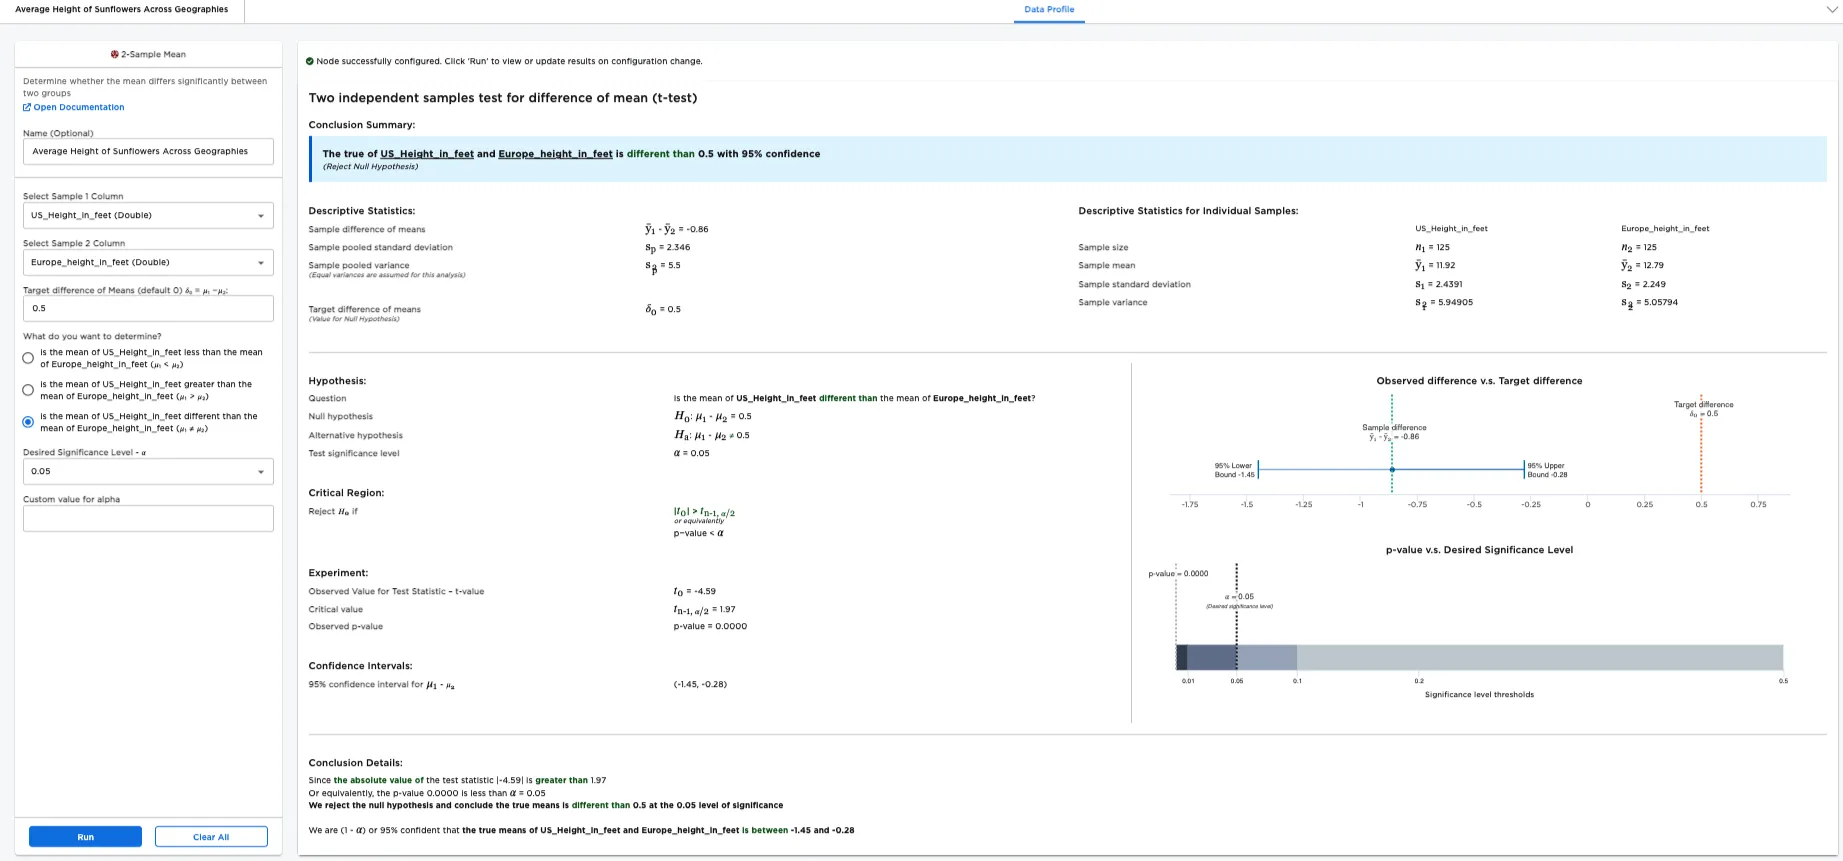
Figure 5: Example "different than" report