2-Sample Paired Mean
The 2-Sample Paired Mean node in Visual Notebooks determines whether the mean of two dependent groups differs for the same item under different conditions.
Configuration
| Field | Description |
|---|---|
| Name default=none | Field to name the node |
| An optional user-specified node name displayed in the workspace, both on the node and in the dataframe as a tab. | |
| Select Sample 1 Column Required | Column to use in the calculation |
| Select the column from the dataset that contains the first set of data you want to use in the calculation. | |
| Select Sample 2 Column Required | Column to use in the calculation |
| Select the column from the dataset that contains the second set of data you want to use in the calculation to compare against. | |
Target Paired Mean Difference between samples (default 0) default=1 | The mean difference between two datasets |
| Enter a decimal or integer. | |
What do you want to determine? default=is the paired mean difference between 2 columns less than the target difference (𝛿 < 𝛿₀) | The relationship between the target mean and the sample mean |
| Select less than, greater than, or different than. Selecting different than runs a 2-tailed test while selecting less than or greater than runs a 1-tailed test. | |
Desired Significance Level - 𝛼 default=0.05 | The probability of an error |
| Select 0.01, 0.05, 0.1, 0.2, or Custom. | |
| Custom value for alpha default=none | Custom probability of an error |
| If Custom is selected in the field above, enter a number between 0 and 0.5. |
Node Inputs/Outputs
| Input | A dataframe in Visual Notebooks |
|---|---|
| Output | Results of the 2-sample paired mean test |
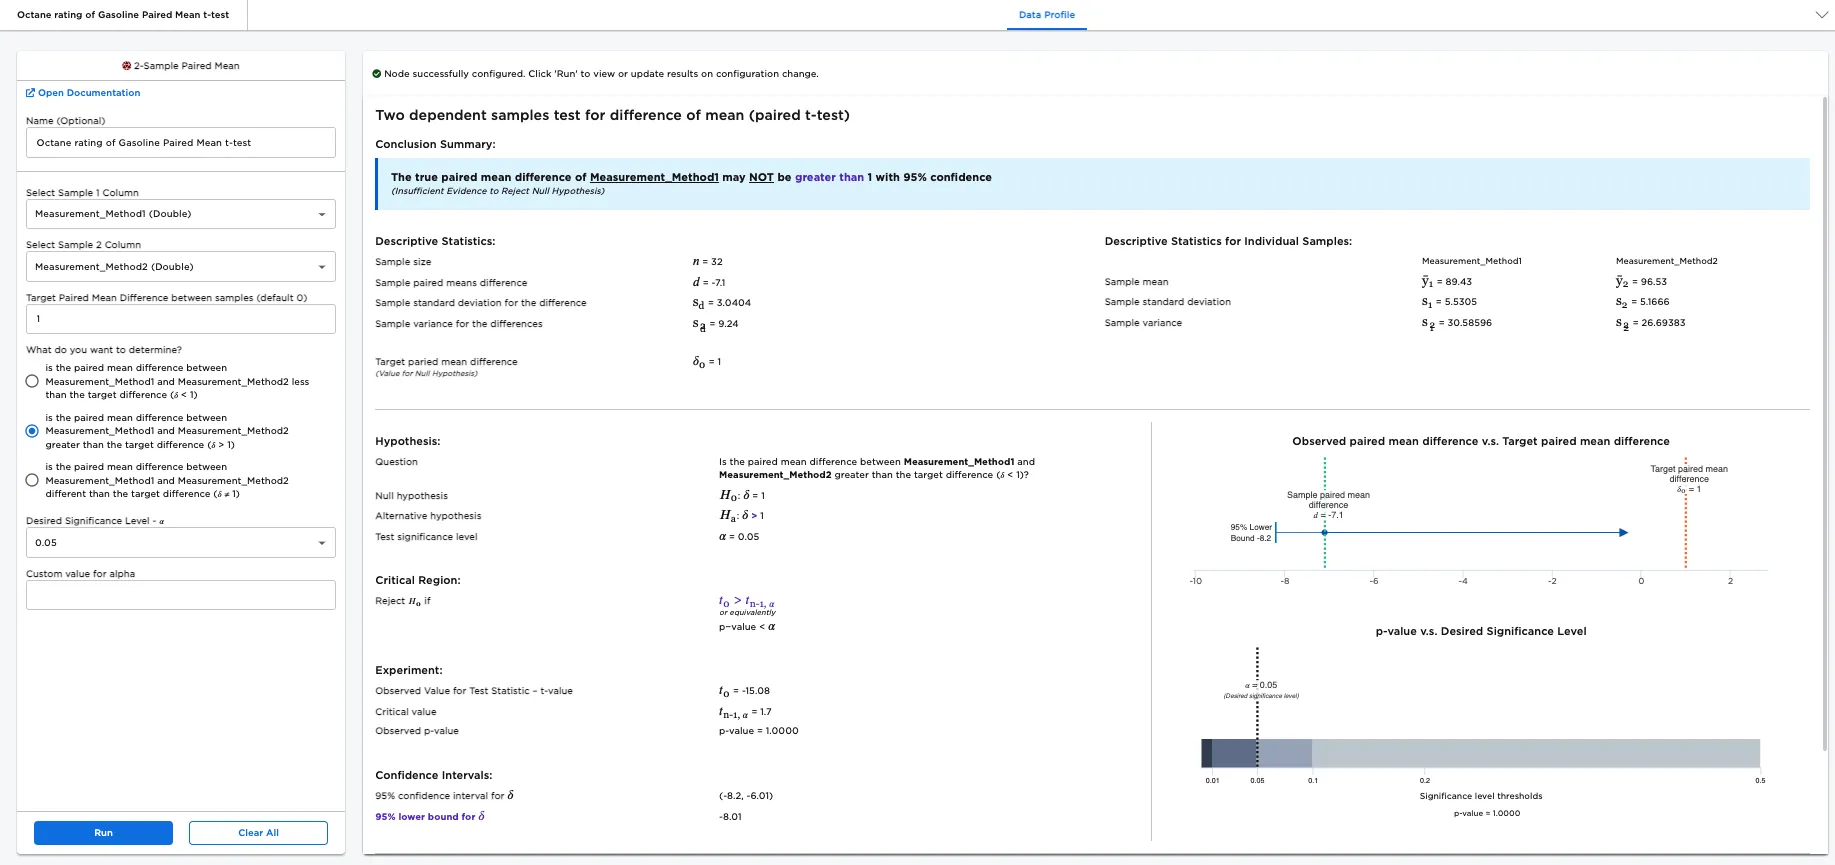
Figure 1: Example output
Examples
Octane rating is a measure of how heat resistant a fuel is in order to prevent knocking in the engine. Here, we consider two scientific methods to determine the Octane rating of a gasoline blend: Method 1 and Method 2. It is important to know the difference in the Octane rating produced by both methods. The 2-Sample Paired Mean node helps to analyze whether the methods measure Octane ratings differently. If yes, the analysis shows whether one method is consistently measuring the Octane rating greater than or lesser than the other method using a paired t-test, also called a two dependent-samples test for difference of means.
To explore this analysis of two methods to determine the Octane ratings in 32 blends of gasoline, we use a datset that contains a list of gasoline blends, and the Method 1 and Method 2 Octane ratings for each blend.
Given this use case, the following terminology is used in the rest of this example:
- "Method 1" is a way to measure the Octane rating of gasoline.
- "Method 2" is an alternate way to measure the Octane rating of gasoline.
- The "null hypothesis" is the information you are disputing: the mean Octane rating between the two methods is equal to the target.
- The "alternate hypothesis" would be: the mean Octane rating between the two methods are different, greater than, or lesser than the other.
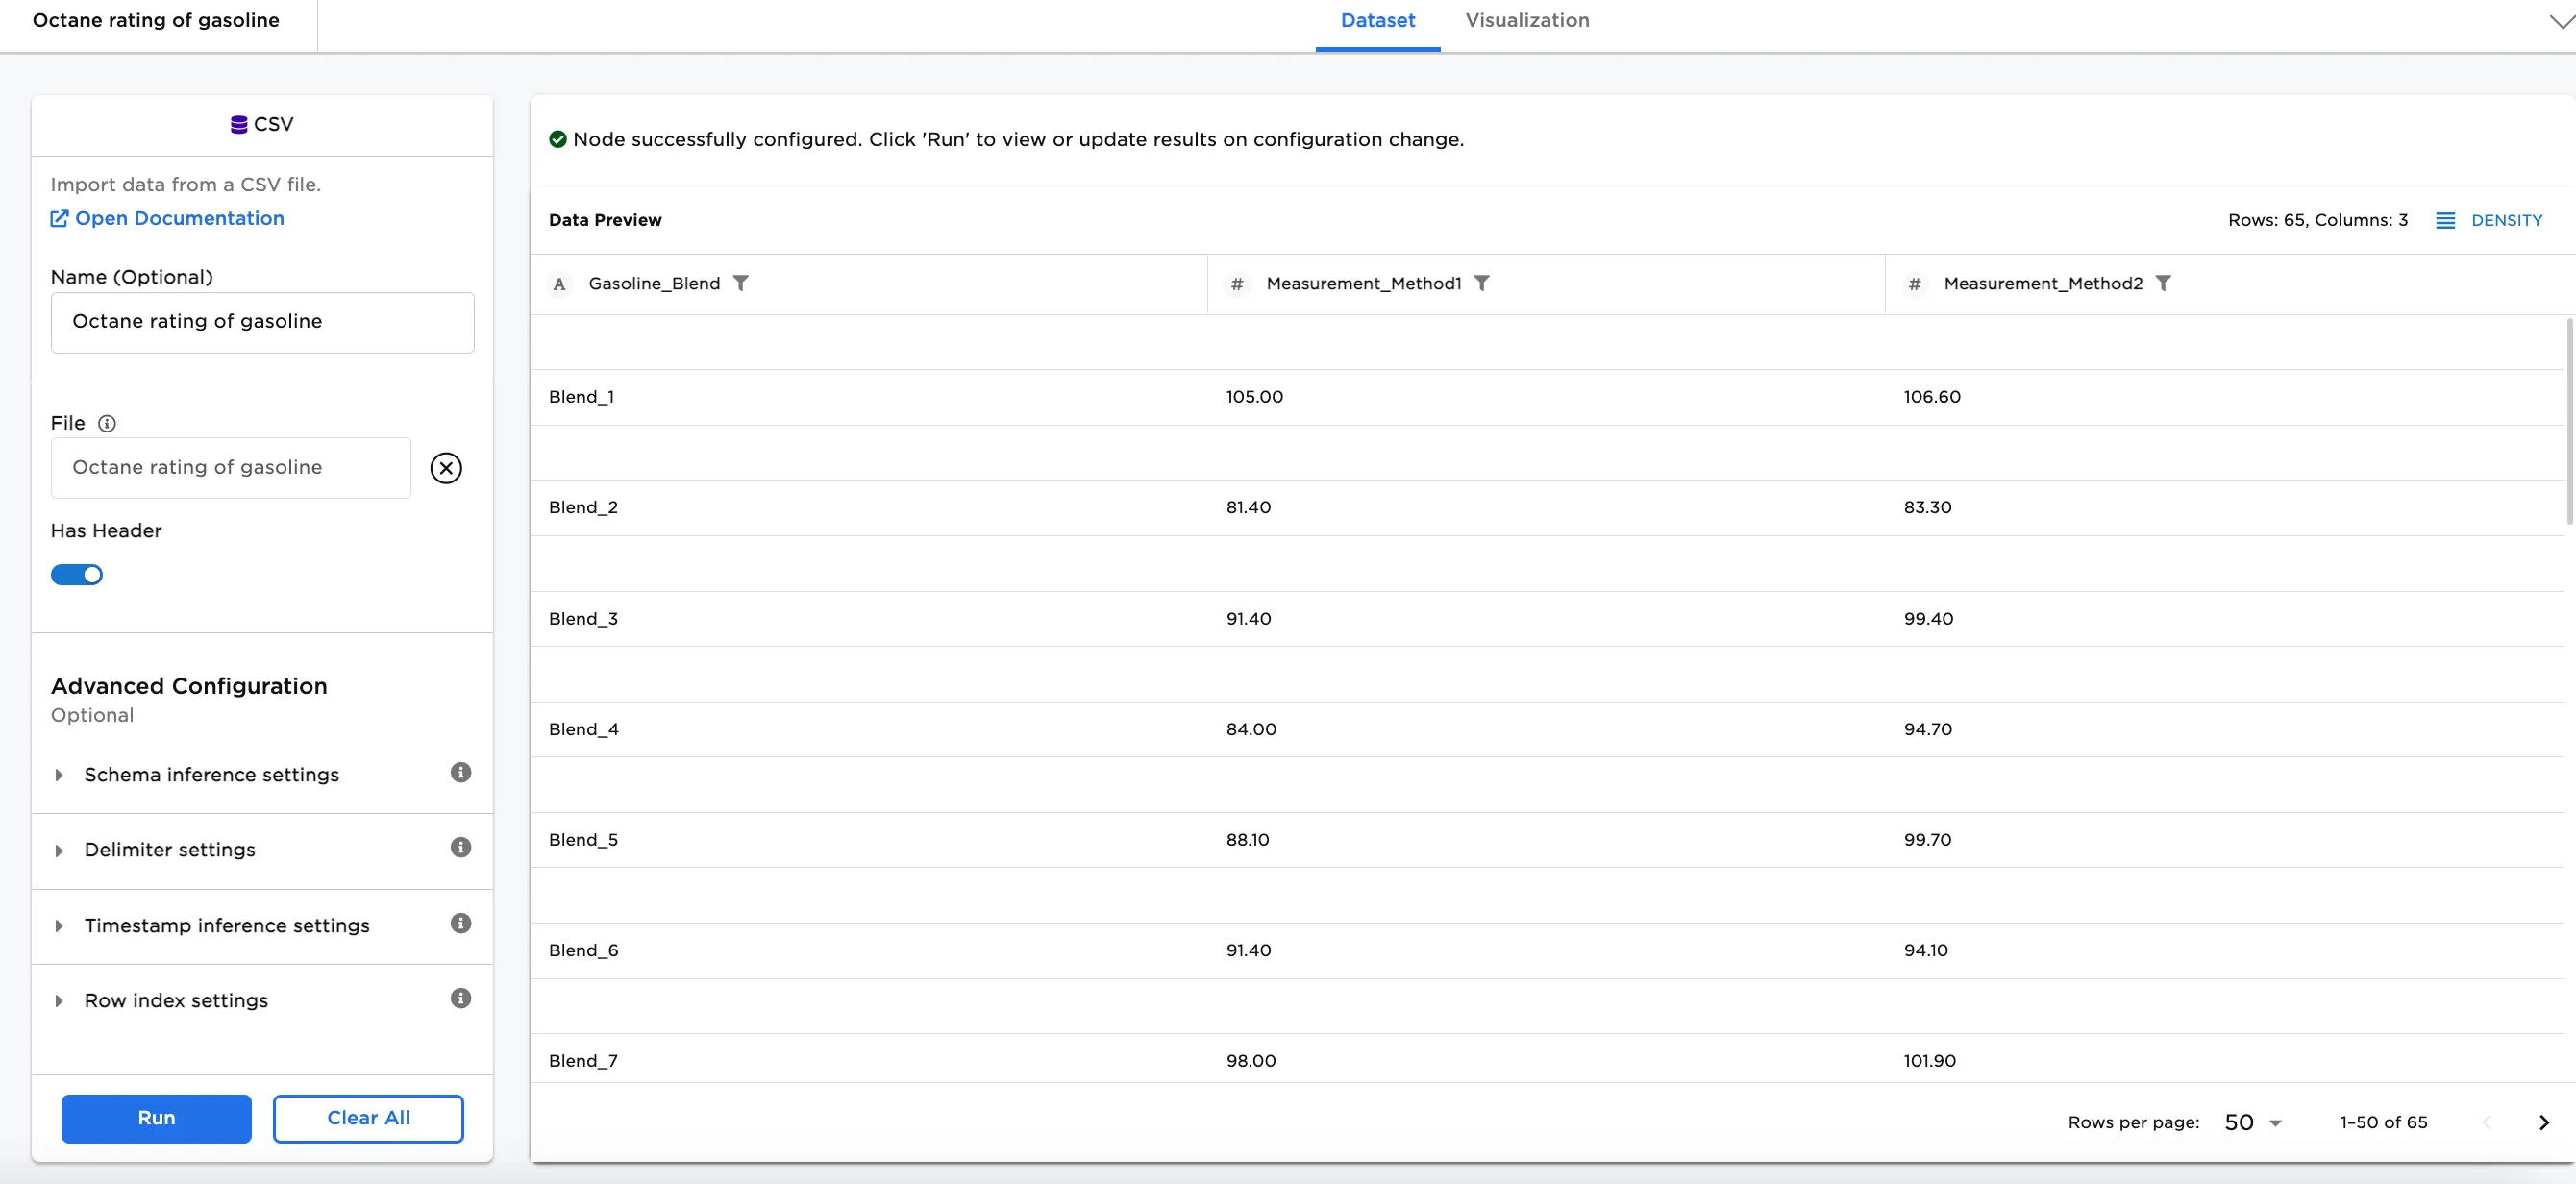
Figure 2. Example input of 32 blends of gasoline and their Octane ratings by Method 1 and Method 2
- Connect a 2-Sample Paired Mean node to an existing node. In this case, it is connected to the sample data Octane rating of Gasoline.
- Select the first sample column. In the example, in the Select Sample 1 Column dropdown menu,
Measurement_Method1 (Double)is selected. - Select the second sample column. In the example, in the Select Sample 2 Column dropdown menu,
Measurement_Method2 (Double)is selected. - Enter a decimal of an integer for the Target Paired Mean Difference between samples (default 0). In Figure 3, "1" is entered.
- Select what you'd like to determine about the mean of the two methods. Is the mean of population 1: less than the mean of population 2 (𝜇₁ < 𝜇₂)? Is the mean of Method 1 greater than the mean of Method 2 (𝜇₁ > 𝜇₂)? Or is it different from the mean of Method 2 (𝜇₁ ≠ 𝜇₂)? In this case, is the paired mean difference between Measurement_Method1 and Measurement_Method2 greater than the target difference (𝛿 > 1) is selected.
- Enter the Desired Significance Level - 𝛼. In this case, .05 has been entered.
- Select Run to perform a 2-sample paired mean test with these settings.
Notice that Visual Notebooks presents a page of results. At the top of the page is a single-sentence summary. In this case, the test determined that the The true paired mean difference of Measurement_Method1 may NOT be greater than 1 with 95% confidence (Insufficient Evidence to Reject Null Hypothesis). Therefore, we cannot determine with a 95% confidence level that the mean difference between Method 1 and Method 2 is 1 or more.
Notes
In this example:
- The null hypothesis is: the mean difference in the Octane rating between Method 1 and Method 2 is equal to 1.
- The alternate hypothesis is: the mean difference in the Octane rating measurement of Method 1 and Method 2 is greater than 1.
Changing any field changes both the null and alternate hypotheses you are testing.
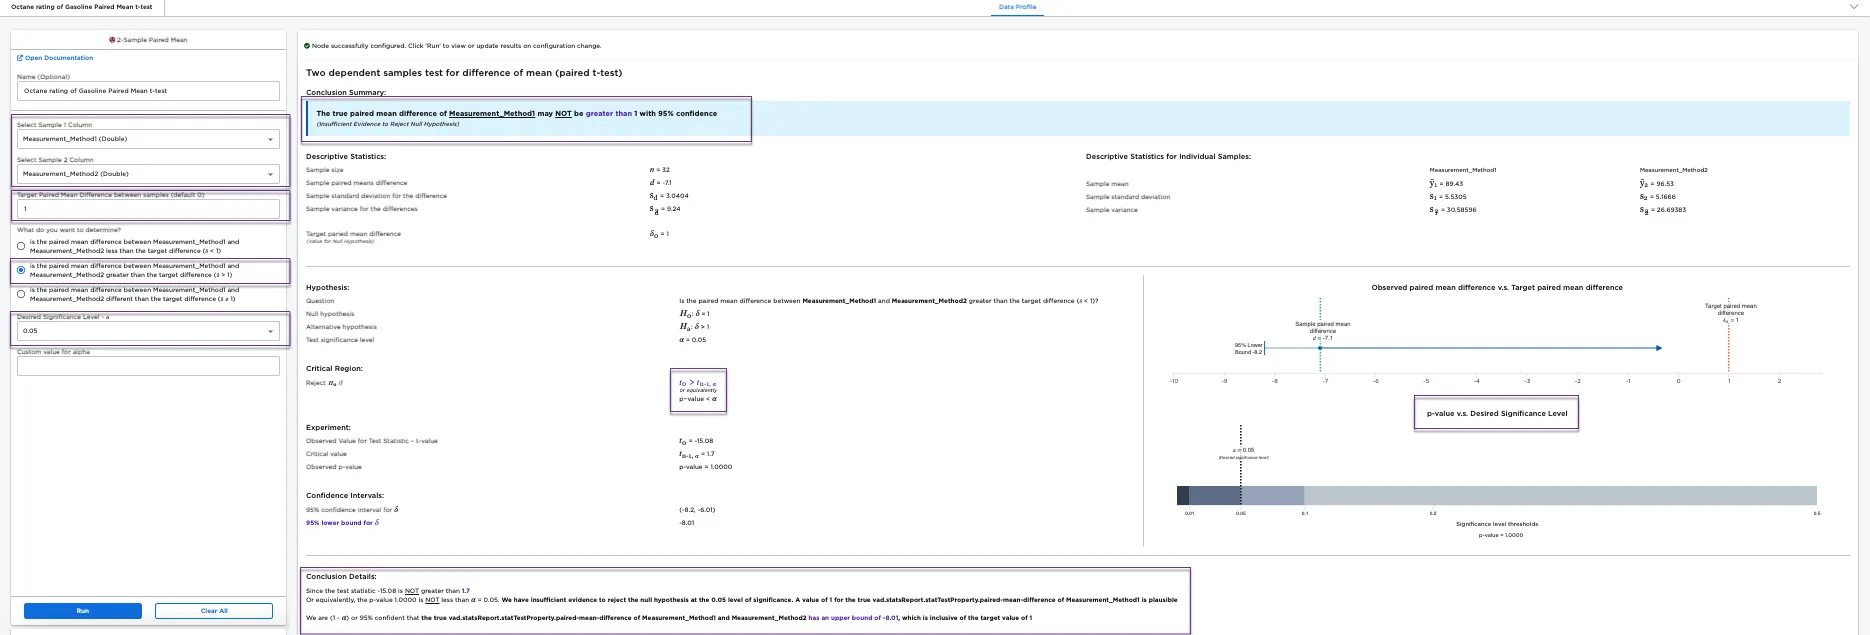
Figure 3: Example 2-sample paired mean test with default settings
The desired significance level, or alpha (𝛼), is the probability of making a false conclusion. A small alpha value allows you to make strong, well-tested claims. A large alpha value allows you to make more general, speculative conclusions. Alpha is used to calculate the confidence that the result of the test is accurate.
Notice that alpha is related to the p-value. In Figure 4, the p-value is the likelihood that the difference in mean between the two methods is .05 even though the sample mean difference is greater than .05. The p-value is extremely low, so you can confidently assume that the difference in mean is indeed greater than .05. If the p-value is less than the specified alpha value, the test is considered to reveal significant findings.
So far, we have focused on determining whether the difference in mean is greater than (option: is the paired mean difference between Measurement_Method1 and Measurement_Method2 greater than the target difference (𝛿 > 1)) our selected number. To view the results for lesser than or different than, follow these steps.
Note: If greater than or lesser than is selected, Visual Notebooks performs a 1-tailed test. A 1-tailed test determines whether the proportion differs in one direction. Selecting different than performs a 2-tailed test. A 2-tailed test determines whether there is a difference in method Octane ratings in either direction--greater than or less than. Instead of just outputting a minimum or maximum value for the difference in mean, a 2-tailed test outputs a range of possible values.
- Select .5 for the Target Paired Mean Difference between samples (default 0) selection.
- Select .05 for the alpha, Desired Significance Level - 𝛼, selection.
Figure 4 is the result for running the report for lesser than (option: is the paired mean difference between Measurement_Method1 and Measurement_Method2 less than the target difference (𝛿 < 0.5))
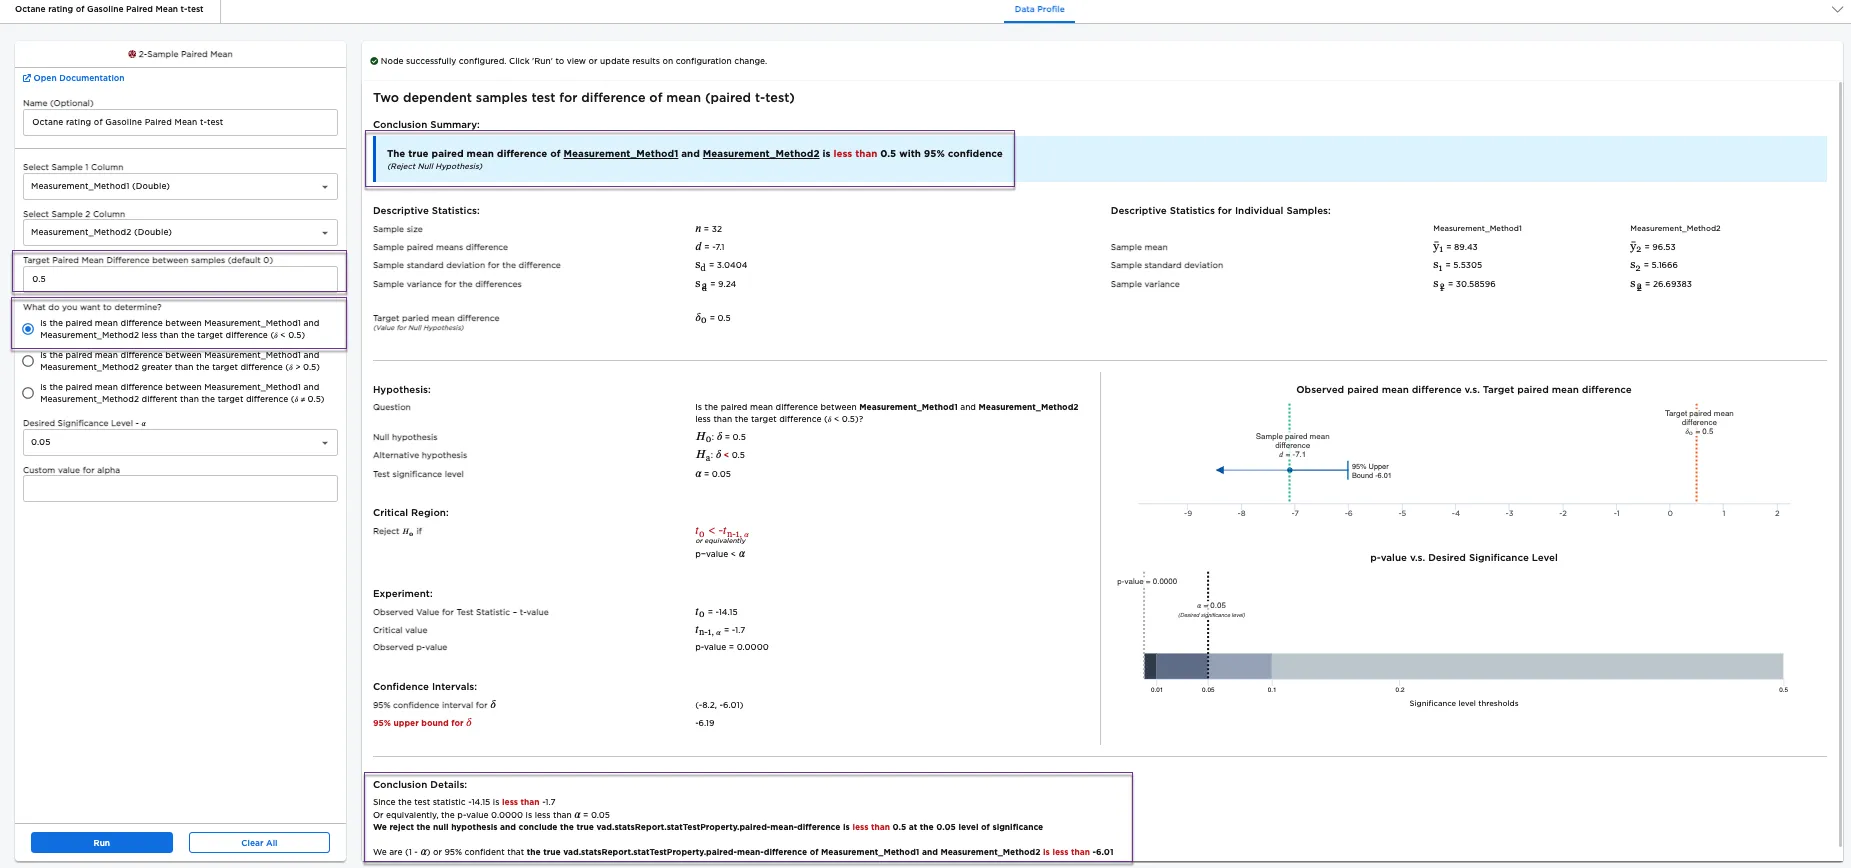
Figure 4: Example "lesser than" report
Figure 5 is the result for running the report for different than (option: is the paired mean difference between Measurement_Method1 and Measurement_Method2 different than the target difference (𝛿 ≠ 0.5))
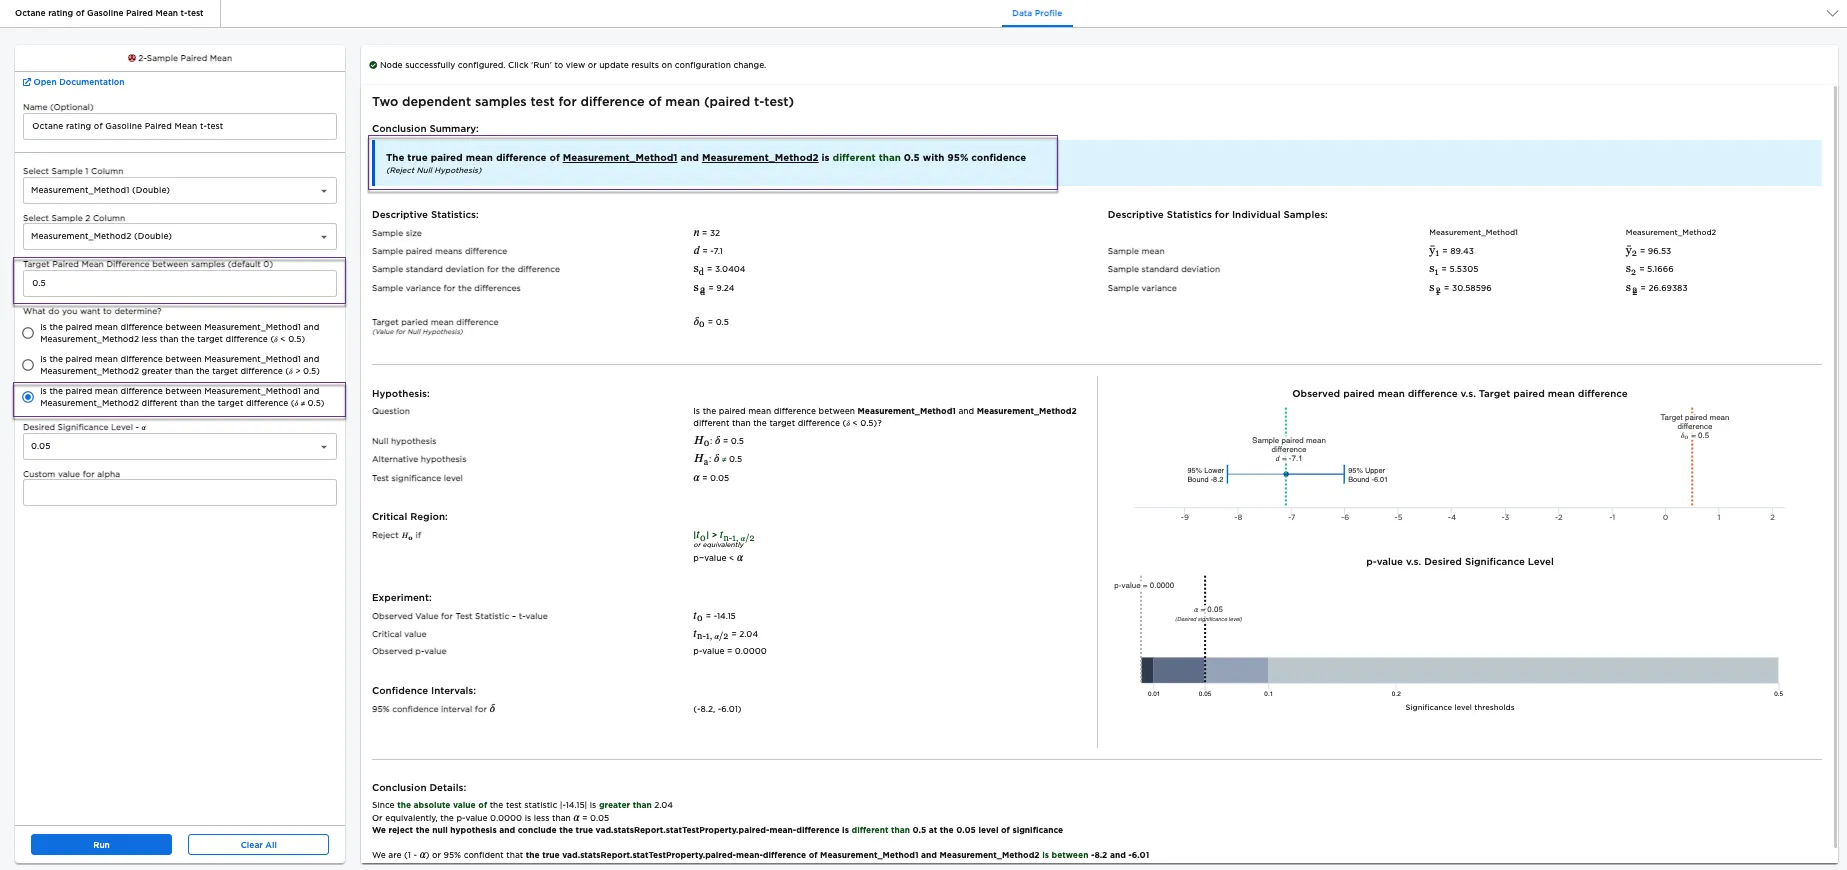
Figure 5: Example "different than" report