2-Sample Variance
Use Visual Notebooks to determine if the variances of two datasets are equal.
Configuration
| Field | Description |
|---|---|
| Name (Optional) default=none | A user-specified node name displayed in the workspace |
| Select Sample 1 Column Required | First set of data |
| Select the first set of sample data for an F test for equality of two variances. | |
| Select Sample 2 Column Required | Second set of data |
| Select the second set of sample data for an F test for equality of two variances. | |
Desired Significance Level - 𝛼 default=0.05 | Significance level of the test |
| Select a significance level for the test from the following values: .01, .05, .1, or .2. Alternatively, enter a custom value by selecting Custom. | |
Custom value for alpha default=none | Custom significance level for the test |
| Optionally, enter a custom value for the significance level of the test. | |
Test Method default=F-test method | Method to test for equality of the variances |
| Select a method to test for the equality of variances of two sets of data. Currently, the system supports the F test method. |
Node Inputs/Outputs
| Input | Two sets of data from Visual Notebooks nodes |
|---|---|
| Output | Statistical computations, graphs, and a conclusion regarding the variances of two sets of data |
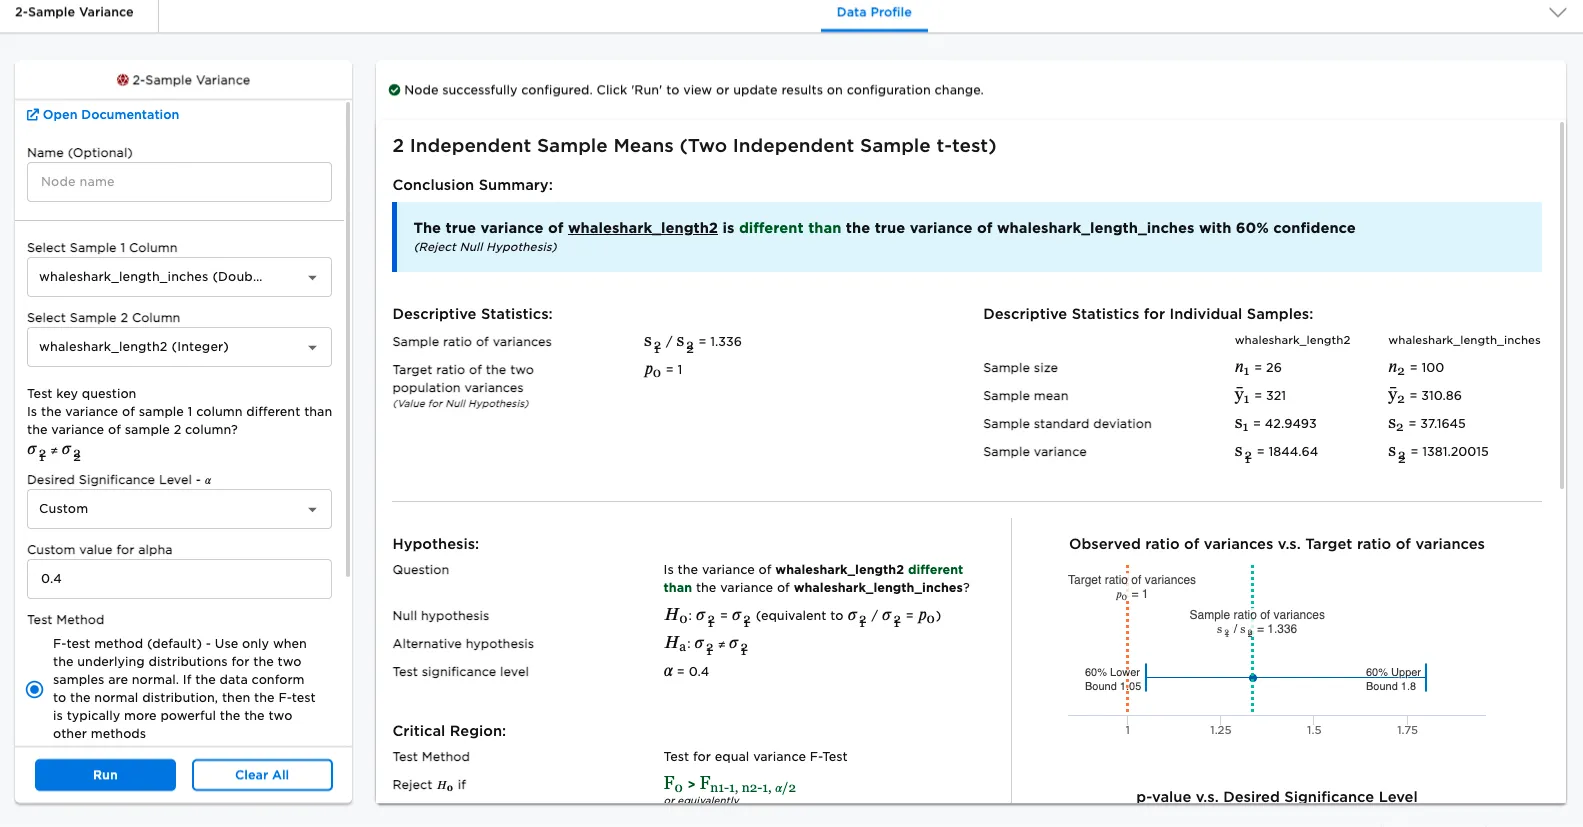
Figure 1: Example output
Examples
For some statistical analyses that compare multiple datasets, there is an assumption that the variances -- the amount of "spread" -- of the datasets are equal, so determining whether the variances of multiple datasets are equal is an important first step. Researchers may be interested in determining whether two datasets have equal variances for various reasons, including:
- Determining if two different parts that are mass produced (and therefore have variances in size) can be expected to fit together.
- Comparing the amount of variability in two different professors' grading systems.
In the following examples, we determine if the variance of two whale shark populations are equal. Since it is challenging to measure all whale sharks in a given location, researchers measure a small sample of whale sharks in each location and try to gain insights about the greater whale shark populations from the samples.
Given this use case, the following terminology is used in this example:
- Population 1 is the large, practically immeasurable group of whale sharks near Australia
- Population 2 is the large, practically immeasurable group of whale sharks near Brazil
- Sample 1 is the small, hand-measured group of whale sharks near Australia used for testing
- Sample 2 is the small, hand-measured group of whale sharks near Brazil used for testing
The dataset for sample 1, shown in Figure 2, contains the length in inches of whale sharks near Australia. The dataset for sample 2, shown in Figure 3, contains the length in inches of whale sharks near Brazil. Since the datasets were taken by two different researchers, one is in the form of decimal data, and one is in the form of integers. (You do not need to clean the data or alter it in any way to perform the analysis.)
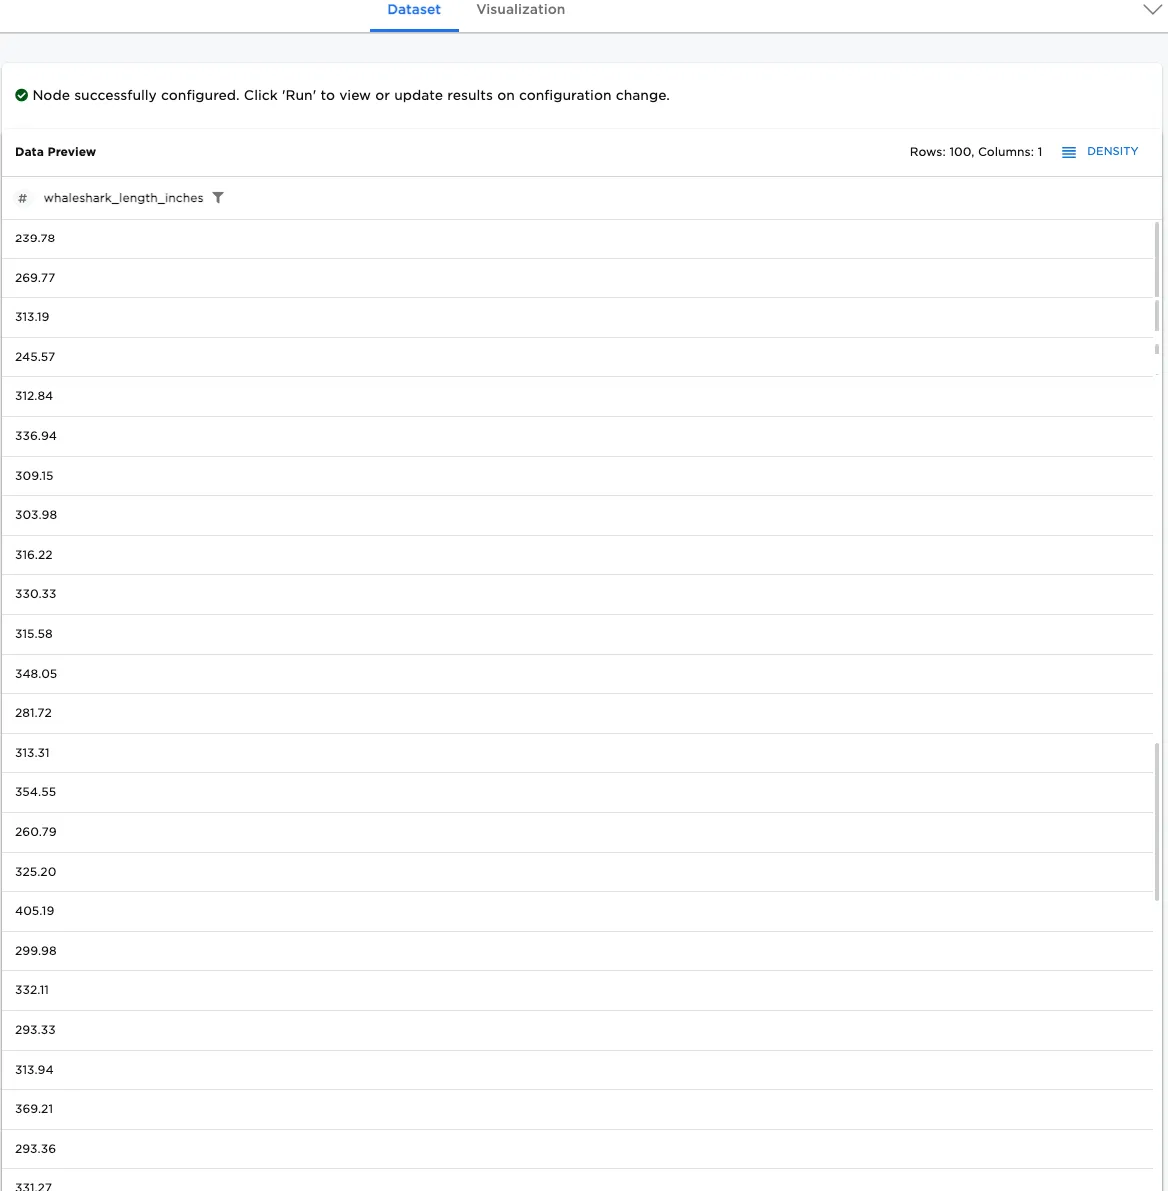
Figure 2: Length of whale sharks near Australia
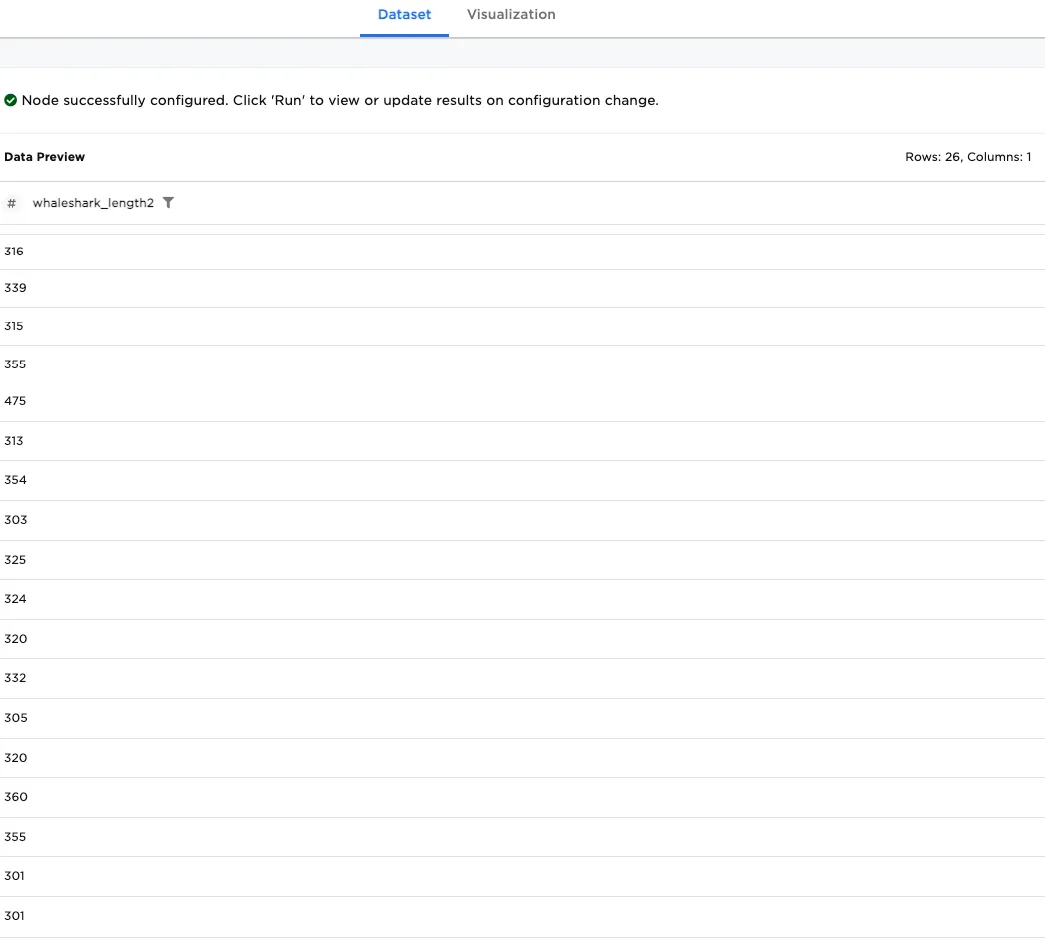
Figure 3: Length of whale sharks near Brazil
We can never determine that the populations have equal variance with absolute certainty. Instead, we decide on a significance level, 𝛼. This number represents a confidence in our findings. For instance, a significance level of .01 indicates that there is only a 1% chance that our finding is incorrect. Put another way, it indicates a 99% confidence that our finding is correct.
We wish to determine if the variances of two populations are equal, but to test this in a precise manner, standard statistical methods require that we first construct a null hypothesis and an alternate hypothesis. By convention, when determining the equality of two variances, the null hypothesis is that the two variances are equal. The alternate hypothesis is that the two variances are different. Now that we know our null hypothesis and we have chosen a value for the significance level (.01), we can use Visual Notebooks to determine if the variances of our two whale shark populations are equal, using these steps:
- Connect a 2-Sample Variance node to two existing nodes. In this example, connect the 2-Sample Variance node to a CSV node that contains Australia data and a CSV node that contains Brazil data.
- Select the 2-Sample Variance node to configure it.
- For Select Sample 1 Column, select whaleshark_length_inches.
- For Select Sample 2 Column, select whaleshark_length2.
- For Desired Significance Level - 𝛼, select 0.01.
- Select Run.
The following image shows the configuration settings and a portion of the output. The null hypothesis is that the two variances are equal. With a confidence level of 99%, the calculation has determined that it cannot dispute the null hypothesis. In other words, the whale sharks near Australia have the same variance in body length as the whale sharks near Brazil.
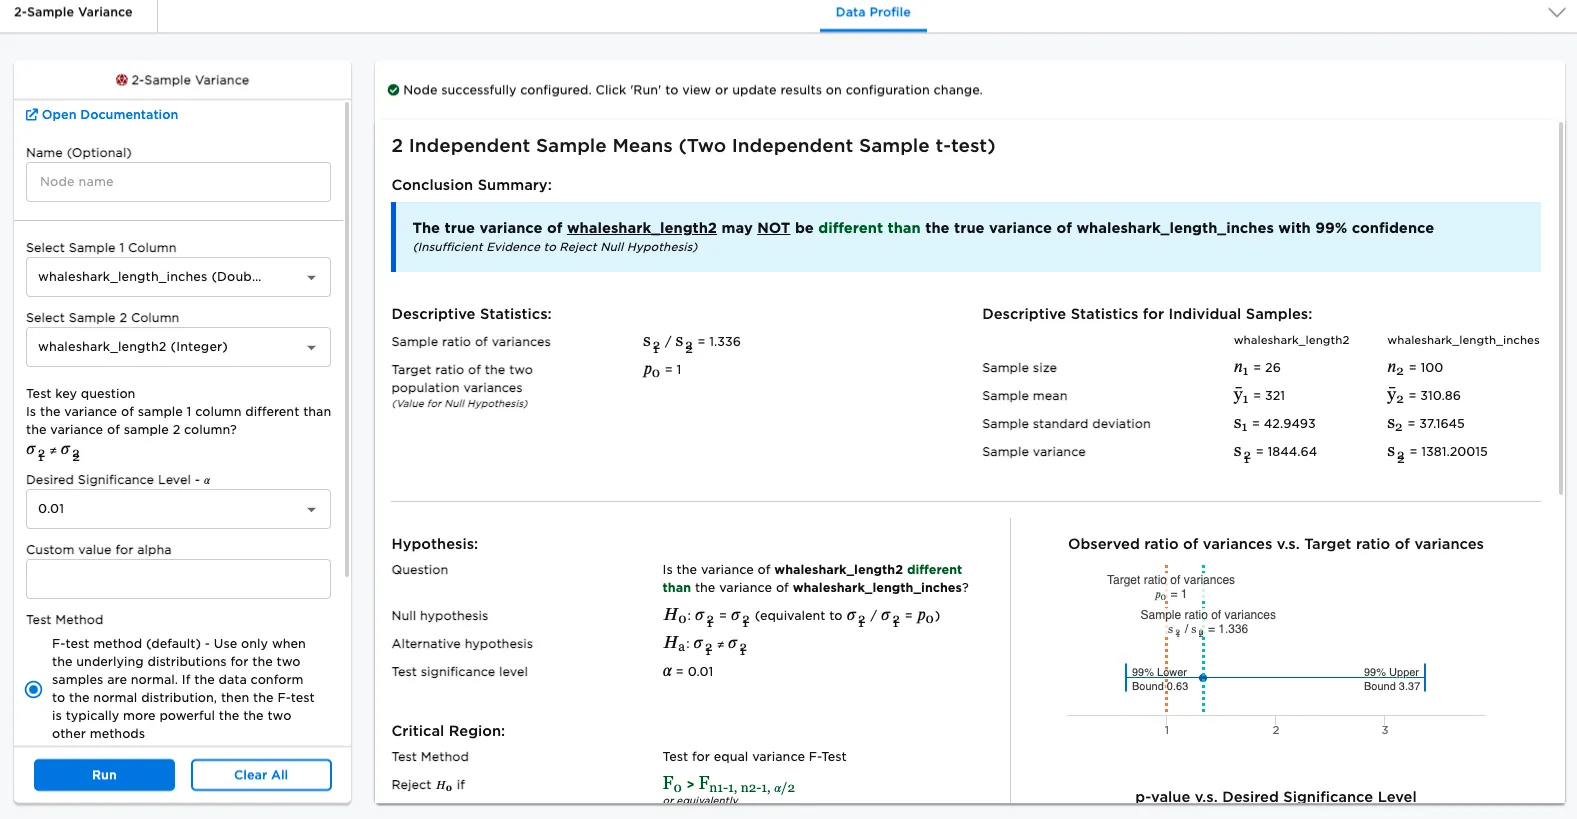
Figure 4: The variances are equal, to a significance of 0.01
The node output provides details of its statistical calculations. The null hypothesis is that the two variances are equal. Visual Notebooks constructs test criteria based on a computed p value and a user chosen significance level (𝛼), which is .01. The test criteria is used to attempt to disprove the null hypothesis.
The very bottom of the output justifies why, to a significance level of .01, we cannot dispute the null hypothesis. The p value is .1590, while 𝛼 is .01. To have reasonable certainty that we could dispute the null hypothesis, we need p < 𝛼, which is not true. Therefore, we can be 99% confident that the two variances are equal.
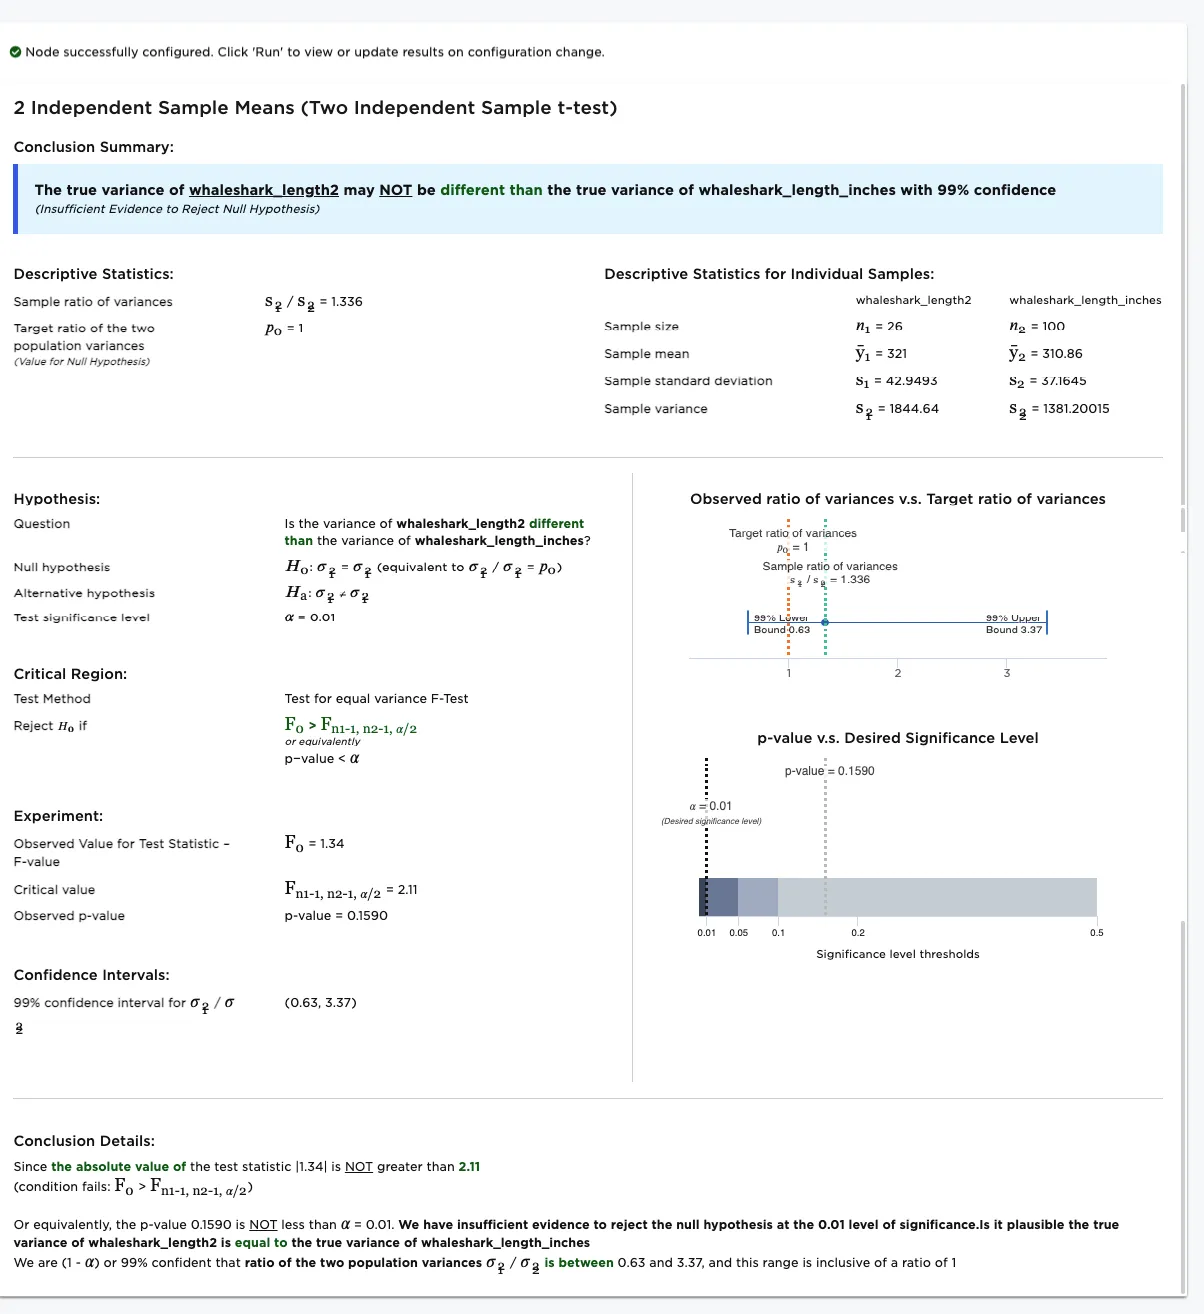
Figure 5: Full statistical output
In the following example, we specify a custom value of .4 for 𝛼, the significance level, using these steps:
- Using the output from the previous example, for **Desired Significance Level
- 𝛼**, select Custom.
- For Custom value for alpha, enter ".4".
- Select Run.
With this new significance level, Visual Notebooks concludes with 60% confidence that the two sets of data have different variances.
Figure 6: Two sample variance using a custom value of .4 for the significance level (𝛼)
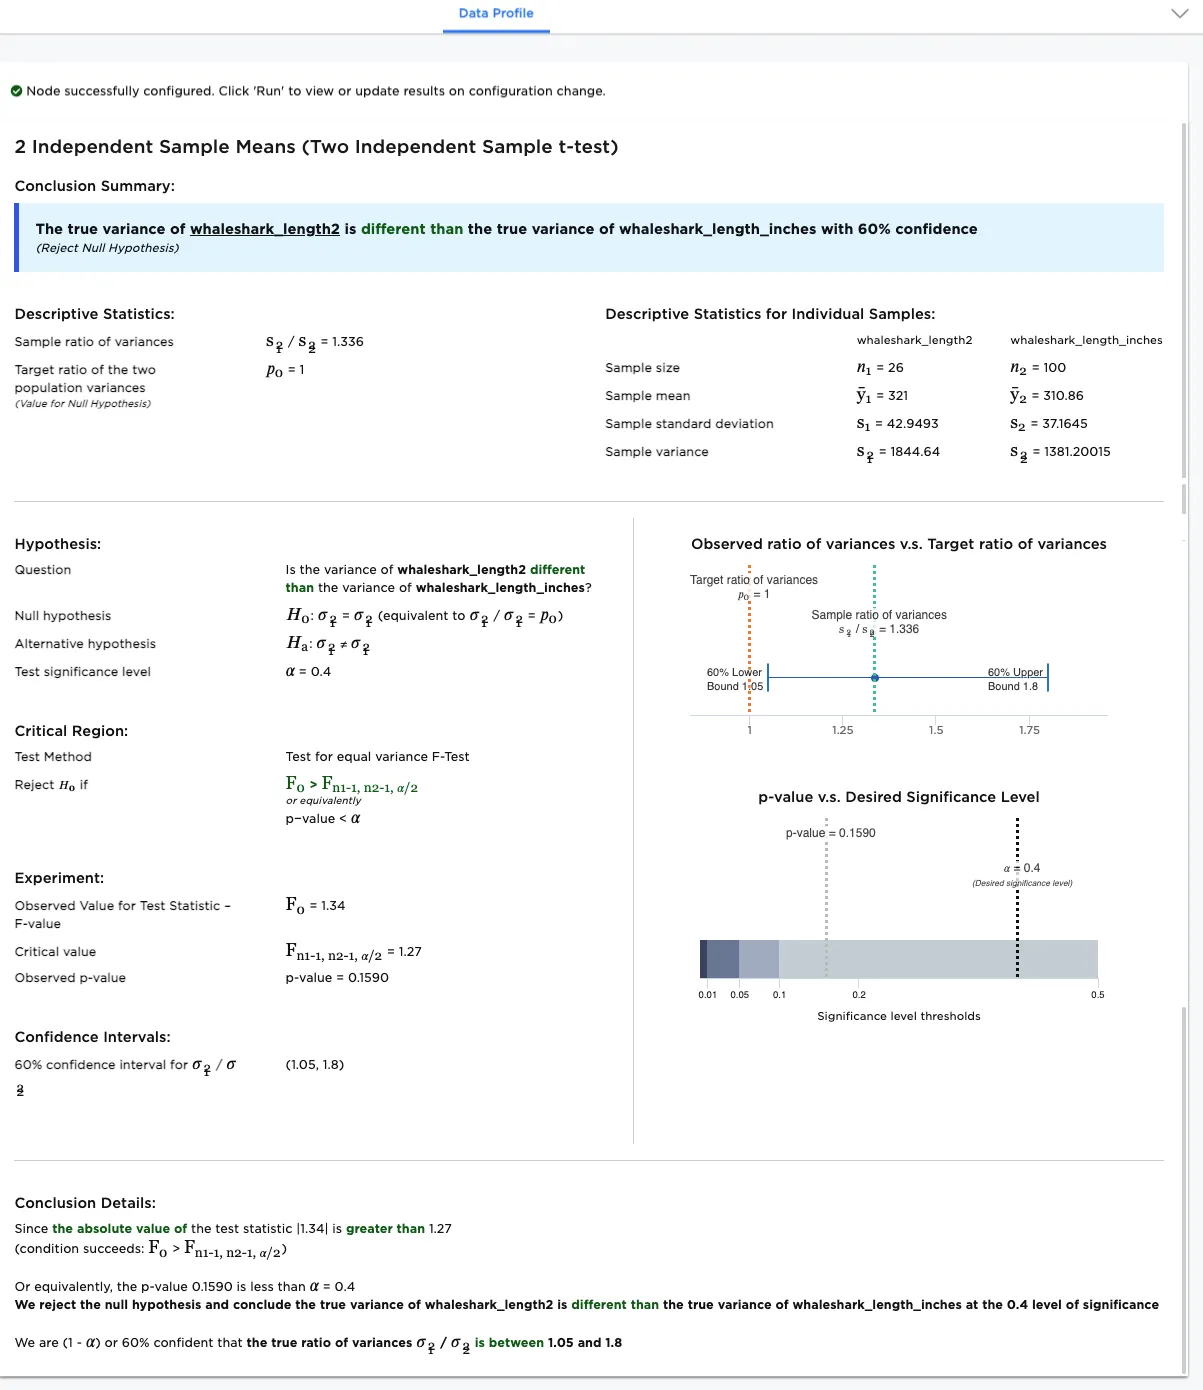
Figure 7: Full output using a custom value of .4 for the significance level (𝛼)