2-Sample Proportion
Use Visual Notebooks to determine whether the proportion of true values in a sample differs significantly from a specified value.
Configuration
| Field | Description |
|---|---|
| Name default=none | Name of the node |
| An optional user-specified node name displayed in the workspace, both on the node and in the dataframe as a tab. | |
| Select Sample 1 Column Required | Column to use in the calculation |
| Select the column that contains the data you want to use in the calculation. The selected column must contain Boolean values. | |
| Select Sample 2 Column Required | Column to use in the calculation |
| Select the column that contains the data you want to use in the calculation. The selected column must contain Boolean values. | |
| Target difference between the population proportions - 𝜹₀ (default 0%) Required | The difference in the proportion of true values between the samples |
| Enter the target percent difference in the proportion of true values between the two samples. | |
What do you want to determine? default=Is the difference between the population proportions of sample 1 column and sample 2 column greater than the target difference?(𝑝₁ − 𝑝₂ > 𝛿₀) | The relationship between the target proportion and the sample proportion |
| Select less than, greater than, or different than for the selected test metric. Selecting different than runs a 2-tailed test, while selecting greater than or less than runs a 1-tailed test. | |
Desired Significance Level - 𝛼 default=0.05 | The probability of an error |
| Select 0.01, 0.05, 0.1, 0.2, or Custom. This value represents the confidence in the test's findings. | |
| Custom value for alpha default=none | Custom probability of an error |
| If Custom is selected for the Desired Significance Level, enter a number between 0 and 1 for the alpha value. | |
Test Method default=Normal Approximation Method Z-test with separate estimate for p (default) - Use only when the sample sizes n₁ and n₂ are large (100 samples or larger recommended) | Type of test |
| More test methods are coming soon. |
Node Inputs/Outputs
| Input | A dataframe in Visual Notebooks |
|---|---|
| Output | Results of the 1-sample proportion test |
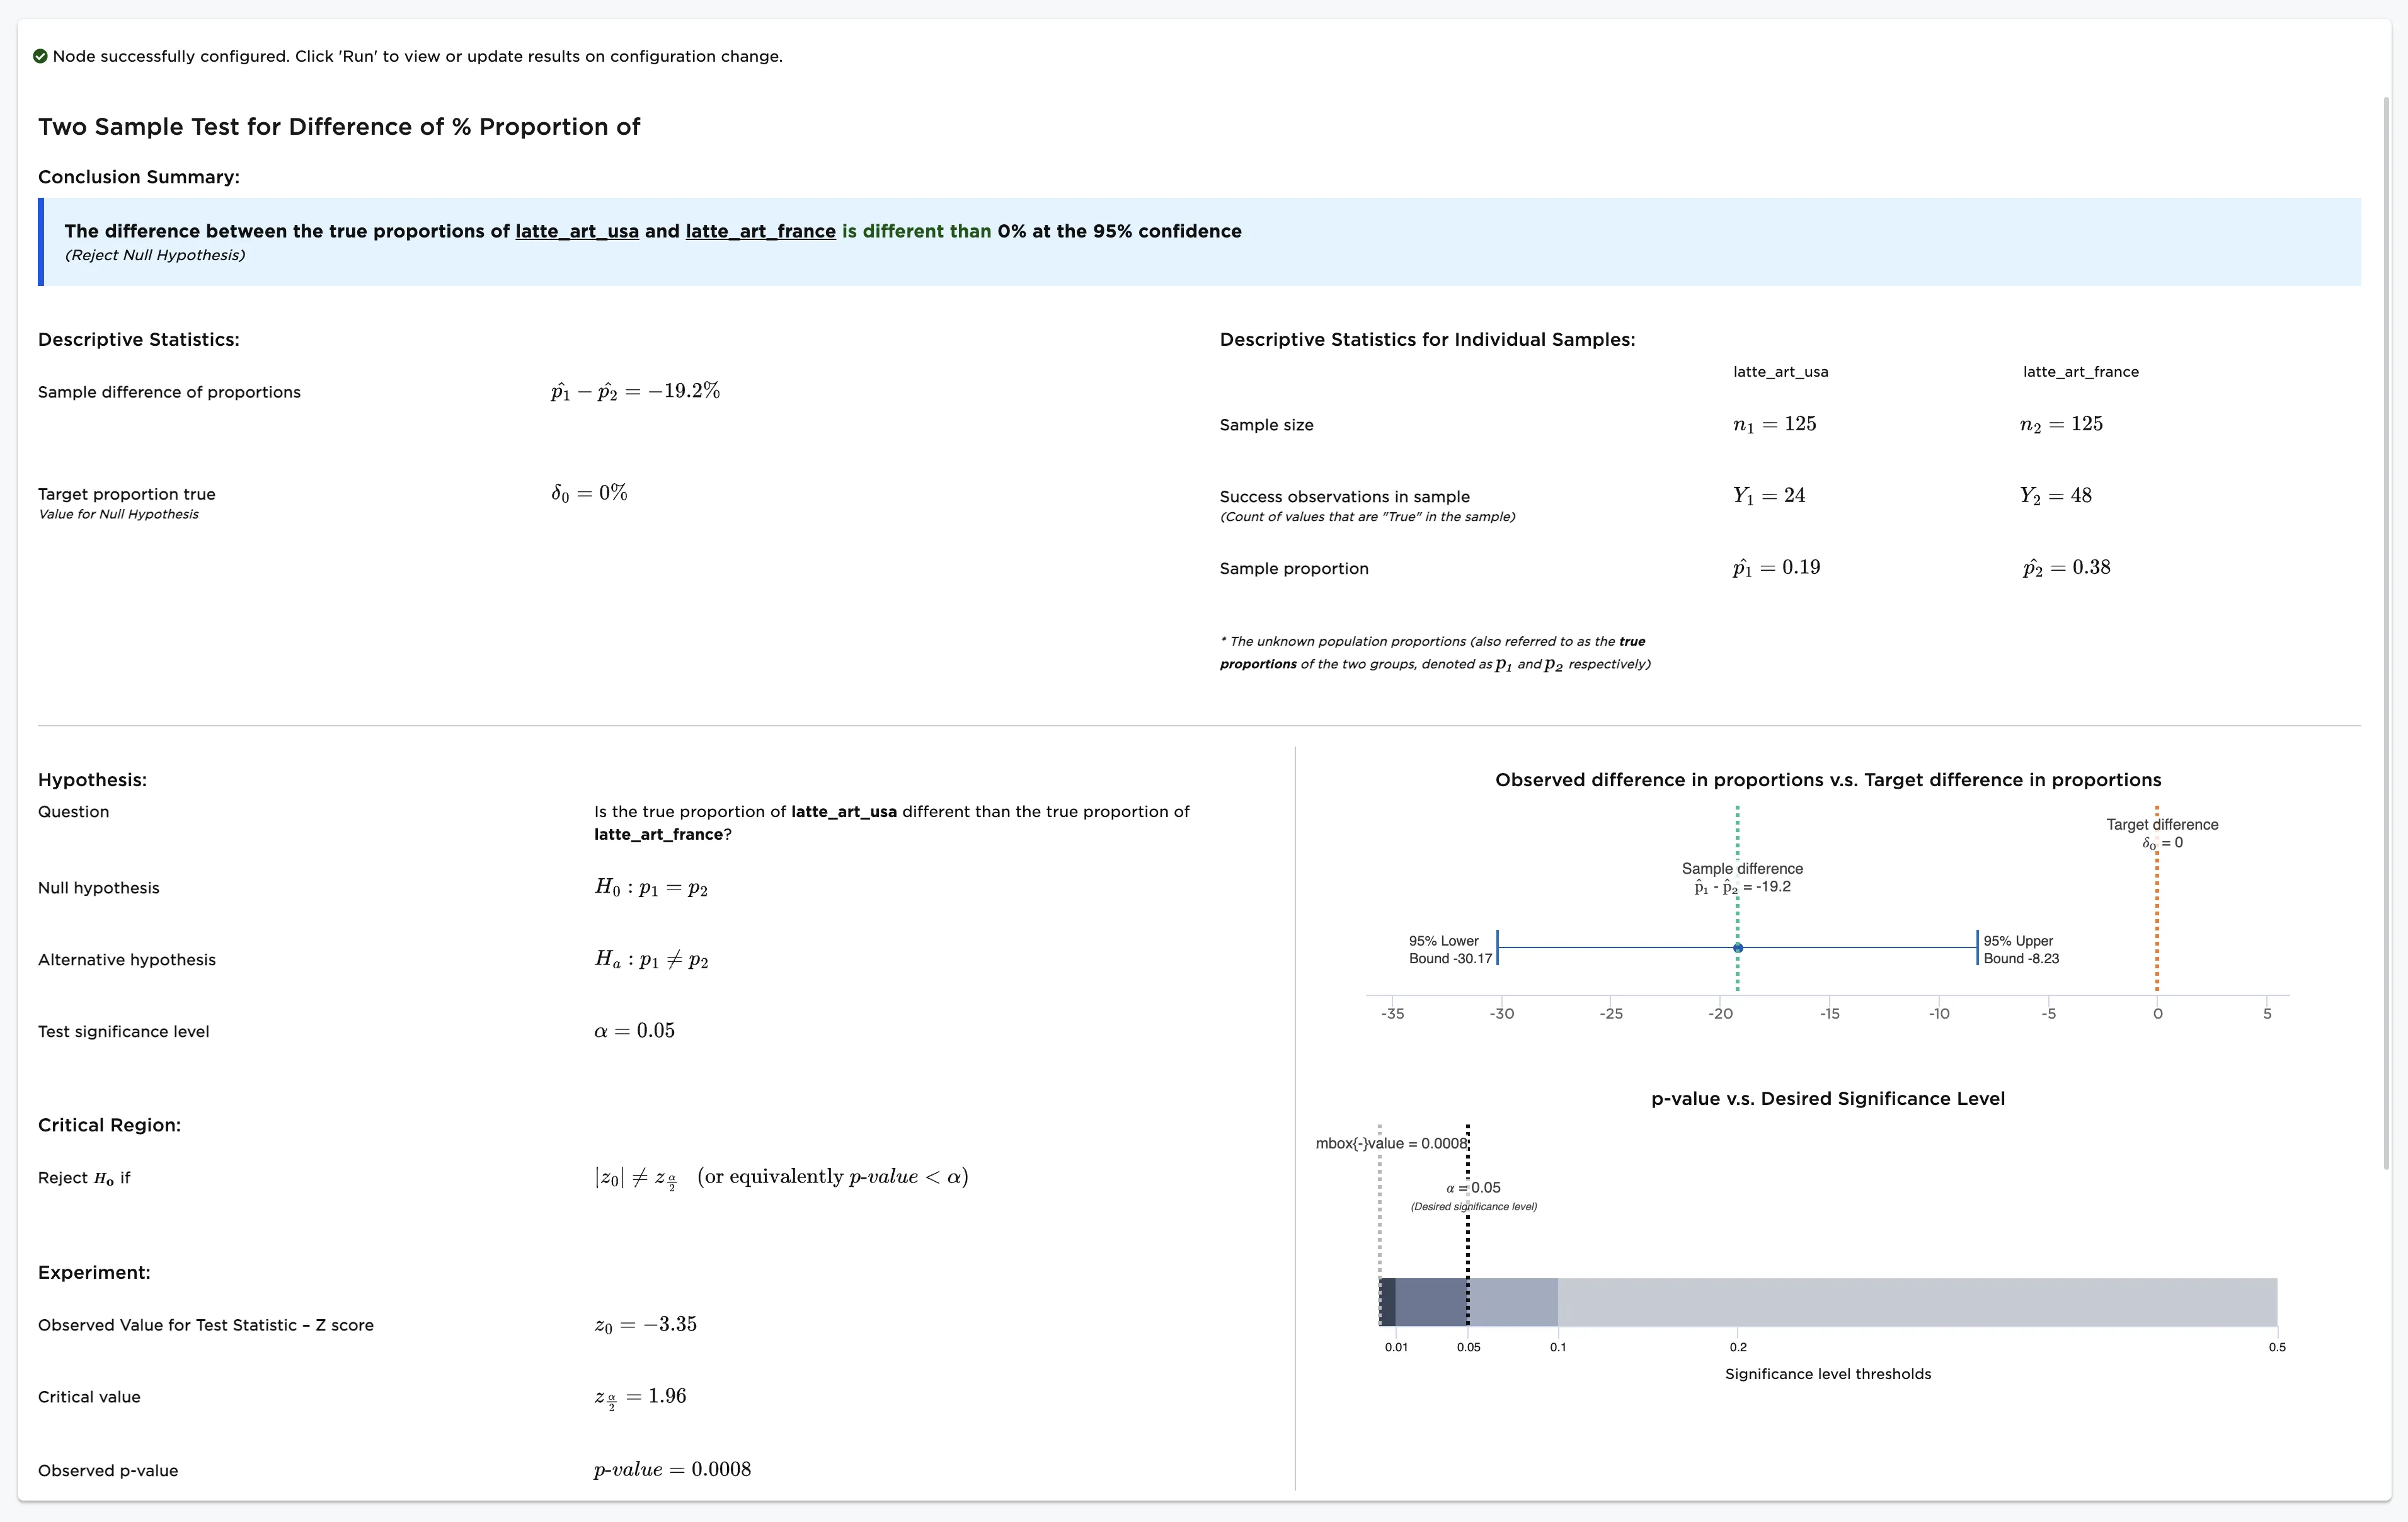
Figure 1: Example output
Examples
Imagine that you and your friend frequently visit independent coffee shops and order lattes. You live in the U.S., and your friend lives in France. Both of you notice that your lattes sometimes feature latte art and sometimes do not. You decide that you want to determine whether the proportion of U.S. coffee shops that have latte art is different from the proportion of French coffee shops that have latte art.
You collect data about coffee shops in the U.S., and your friend collects data from coffee shops in France.
You and your friend can't go to all of the independent coffee shops in the U.S. and in France to find the answer, but you can record your experiences at a small selection of cafés and try to gain insight from the samples. Over a period of time, you and your friend each order 125 lattes from various independent coffee shops. You note the name of the coffee shop, the price of the latte, and whether the drink features latte art. The data you collect is shown in Figure 2.
Note that the columns "latte_art_usa" and "latte_art_france" contain boolean values. Lattes with art have a value of "true," while lattes without art have a value of "false." You want to determine if the proportion of true values is different between the two samples.
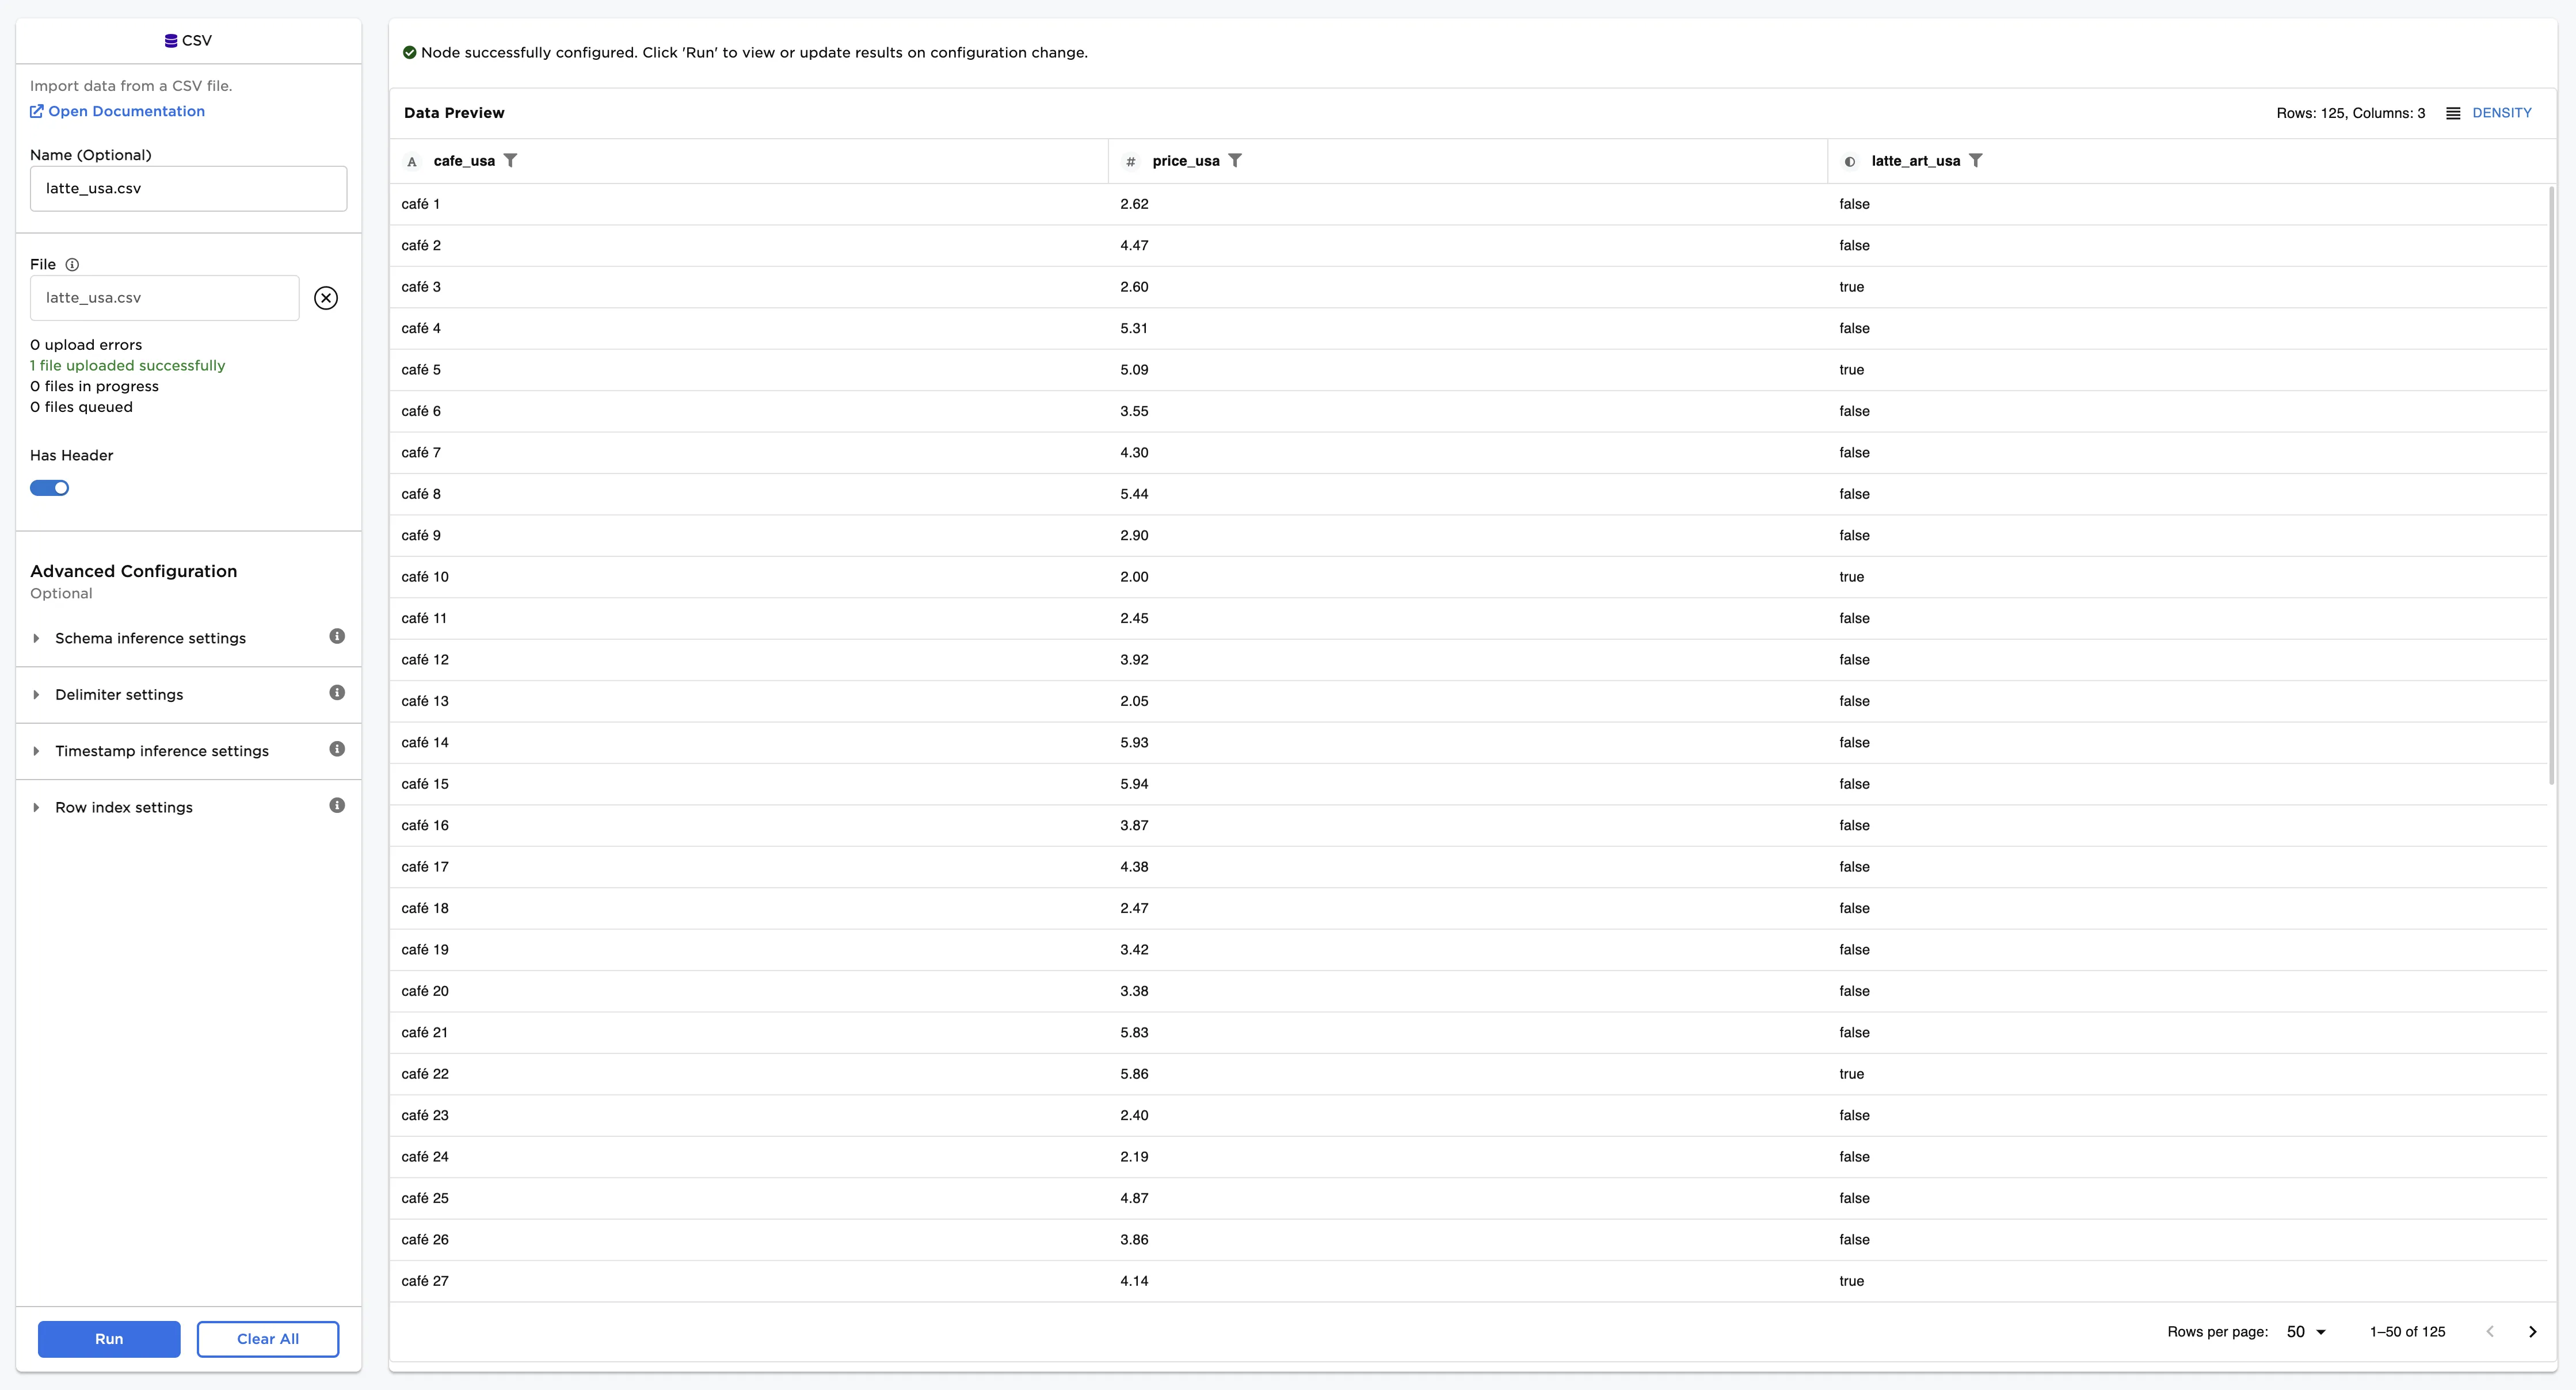
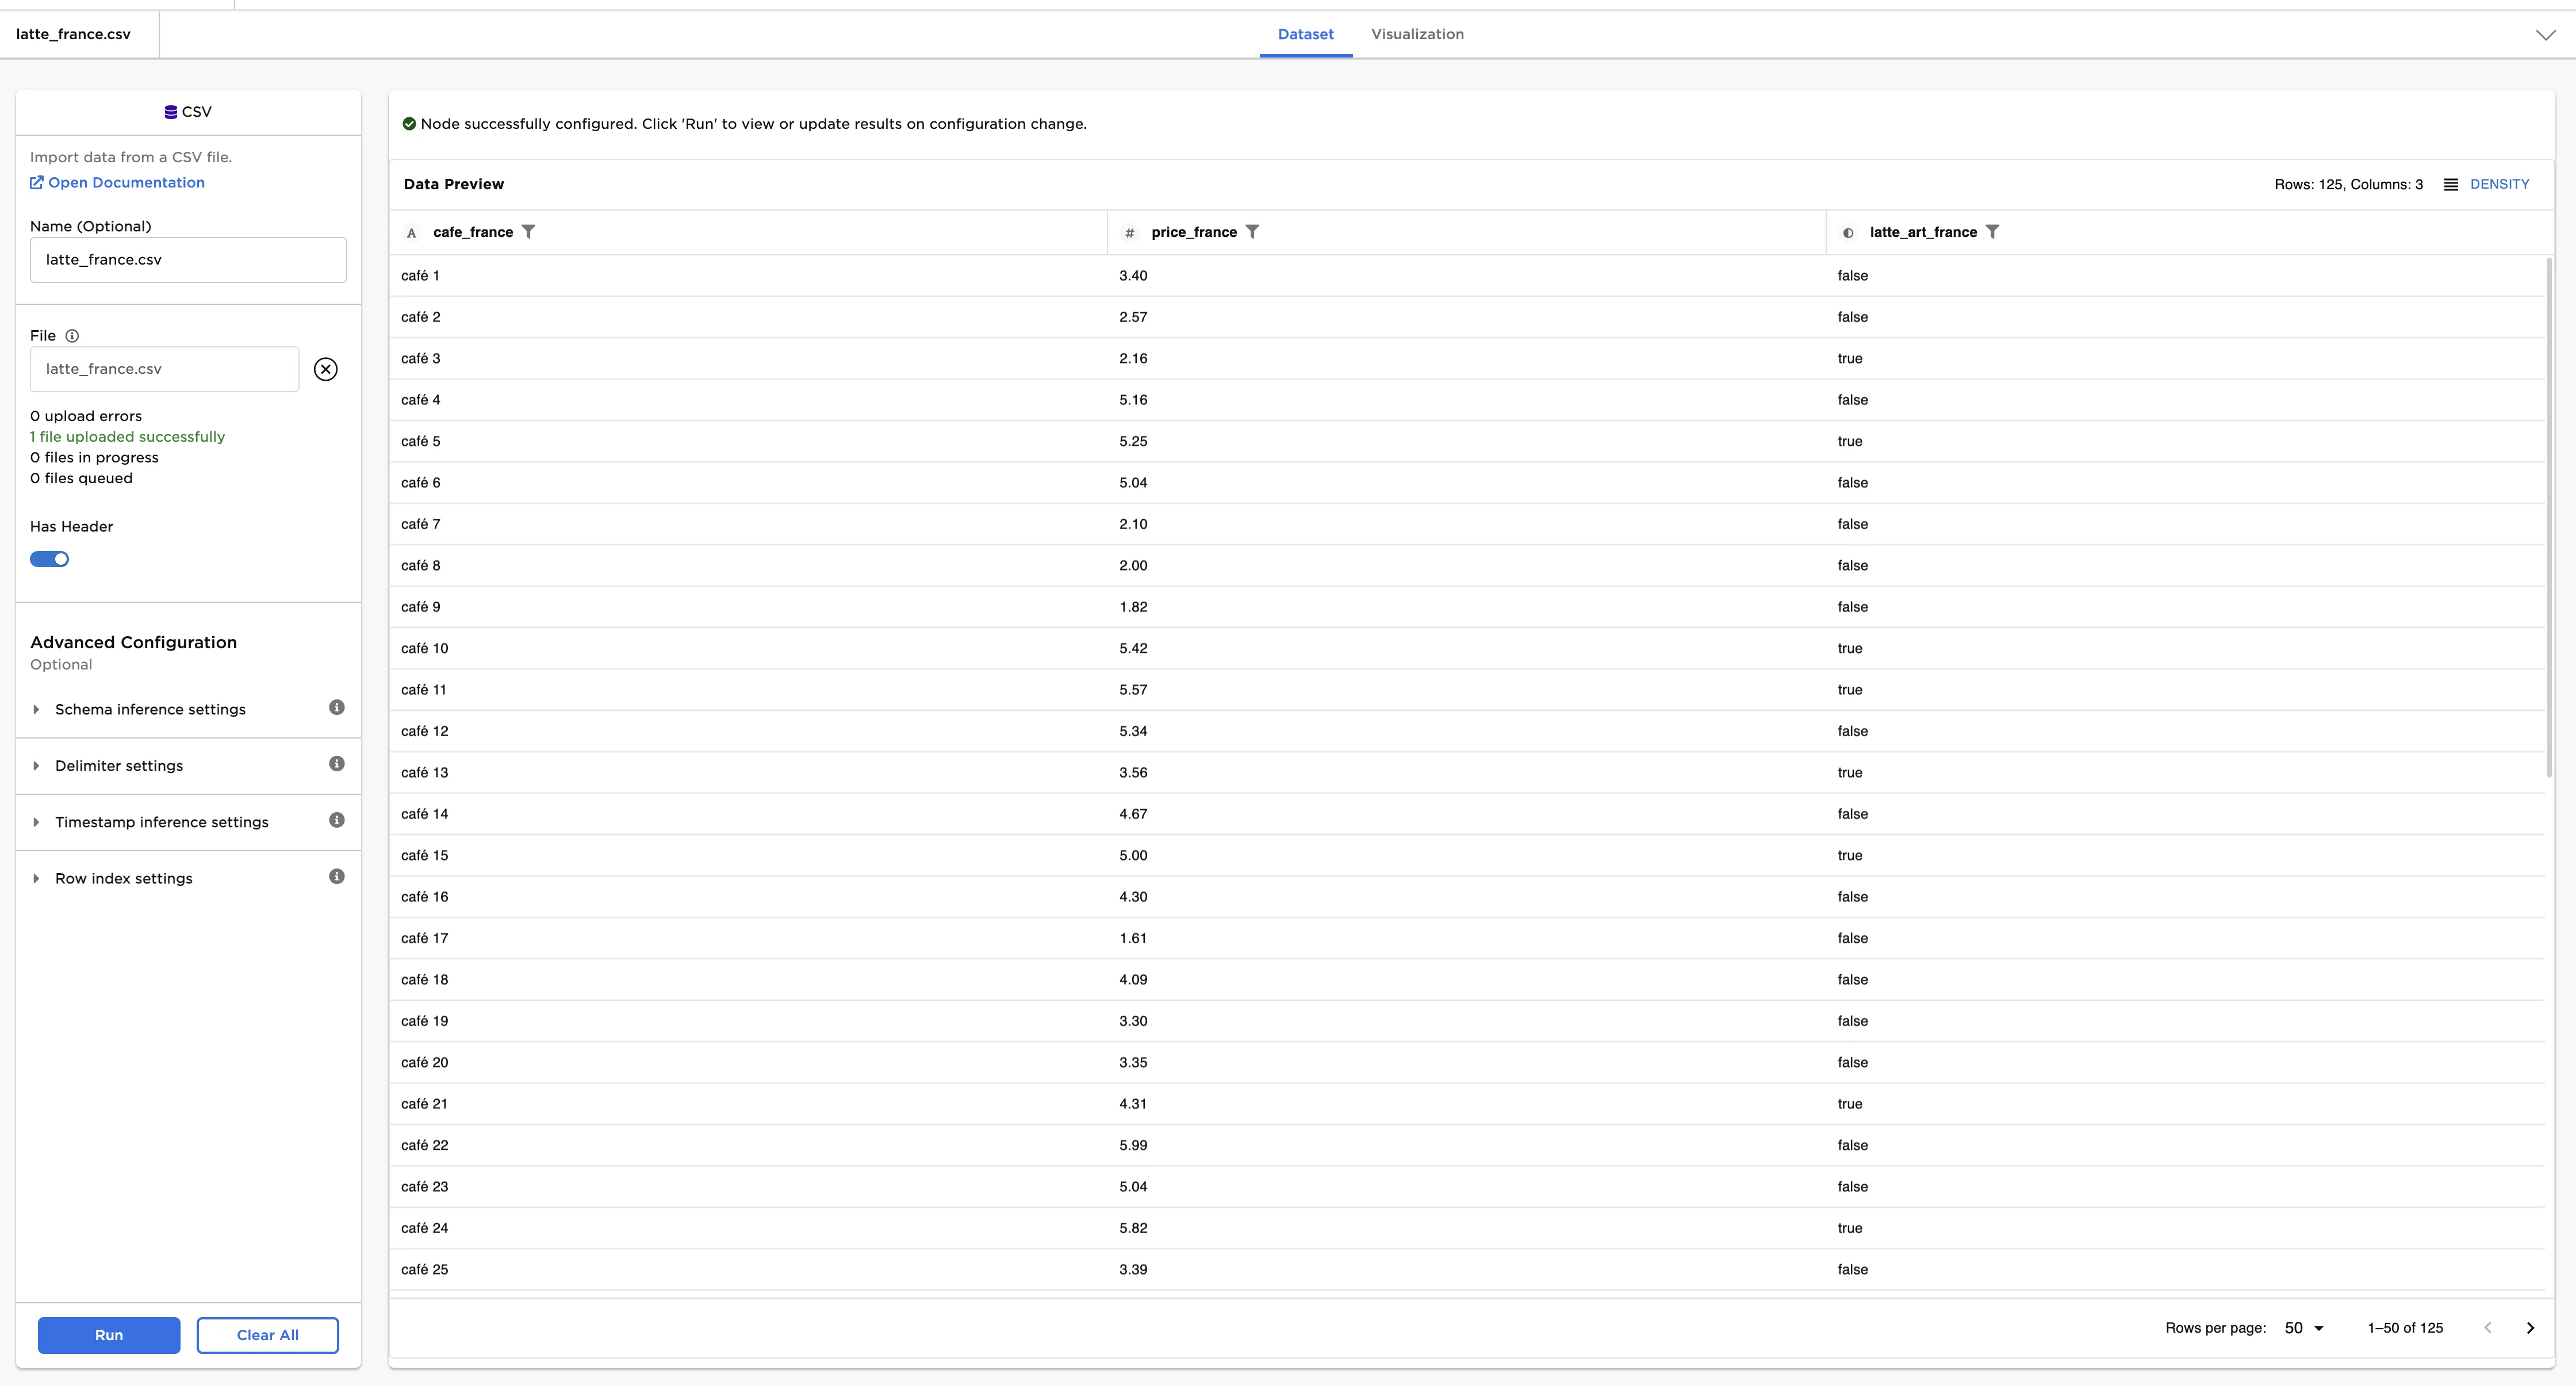
Figure 2: Example inputs
You suspect that the proportion of U.S. coffee shops that have latte art is different from the proportion of French coffee shops that have latte art. Given this use case, the following terminology is used in the rest of this example:
- "Population" is the immeasurable group of lattes in the world.
- "Sample" is the small, hand-collected group of lattes used for testing.
- The "null hypothesis" is the information you are disputing: the proportion of true values in the latte population is 20%.
- The "alternative hypothesis" is the theory you are proposing: the proportion of true values in the latte population is greater than 20%.
Follow the steps below to determine whether those proportions are different.
- Connect a 2-Sample Proportion node to two existing nodes. In this example, connect the 2-Sample Proportion node to a CSV node that contains U.S. data and a CSV node that contains French data.
- Select the 2-Sample Proportion node to configure it.
- Select latte_art_usa (Boolean) for the Select Sample 1 Column field.
- Select latte_art_france (Boolean) for the Select Sample 2 Column field.
- Enter "0" for the Target difference between the population proportions field.
- Select Is the population proportion of latte_art_usa different than the population proportion of latte_art_france? for the What do you want to determine? field.
- Select Run to perform a the 2-sample proportion test.
Notice that Visual Notebooks presents a page of results. At the top of the page is a single-sentence summary. In this case, the test determined that the proportion of true values in the U.S. is different from the population of true values in France at the 95% confidence level. In other words, lattes with art are not found in at the same frequency in the U.S. as they are in France.
Figure 3: 2-sample proportion test