ML Pipeline Node
Use an ML Pipeline asset in a Visual Notebooks visual notebook.
Configuration
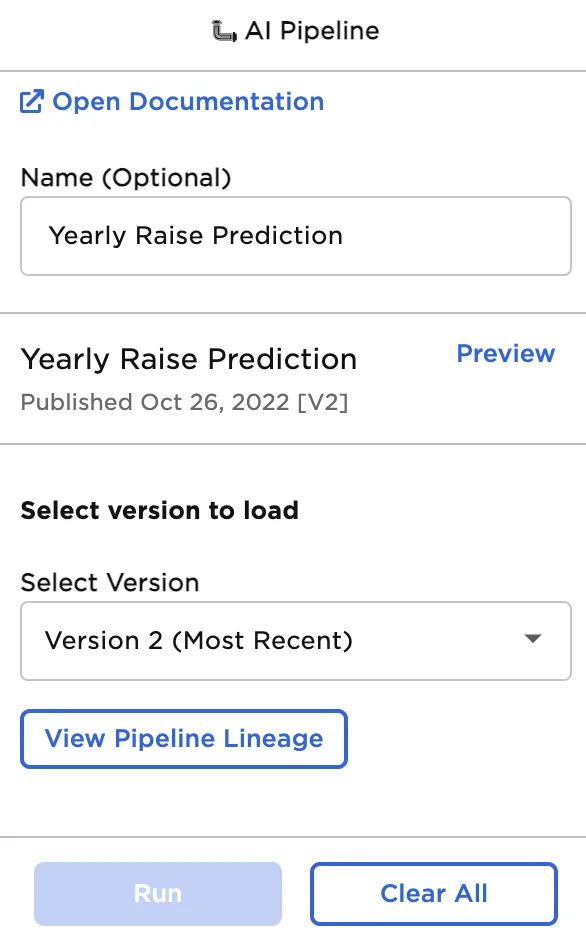
Figure 1: Configuration sidebar
| Field | Description |
|---|---|
| Name Required | Name of the node A user-specified node name, displayed in the canvas and in the dataframe as a tab. |
| Select Version Default: (Most Recent) | Pipeline version Select a version of the pipeline to use in the current project. This version is used each time the visual notebook runs. |
Node Inputs/Outputs
| Input | A Visual Notebooks dataframe |
|---|---|
| Output | A dataframe with predictions or transformations from the ML Pipeline |
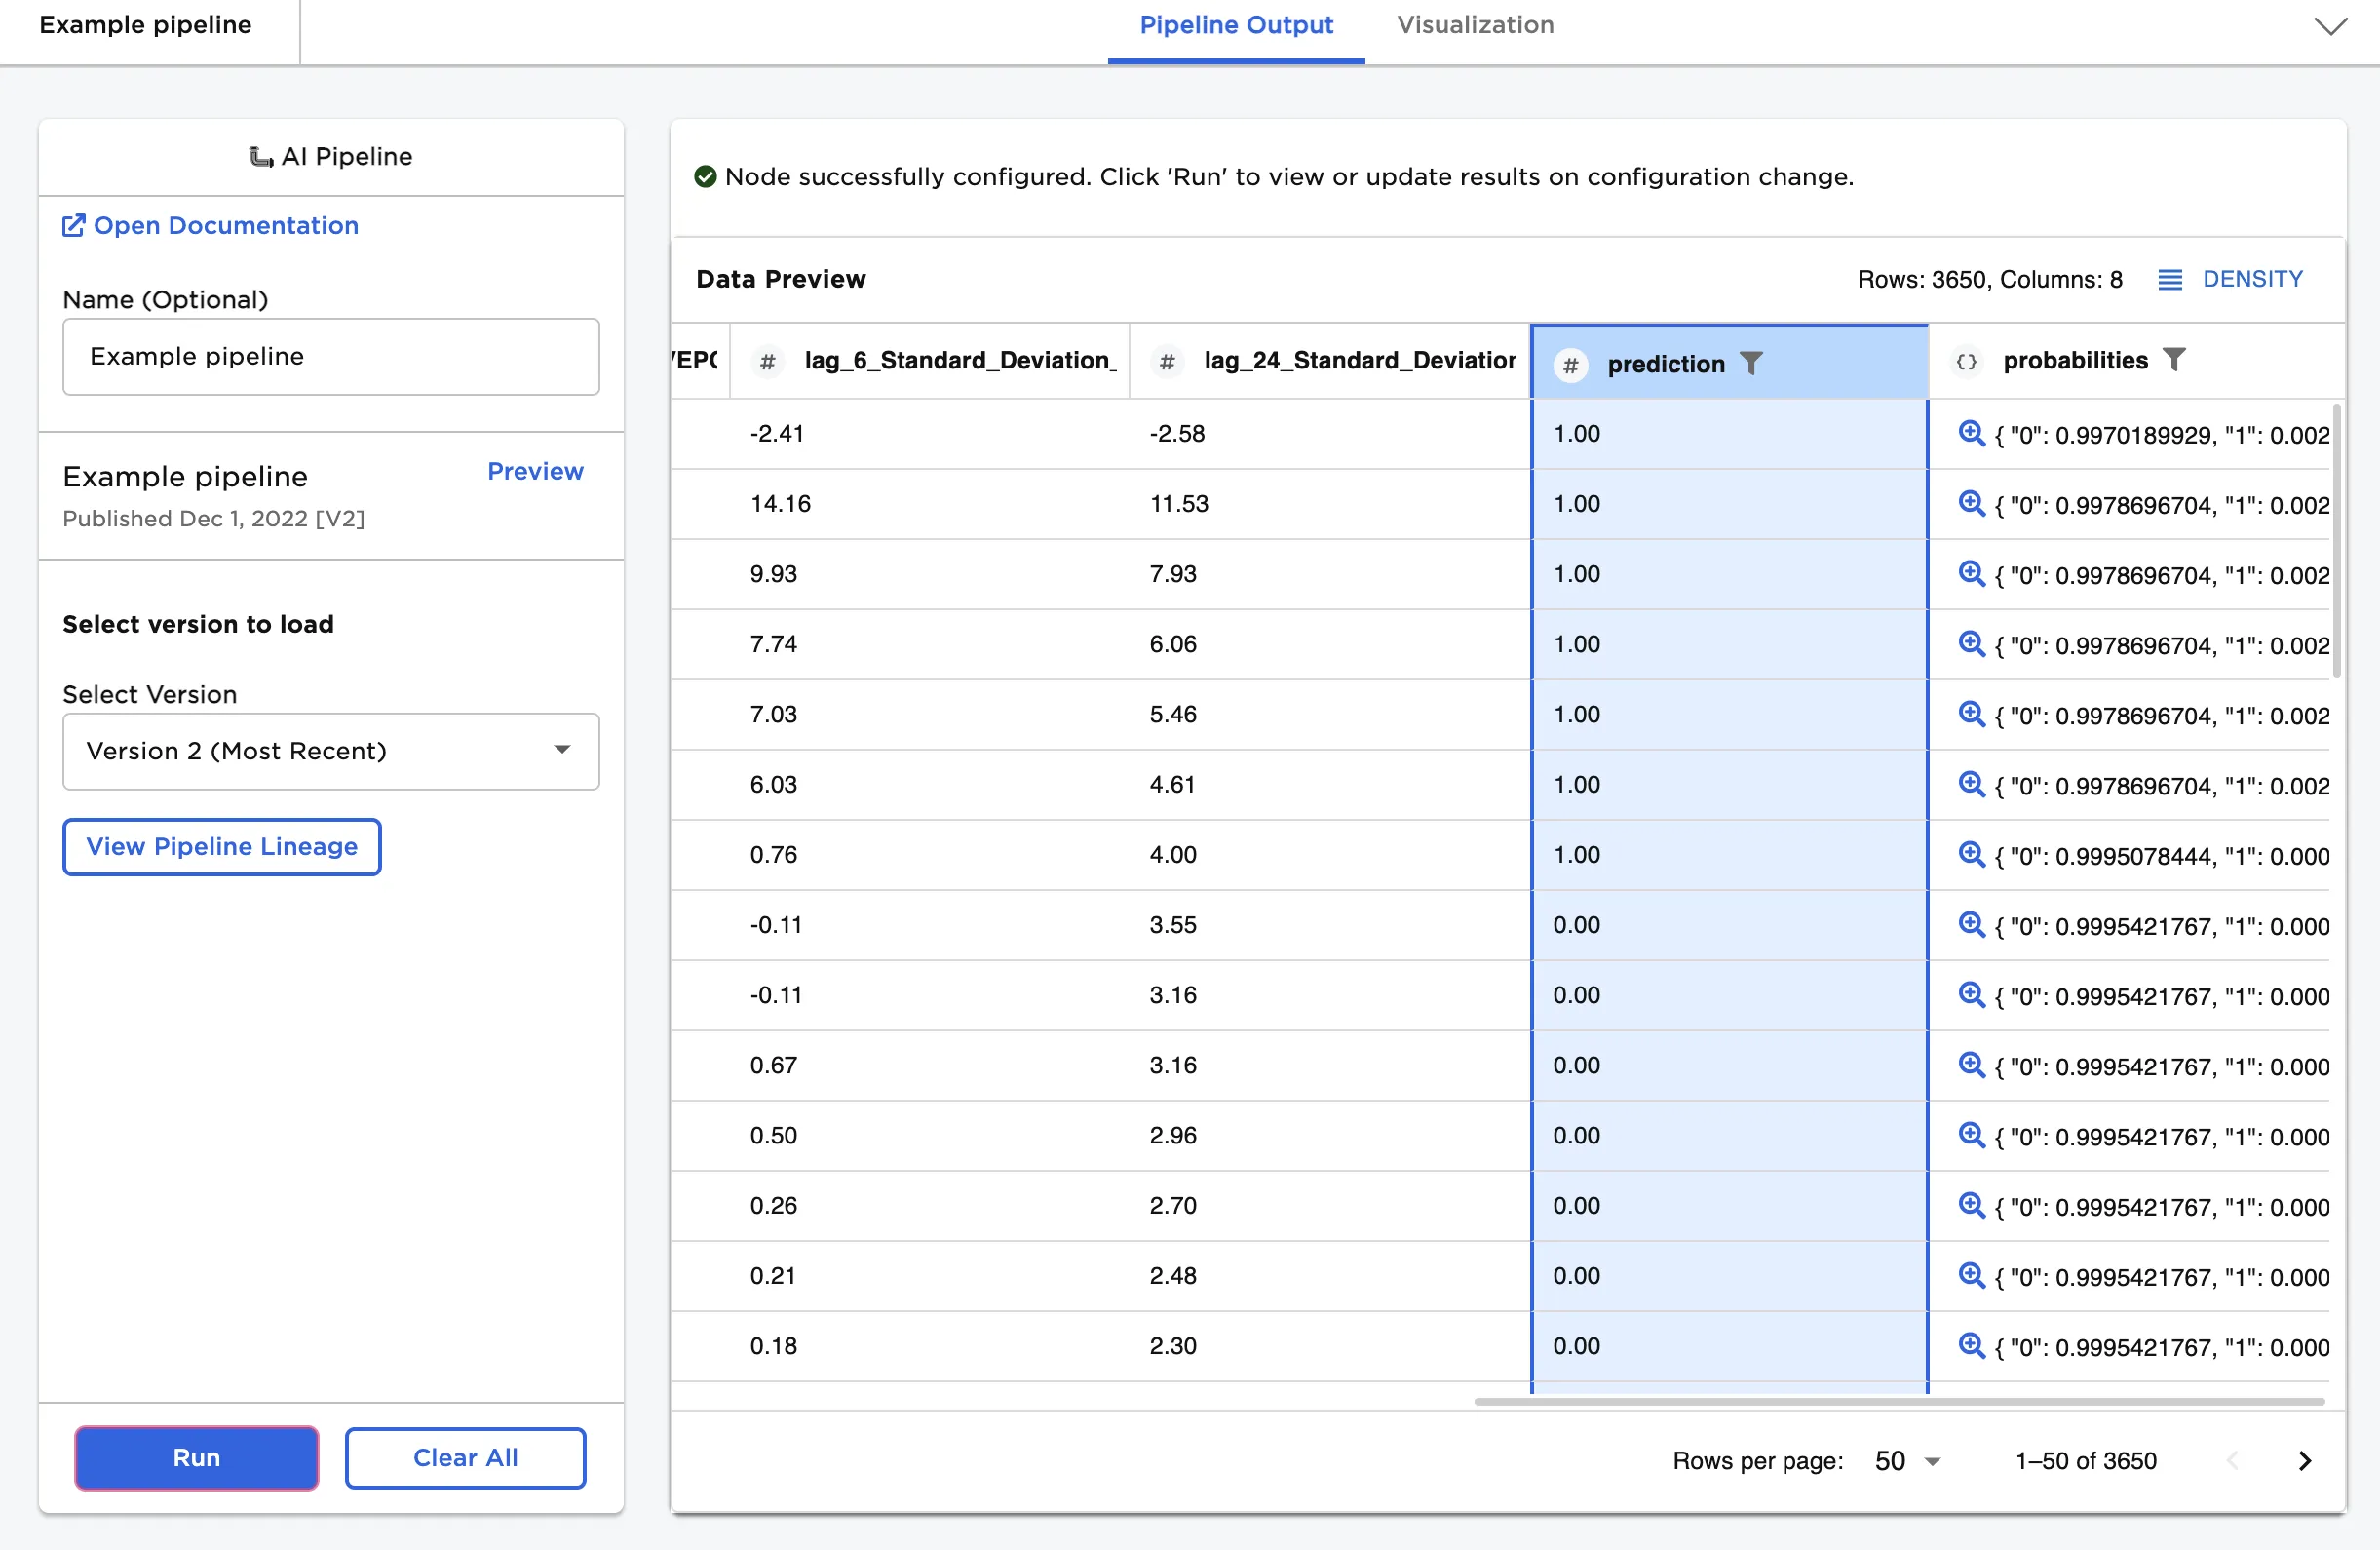
Figure 2: Example output
Examples
ML Pipelines are versioned assets that can be used across multiple visual notebooks. Typically, pipelines are used to scale data and save trained machine learning models.
After pipelines are created and published, they can be used as a node in visual notebooks. Follow the steps below to view published pipelines and other assets in the Ex Machina canvas.
- Select the Assets panel near the top of the canvas.
- Expand the ML Pipelines section.
- Select the Owned tab to view published pipelines you created.
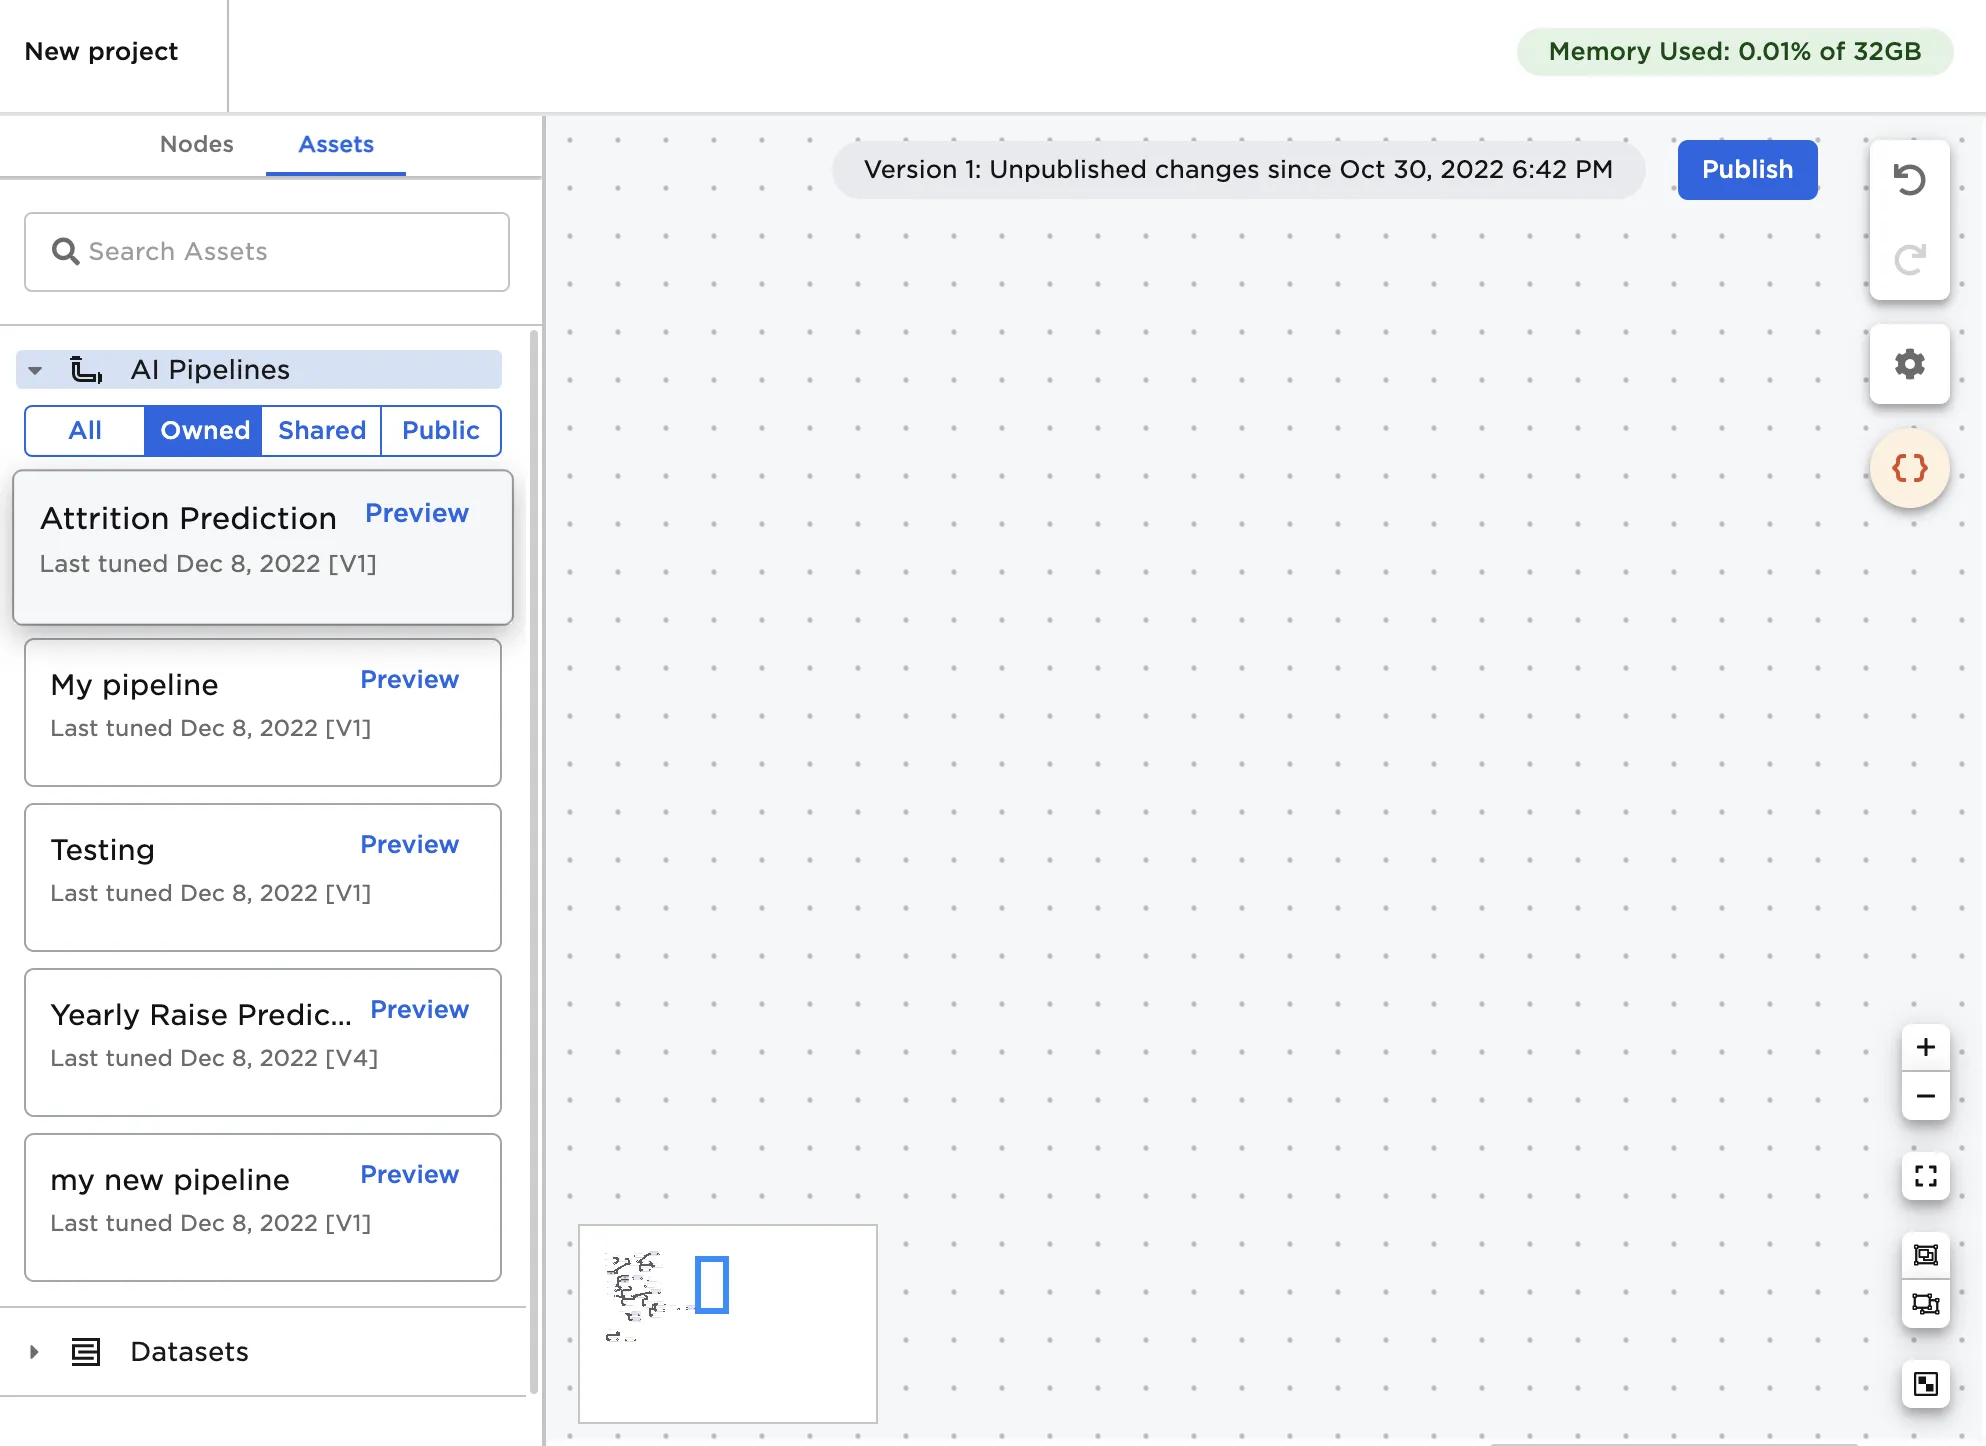
Figure 3: Published pipelines in the Assets panel
Select Preview to view the expected input and output schema for the selected ML Pipeline or add the pipeline to your visual notebook. You can also drag the pipeline onto the canvas as you would a node.
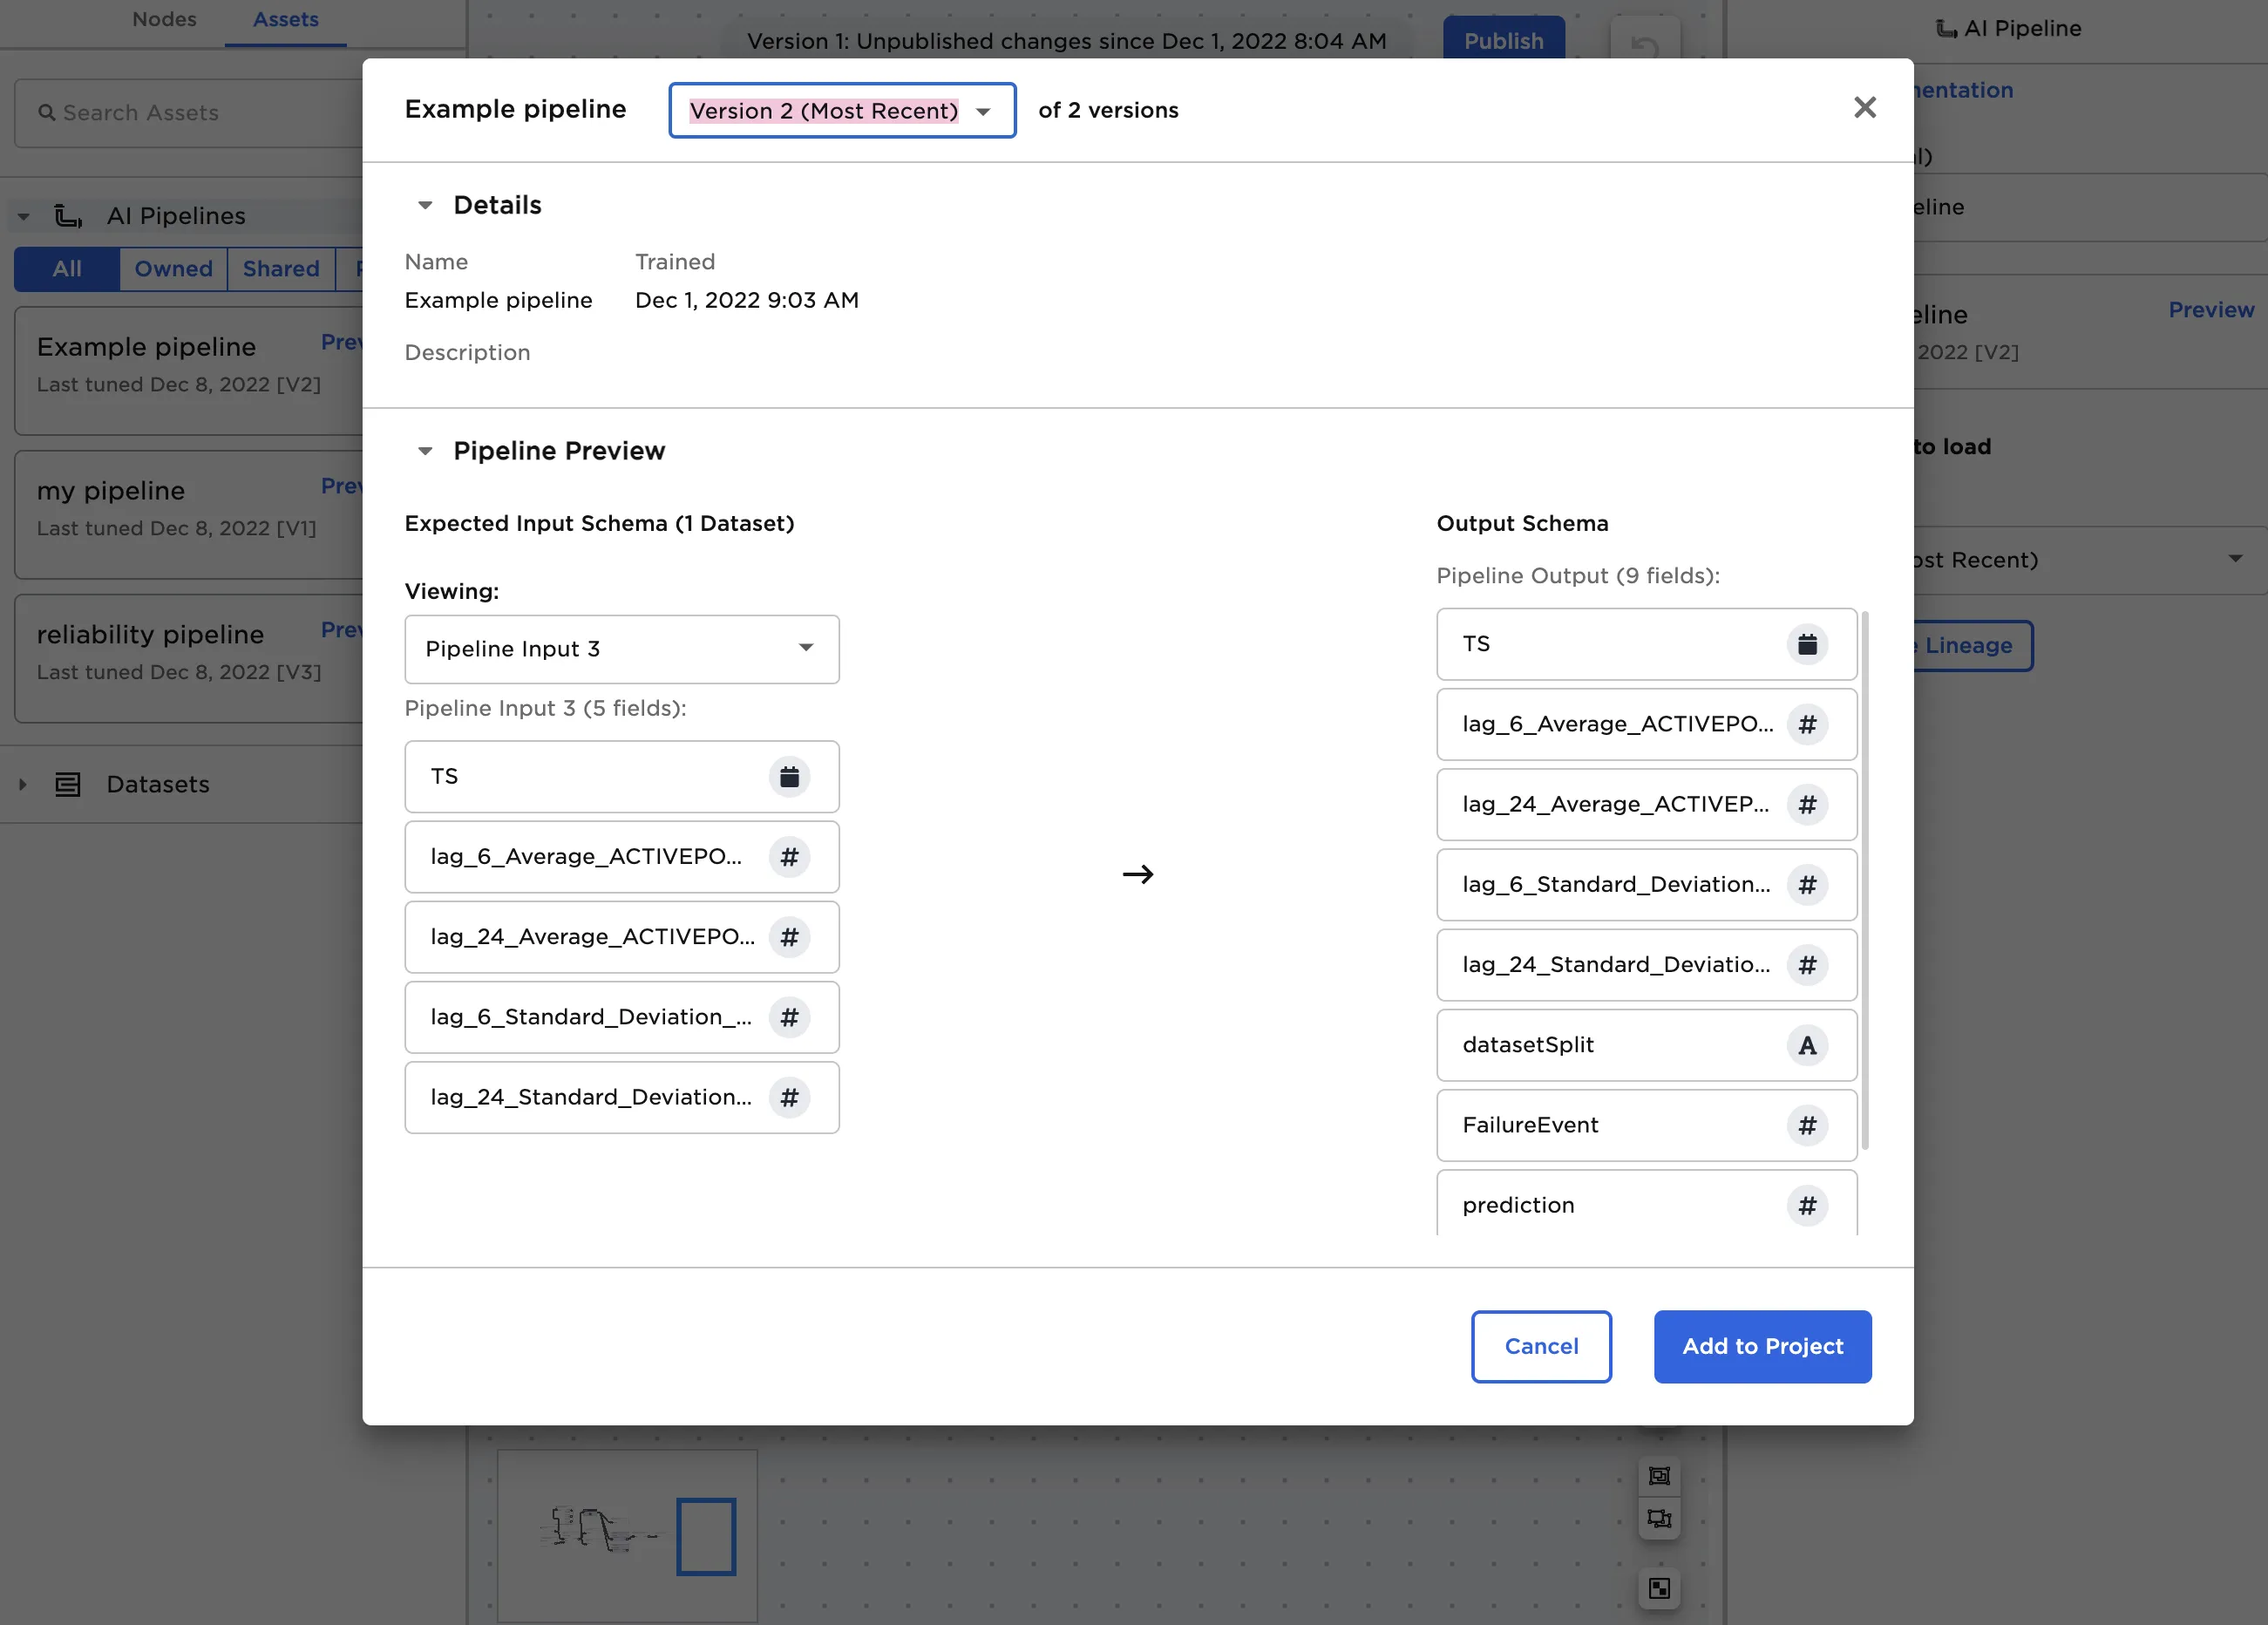
Figure 4: Pipeline preview
After an ML Pipeline node is on the canvas, connect it to an existing node that matches the expected input database schema. Select the ML Pipeline node to configure it.
By default, the node loads the most recent version of the pipeline. If desired, select a previous version of the pipeline to use each time the visual notebook runs. Select View Pipeline Lineage to view a detailed view of the pipeline history.
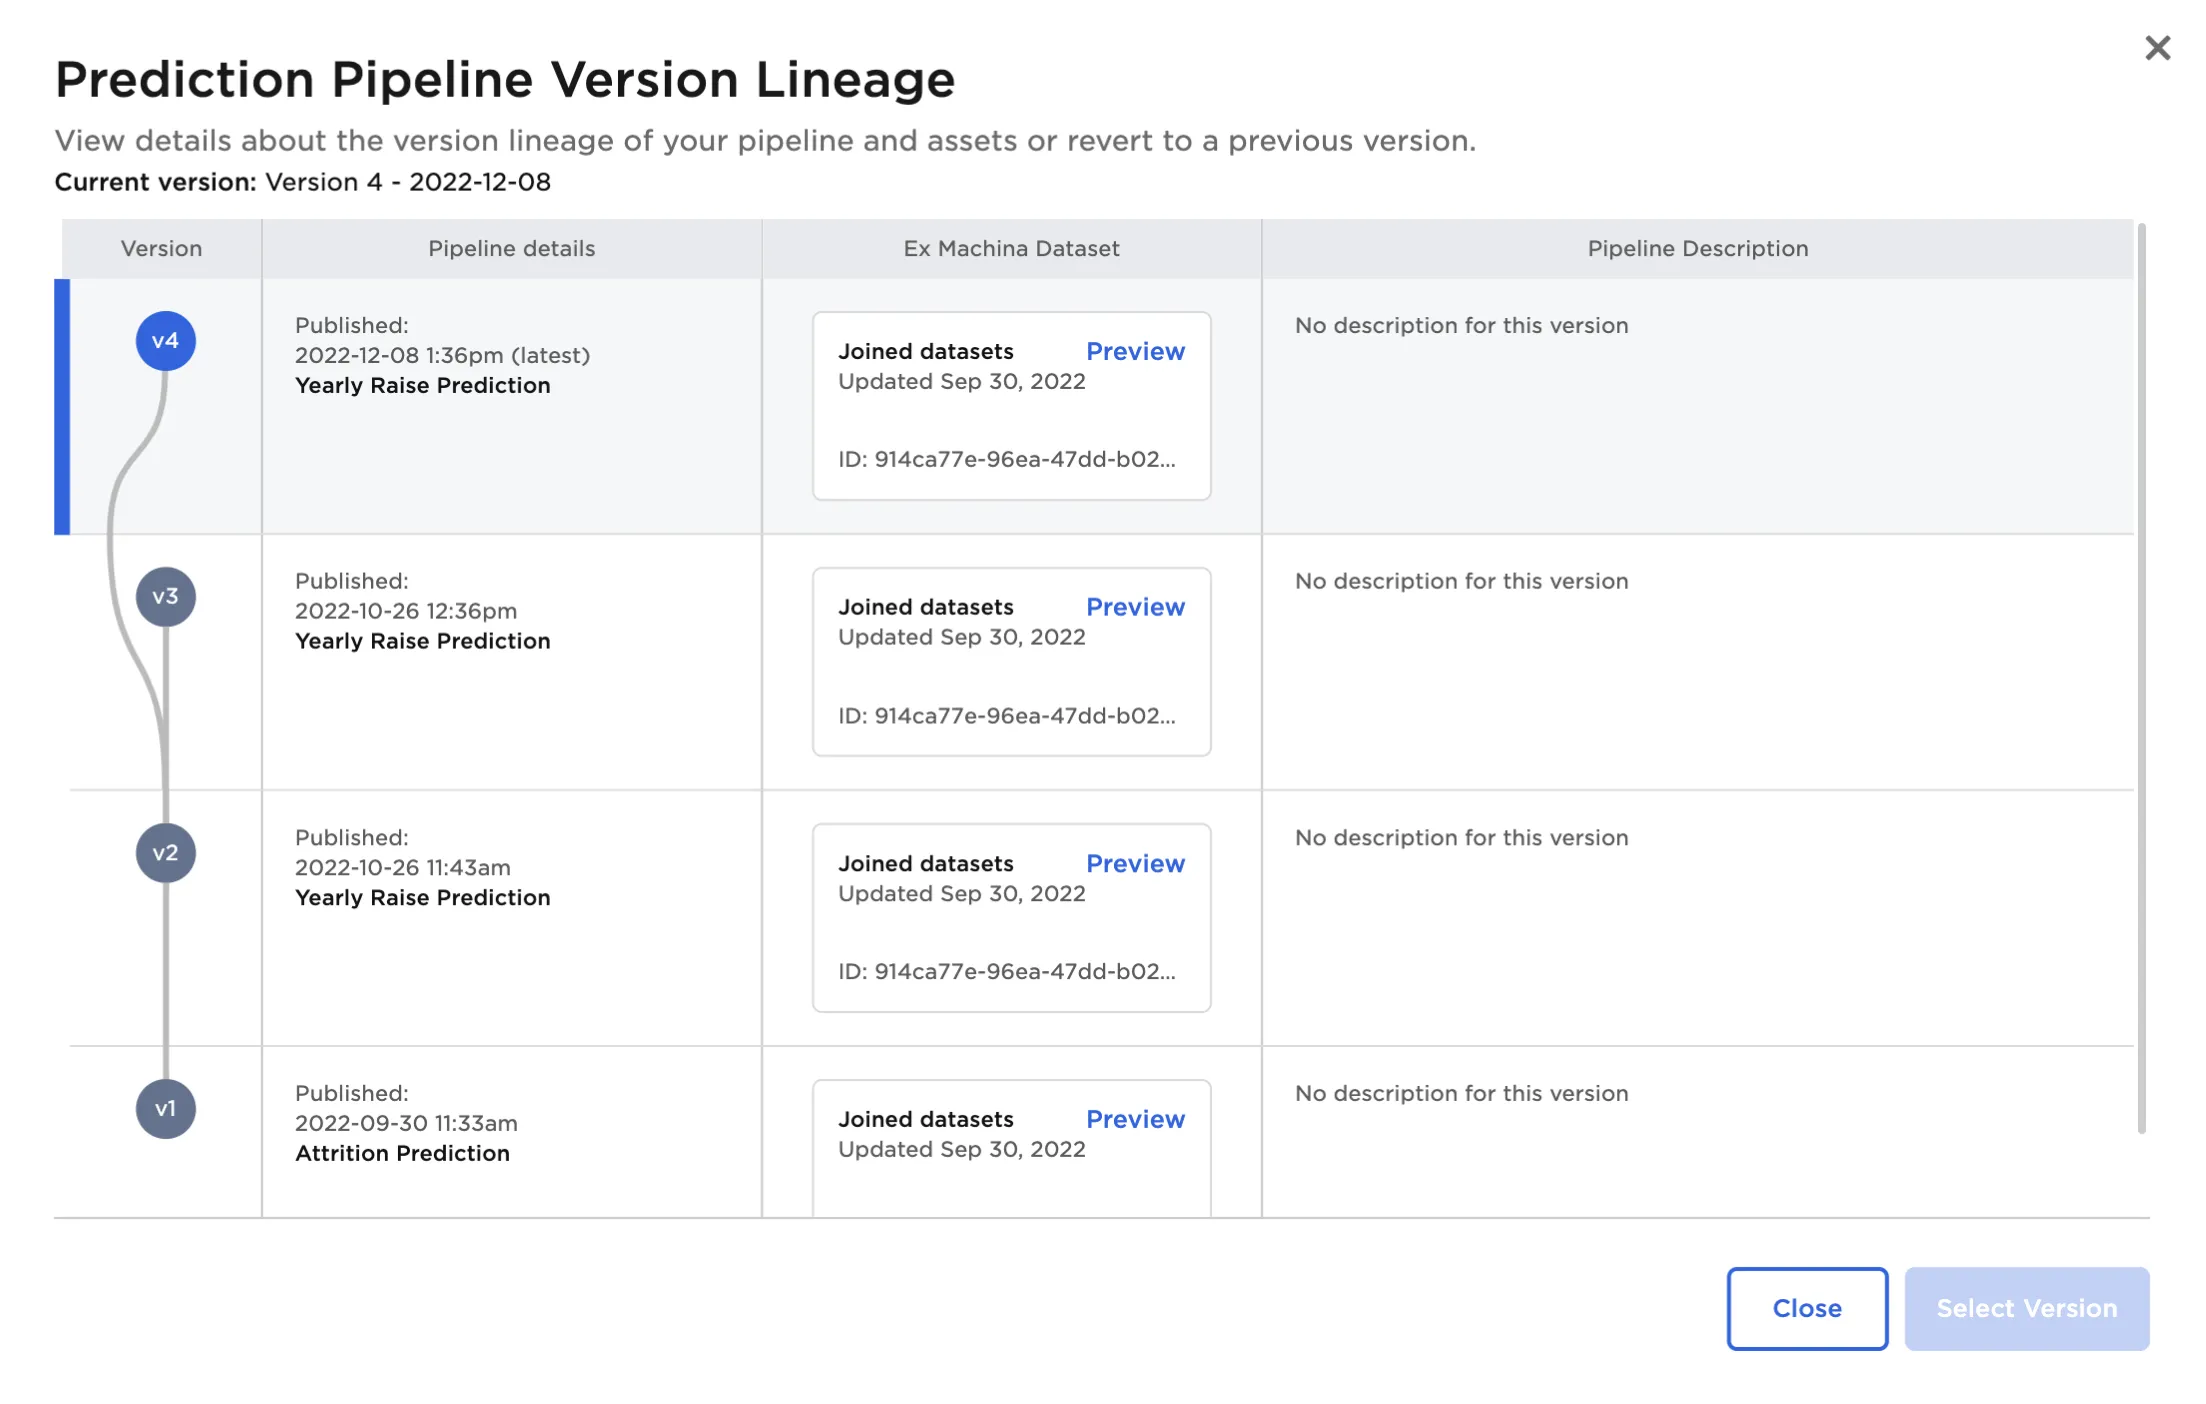
Figure 5: Pipeline lineage
Select Run to run the pipeline on the given input data. Typically, this means you are using a trained machine learning model to make predictions on new data. In this case, running the pipeline creates a dataframe with two new columns: "prediction" and "probabilities." Depending on the contents on your pipeline, the output columns may differ.
Figure 6: Example pipeline output