1-Sample Variance/Std Dev
Use Visual Notebooks to determine whether the variance or standard deviation of a sample differs significantly from a specified value.
Configuration
| Field | Description |
|---|---|
| Name default=none | Name of the node |
| An optional user-specified node name displayed in the workspace, both on the node and in the dataframe as a tab. | |
| Column Required | Column to use in the calculation |
| Select the column that contains the data you want to use in the calculation. | |
What is your preferred test metric? default=standard deviation 𝜎 | The statistic to test |
| Select variance 𝜎² or standard deviation 𝜎. | |
| Target value for Variance/Std Dev Required | The variance or standard deviation for the larger population |
| Enter a decimal or integer. | |
What do you want to determine? default=Is the standard deviation 𝜎 of the sample column greater than the target value? | The relationship between the target variance or standard deviation and the sample variance or standard deviation |
| Select less than, greater than, or different than for the selected test metric. Selecting different than runs a 2-tailed test while selecting greater than or less than runs a 1-tailed test. | |
Desired Significance Level - 𝛼 default=0.05 | The probability of an error |
| Select 0.01, 0.05, 0.1, 0.2, or Custom. | |
| Custom value for alpha default=none | Custom probability of an error |
| If Custom is selected in the field above, enter a number between 0 and 1. |
Node Inputs/Outputs
| Input | A dataframe in Visual Notebooks |
|---|---|
| Output | Results of the 1-sample variance or 1-sample standard deviation test |
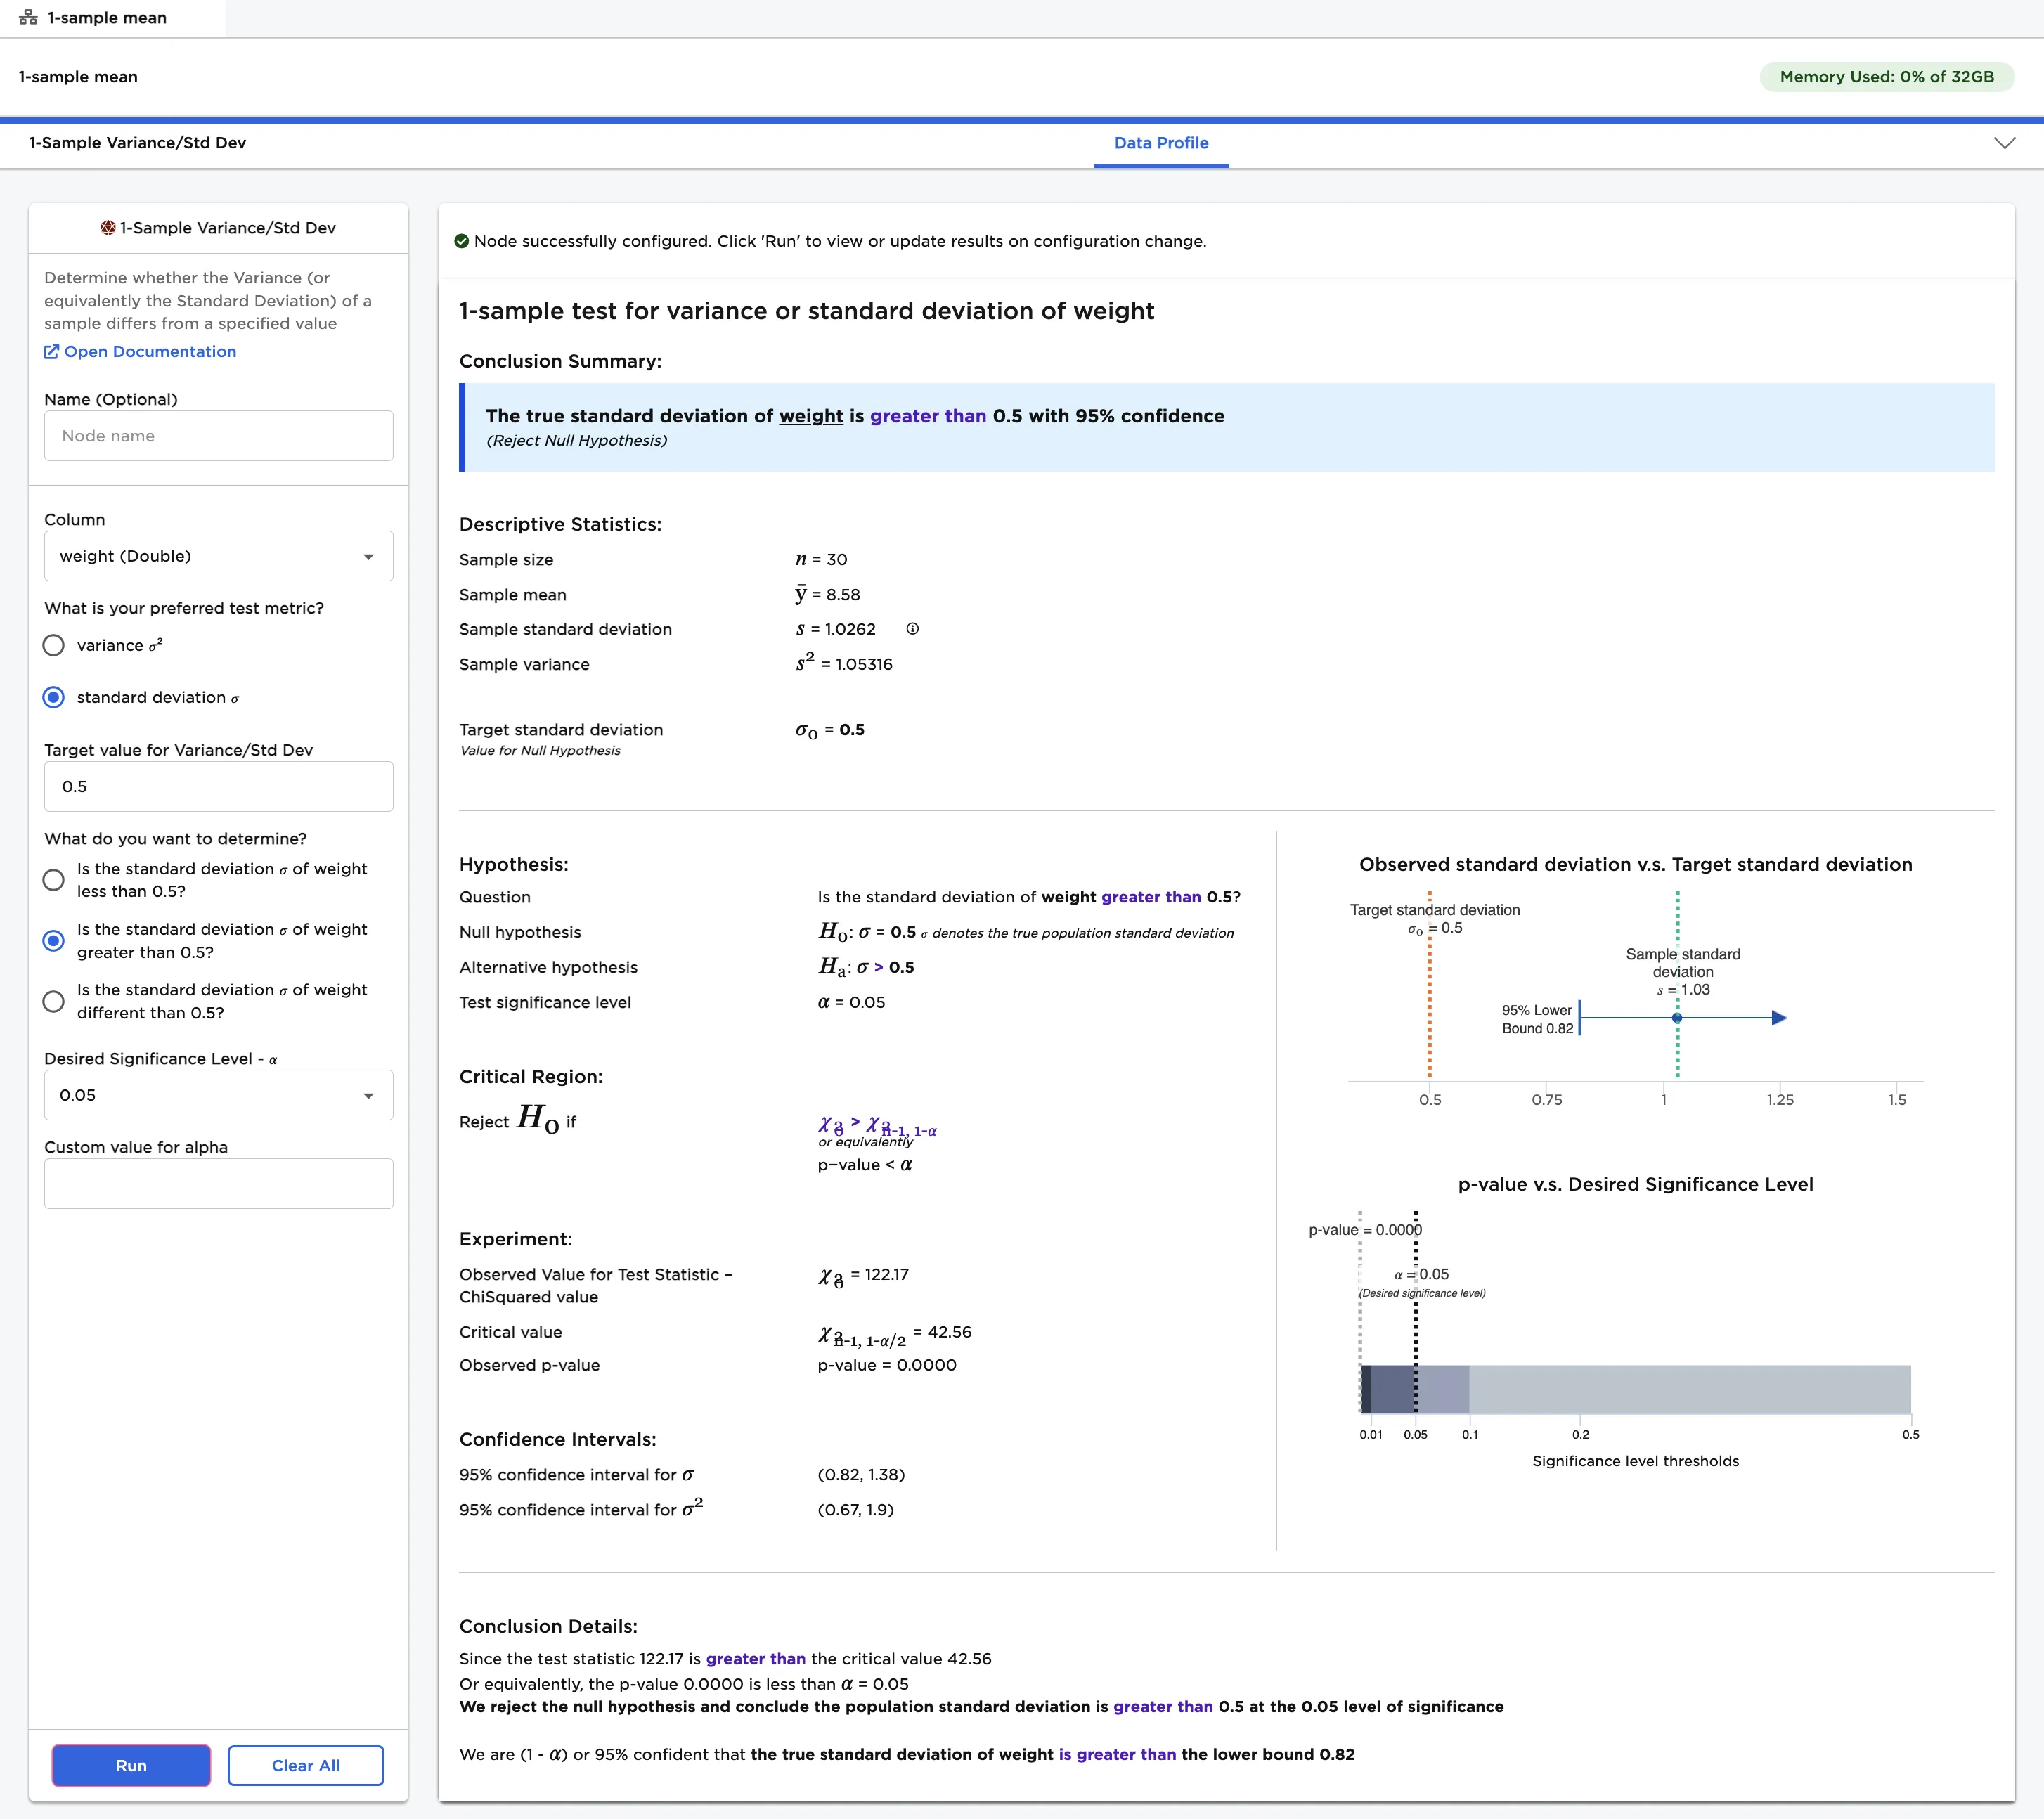
Figure 1: Example output
Examples
Imagine that you purchase multiple 8 oz bags of chips. After examining your purchase, you find that some bags weigh far more than 8 oz, while some weigh far less. You decide to test the variability of the chips. You want to measure how far the values are from the average value. Are most chip bags between 7.5 oz and 8.5 oz? Are some chip bags only 2 oz, while some are 15 oz?
You can't weigh all the chip bags in the world to find the answer, but you can collect a small sample of chip bags and try to gain insights from the sample. Imagine that you collect and weigh 30 chip bags from different locations. The weights of the 30 bags you collected are shown in Figure 2.
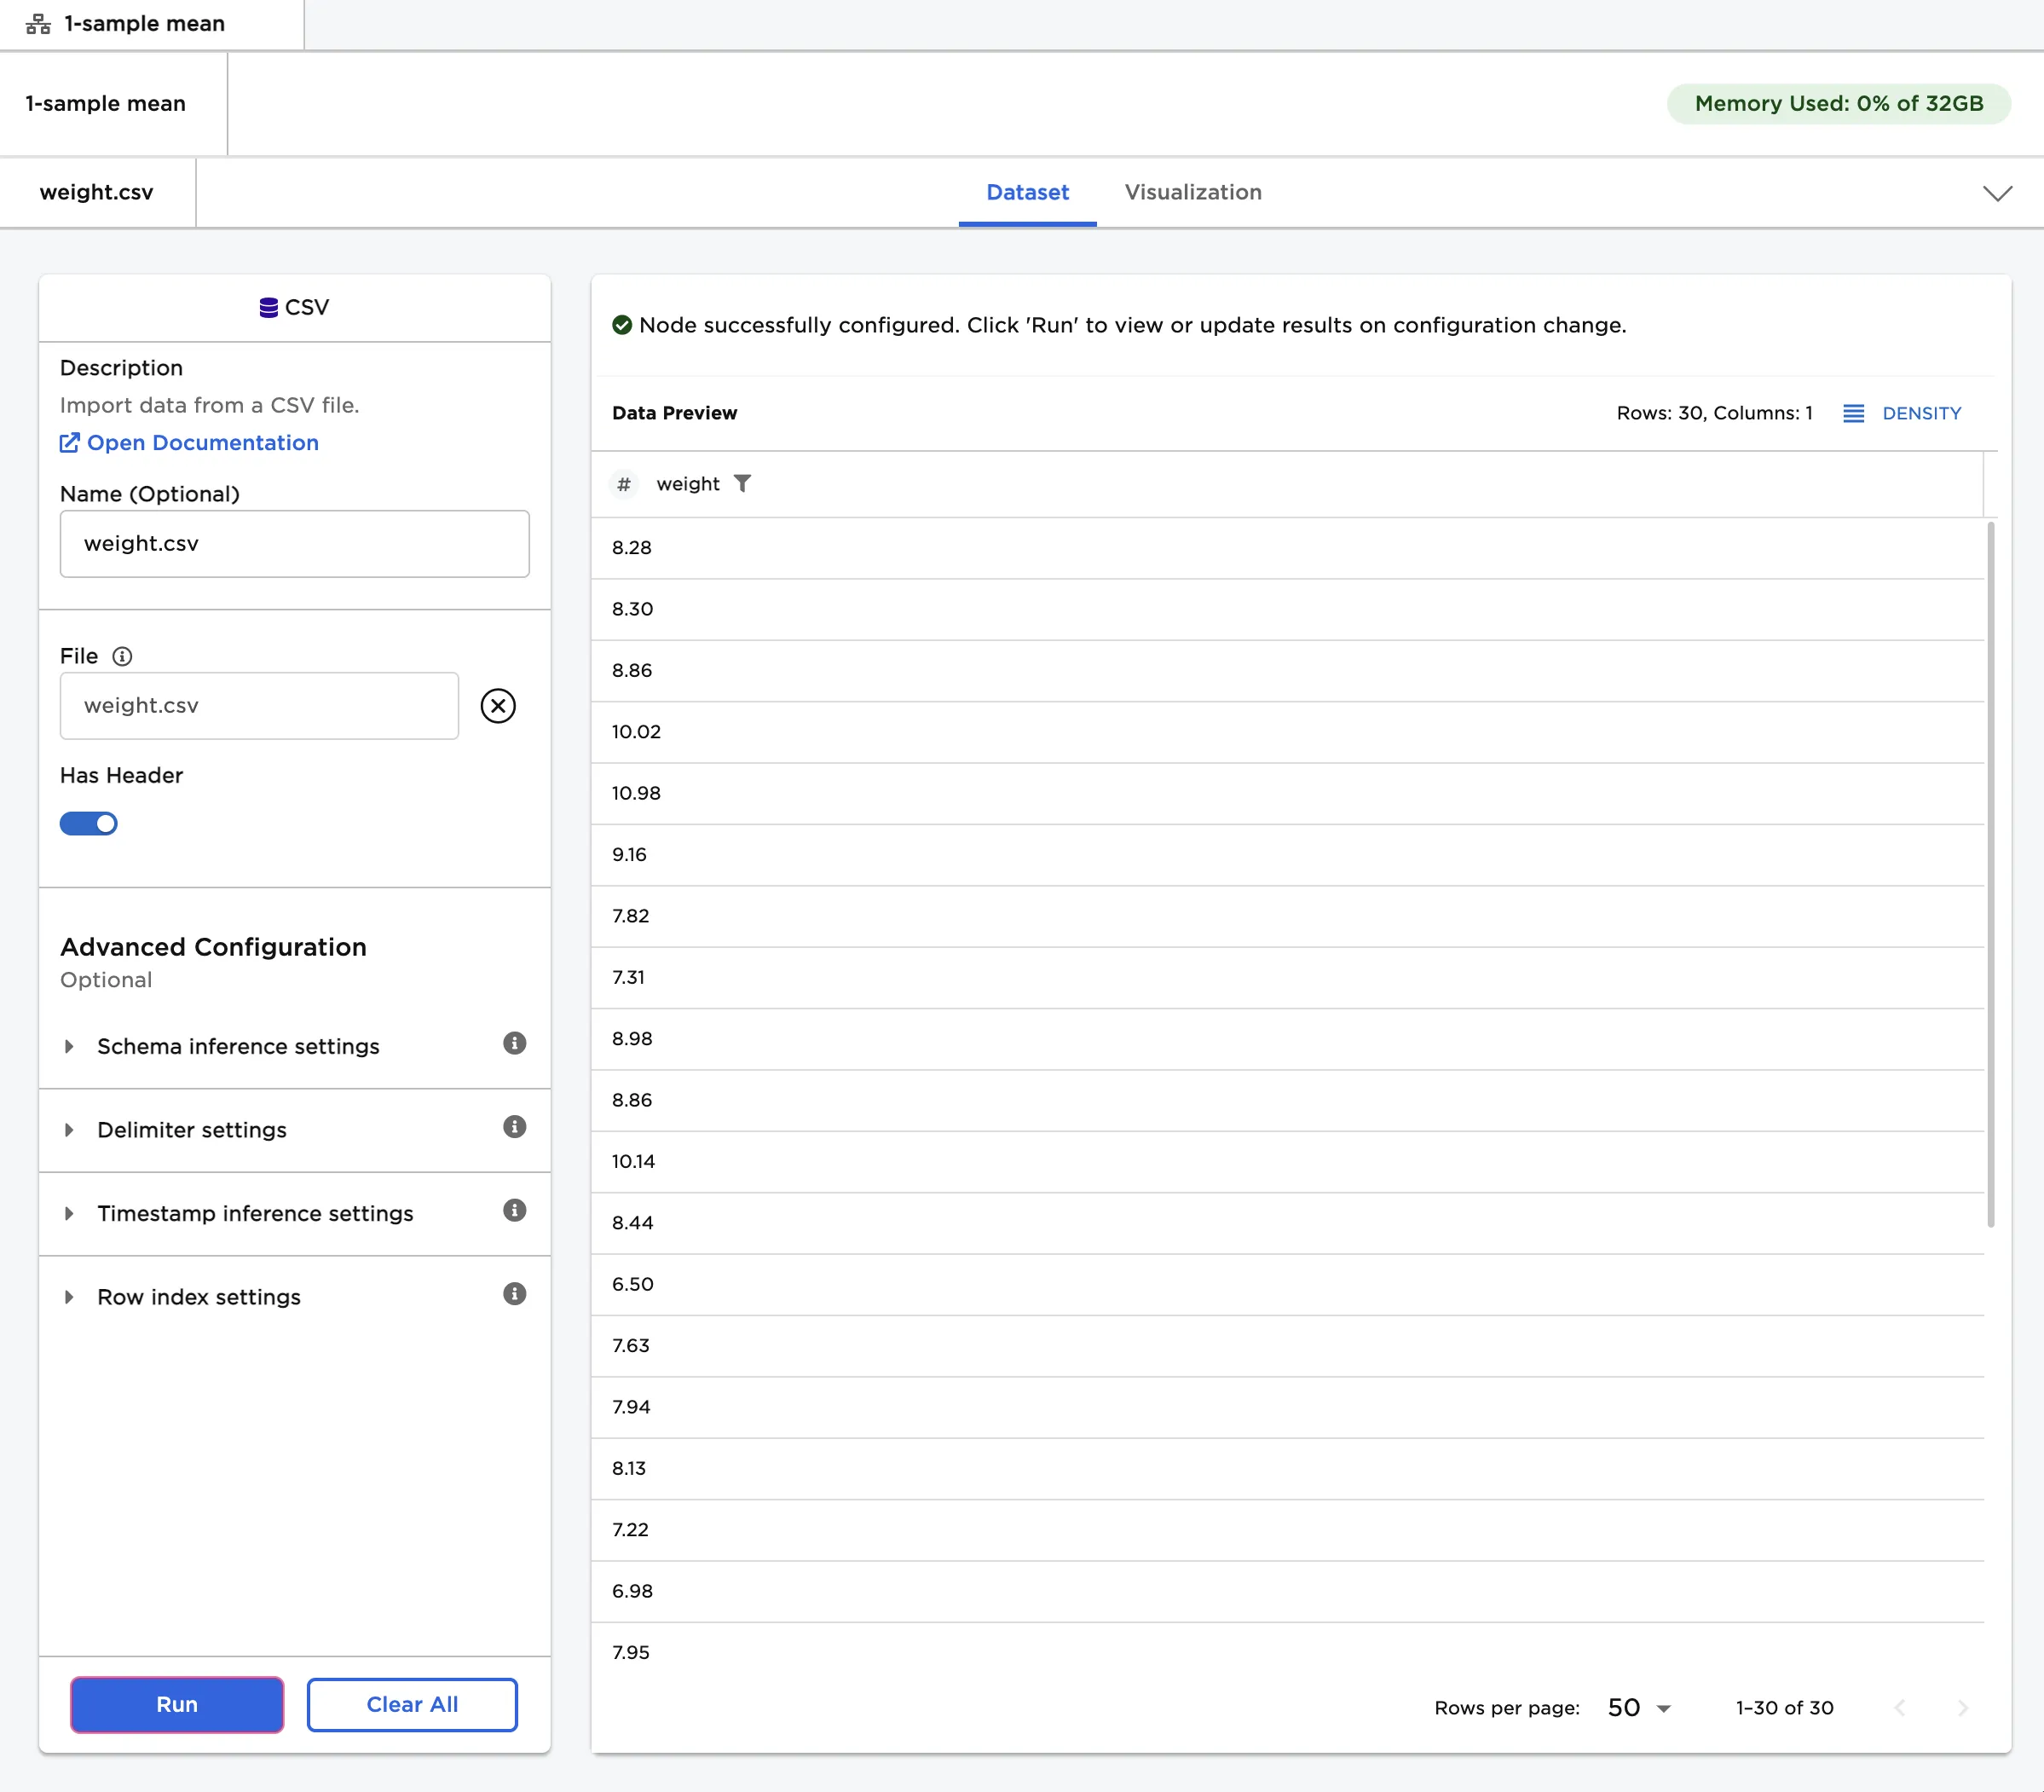
Figure 2: Example input
There are two related metrics used to test variability--standard deviation and variance. Both metrics measure how concentrated the data is. Standard deviation uses the same units as the data, which makes it easy to interpret. If your data is normally distributed, the majority of the data falls within one standard deviation of the mean (the average weight). If the standard deviation of the chips is 0.5, for example, most chip bags weigh between 7.5 oz and 8.5 oz.
Variance is the square of the standard deviation. If the standard deviation of the chips is 0.5 oz, for example, the variance is 0.25 square ounces. Variance is often used in advanced statistical calculations, but can be harder to interpret than standard deviation.
For this example, you suspect that the standard deviation of the chips is greater than 0.5. Given this use case, the following terminology is used in the rest of this example:
- "Population" is the immeasurable group of chip bags in the world.
- "Sample" is the small, hand-collected group of chip bags used for testing.
- The "null hypothesis" is the information you are disputing: the standard deviation of the chip population is 0.5.
- The "alternative hypothesis" is the theory you are proposing: the standard deviation of the chip population is greater than 0.5.
Follow the steps below to determine whether the standard deviation of the population is greater than 0.5.
- Connect a 1-Sample Variance node to an existing node. In this example, connect the 1-Sample Variance node to a CSV node that contains the sample data.
- Select the 1-Sample Variance node to configure it.
- Select weight (Double) for the Column field.
- Enter "0.5" for the Target value for Variance/Std Dev field.
- Select Run to perform a 1-sample standard deviation test with the default settings.
Notice that Visual Notebooks presents a page of results. At the top of the page is a single-sentence summary. In this case, the test determined that the true standard deviation of the population is greater than 0.5 with 95% confidence.
Figure 3: 1-sample standard deviation test with default settings
Since variation is closely related to standard deviation, you can run the test with a variance of 0.25 and get the same result.
- Select variance 𝜎² for the What is your preferred test metric? field.
- Enter "0.25" for the Target value for Variance/Std Dev field.
- Select Run to perform a 1-sample variance test.
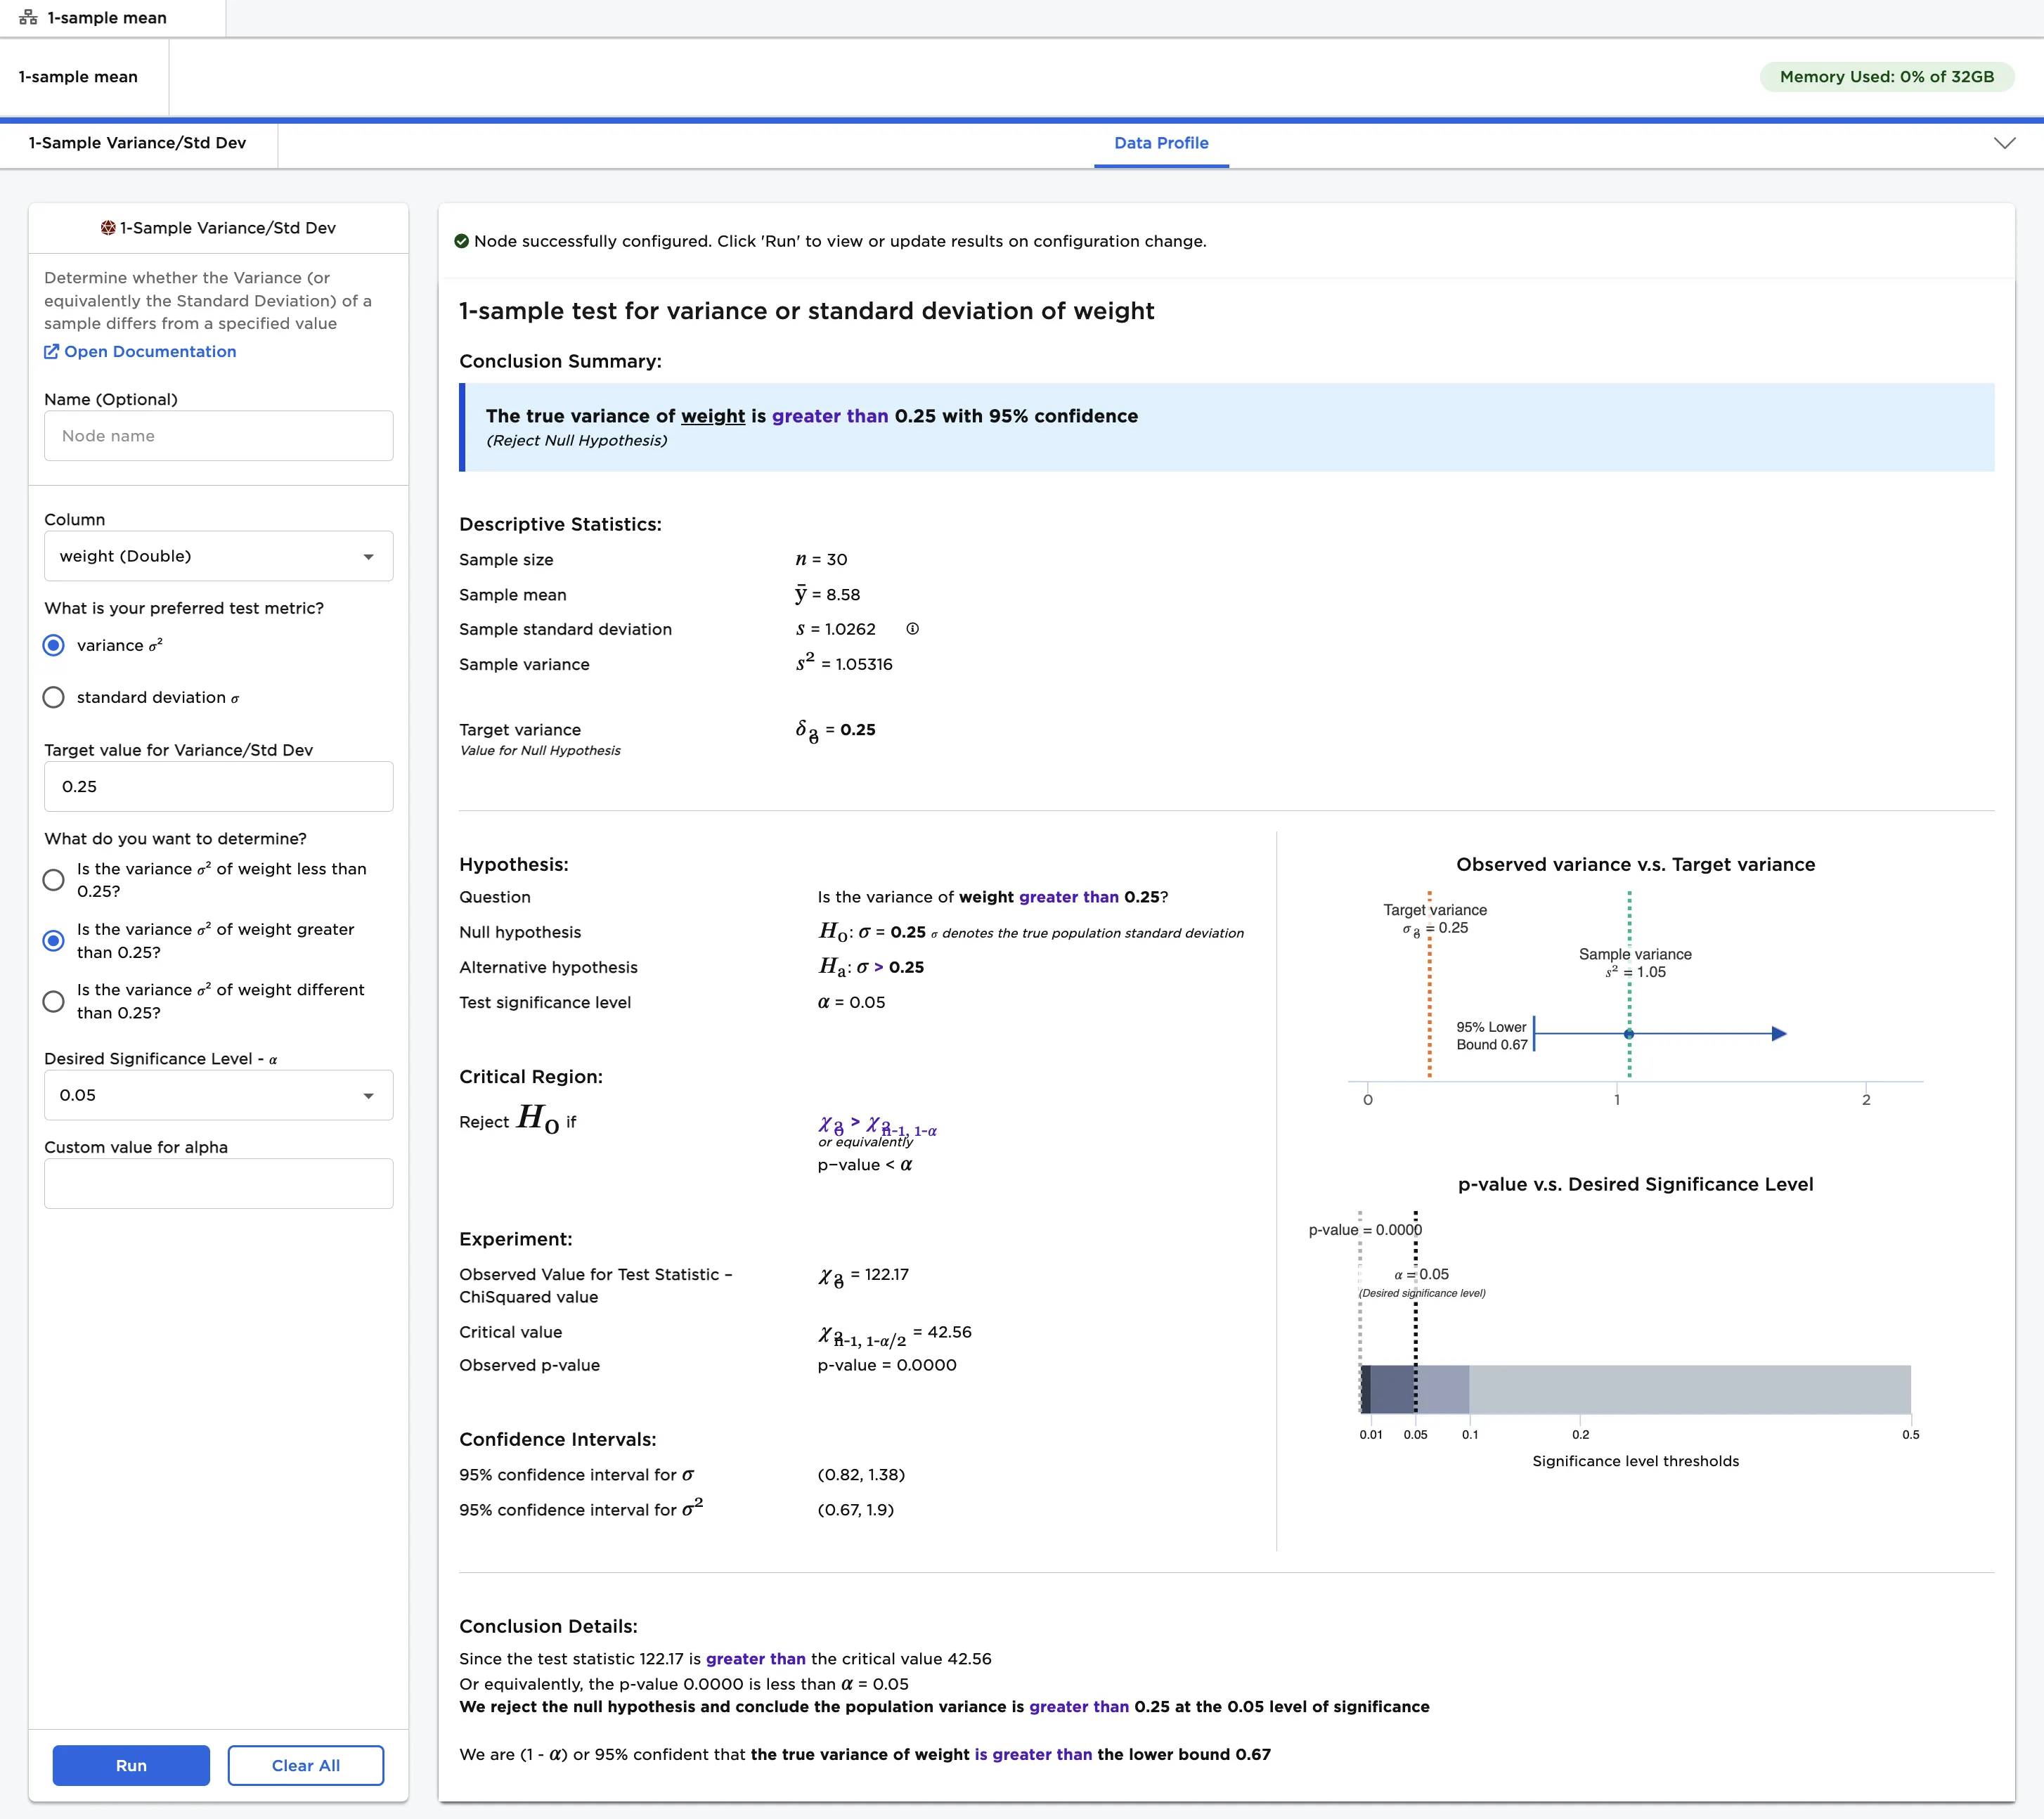
Figure 4: 1-sample variance test with default settings
The desired significance level, or alpha (𝛼), is the probability of making a false conclusion. A small alpha value allows you to make strong, well-tested claims. A large alpha value allows you to make more general, speculative conclusions. Alpha is used to calculate the confidence that the result of the test is accurate.
Follow the steps below to run a 1-sample standard deviation test with a large alpha value.
- Select standard deviation 𝜎 for the What is your preferred test metric? field.
- Enter "0.5" for the Target value for Variance/Std Dev field.
- Select Custom for the Desired Significance Level - 𝛼 field.
- Enter "0.5" for the Custom value for alpha field
- Select Run to perform a 1-sample standard deviation test with a custom alpha value.
As noted above, using a large alpha value results in more speculative predictions. Running the node with an alpha value of 0.5 suggests that the population standard deviation is actually greater than 0.95, but the confidence in that prediction is only 50%. When alpha was set to 0.05, Visual Notebooks determined that the population standard deviation was greater than 0.82 with 95% confidence.
Notice that alpha is related to the p-value. In this example, the p-value is the likelihood that the population standard deviation is still 0.5 even though the sample standard deviation is greater than 0.5. The p-value is zero, so you can assume that the population standard deviation is greater than 0.5. If the p-value is less than the specified alpha value, the test is deemed significant.
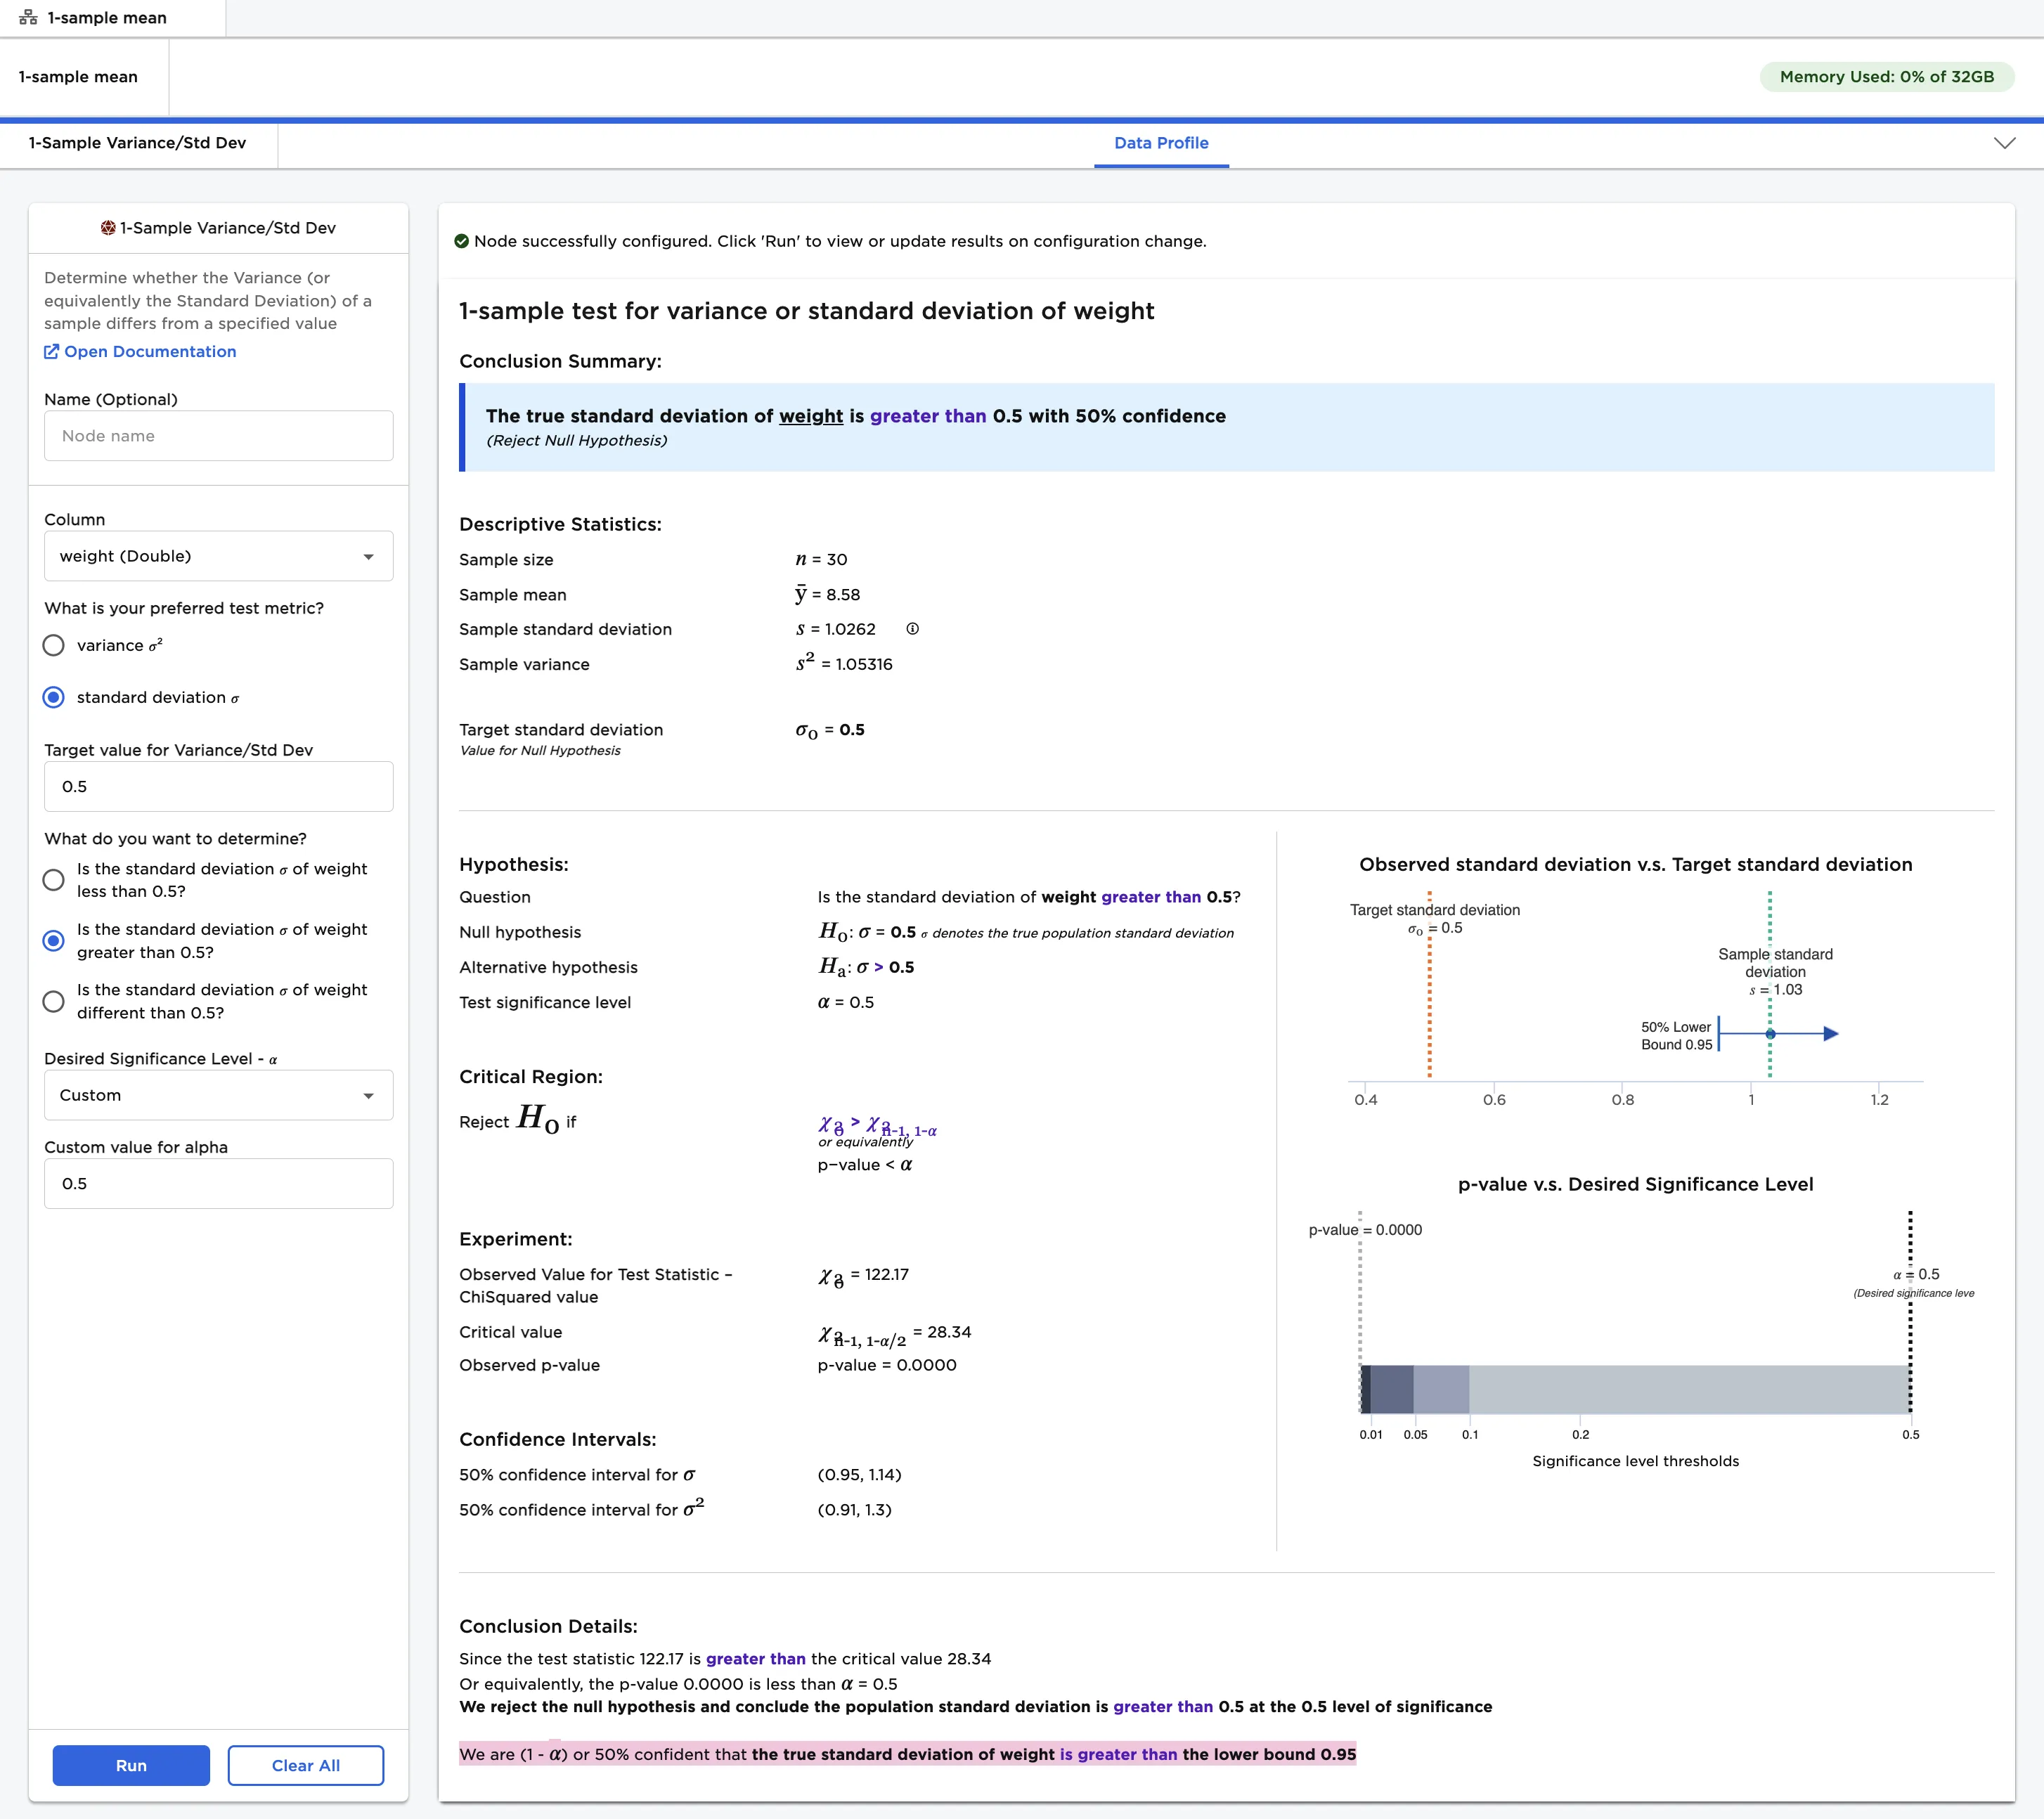
Figure 5: 1-sample standard deviation test with a custom alpha value
Since Is the standard deviation 𝜎 of weight greater than 0.5? was selected in previous examples, Visual Notebooks performed a 1-tailed test. A 1-tailed test determines whether the standard deviation or variance differs in one direction. Selecting Is the standard deviation 𝜎 of weight less than 0.5? would also perform a 1-tailed test.
For this example, select Is the standard deviation 𝜎 of weight different than 0.5? to perform a 2-tailed test. A 2-tailed test determines whether the standard deviation is different than 0.5 in either direction--greater than or less than. Instead of just outputting a minimum or maximum value for the population standard deviation, a 2-tailed test outputs a range of possible values.
- Select 0.05 for the Desired Significance Level - 𝛼 field.
- Change the What do you want to determine? field to Is the standard deviation 𝜎 of weight different than 0.5?.
- Select Run to perform a 2-tailed 1-sample standard deviation test.
Notice that the output looks very similar to the output for a 1-tailed test. Instead of only calculating a lower bound, Visual Notebooks calculates both a lower bound and an upper bound. The population standard deviation is between 0.82 and 1.38.
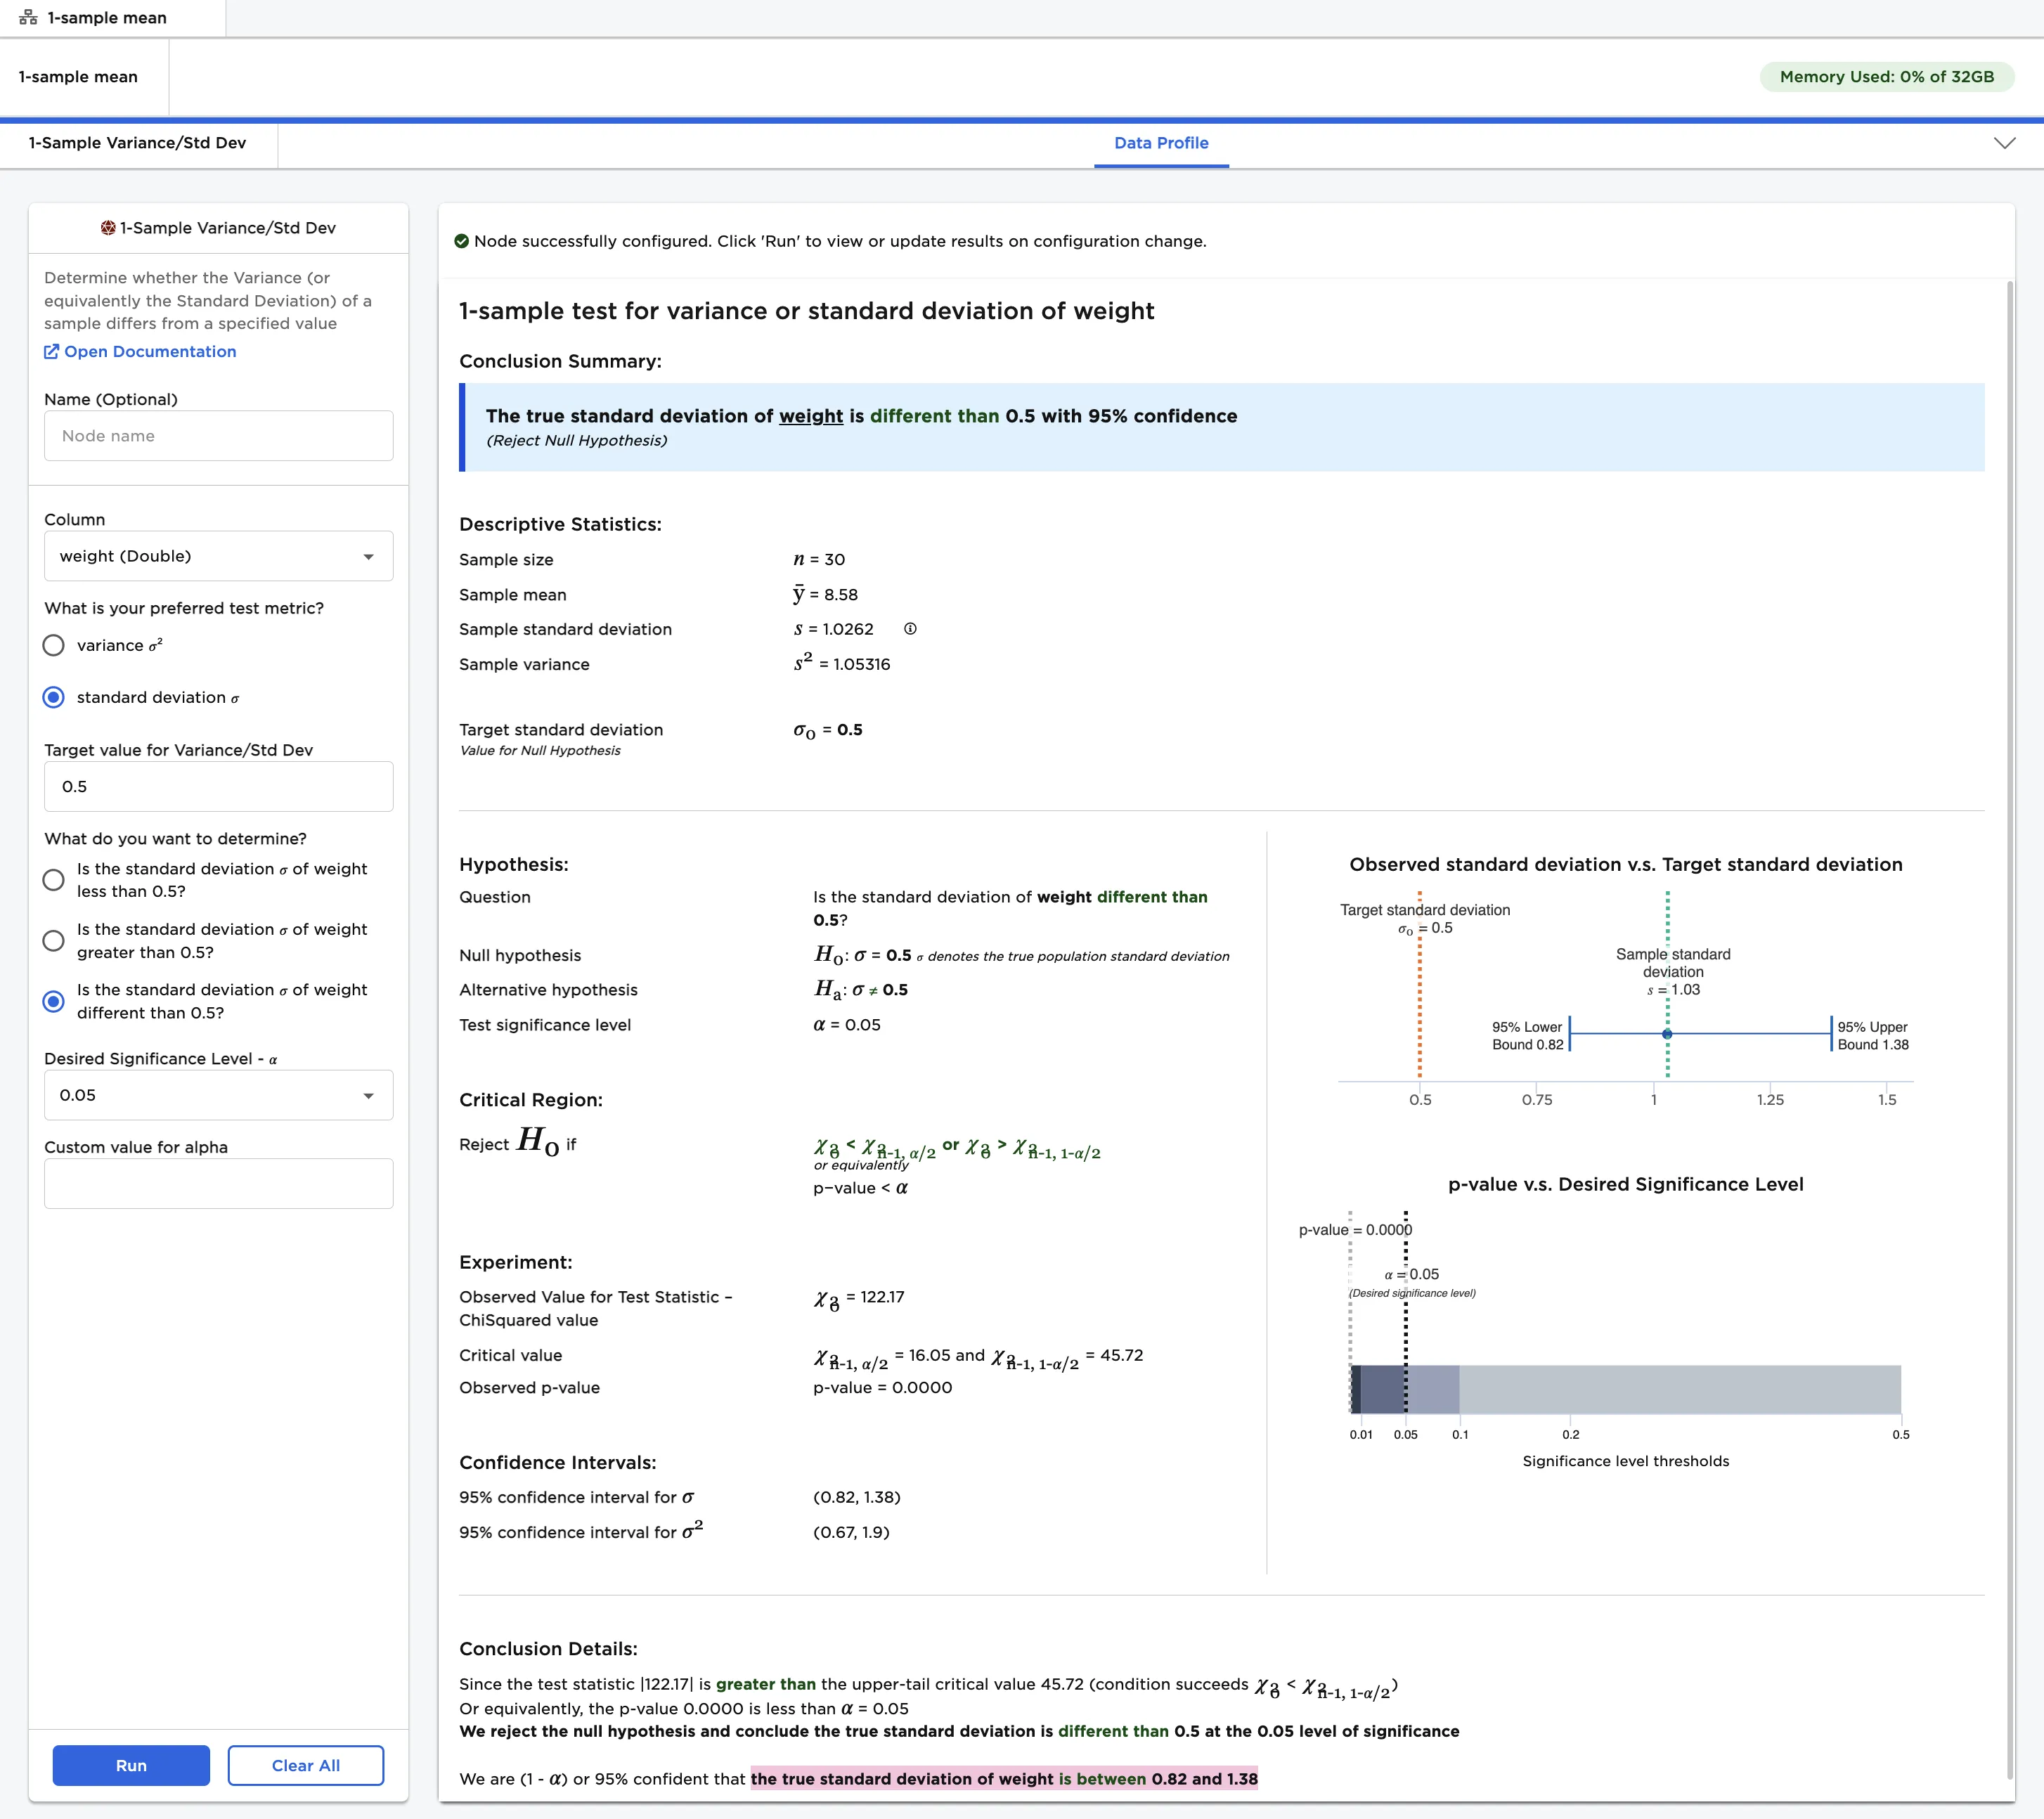
Figure 6: 2-tailed 1-sample standard deviation test