Appending Datasets in Visual Notebooks
Append one dataset to another dataset in Visual Notebooks.
Unlike the Join node, which merges two datasets together based on columns in common, the Append node stacks two datasets on top of each other.
Configuration
| Field | Description |
|---|---|
| Name (default=none) | Name of the node - A user-specified node name, displayed in the workspace and in the dataframe as a tab. |
Handling Non-matching Columns (default=Keep all columns) | How to append the two datasets - Select Keep all columns to keep columns from both datasets. Columns that are present in one dataset but not the other will be filled with empty values. Select Keep only matching columns to keep columns that have the same name and the same data type. Select Keep columns from first input to only keep the columns from the left dataset. Select Show error if input schemas do not perfectly match to check the input schema before appending the two datasets. Visual Notebooks will not run the node until both datasets contain the same column names and data types. |
Handle Row Duplicates (default=Keep all rows in all datasets) | Strategy for duplicate rows - Select Keep all rows in all datasets to keep all rows, even if they contain duplicates. Select Keep one row of duplicate rows to keep one of each duplicate value. To be considered a duplicate value, all columns must match. Select Keep one row of duplicate rows based on selected columns to remove rows that contain duplicates only in the selected column or columns. |
Add new column to indicate which dataset each row came from (default=Off) | Column with source dataset - Select the checkbox to add a new column to the dataframe that indicates which dataset each row came from. Selecting this field displays the Define Source Column Name, Source, and Define Source Column Position fields. |
Define Source Column Name (default=Default) | Name of source column - Select Default to create an additional source column with the name "Source." Select Custom to enter a custom name for the source column. |
| Source (default=none) | Custom name for source column - If Custom is selected for the Define Source Column Name field, enter a custom name for the source column. Column names can contain alphanumeric characters and underscores, but cannot contain spaces. |
Define Source Column Position (default=Add as first column) | Source column position - Select Add as first column to place the new column at the beginning of the dataframe. Select Add as last column to place the new column at the end of the dataframe. |
| Add sort step (default=none) | Sorting options - Select Add sort step to reveal the Sort By field. Select a column to sort by from the dropdown menu. Select the arrow icon to the right of the field to determine whether values are sorted in increasing or decreasing order. |
First Dataset Name (default=Left) | Name of left dataset - If Add new column to indicate which dataset each row came from is selected, enter a custom name for the first dataset. |
Second Dataset Name (default=Right) | Name of right dataset - If Add new column to indicate which dataset each row came from is selected, enter a custom name for the second dataset. |
Node Inputs/Outputs
| Input | Two Visual Notebooks dataframes |
|---|---|
| Output | One combined dataframe |
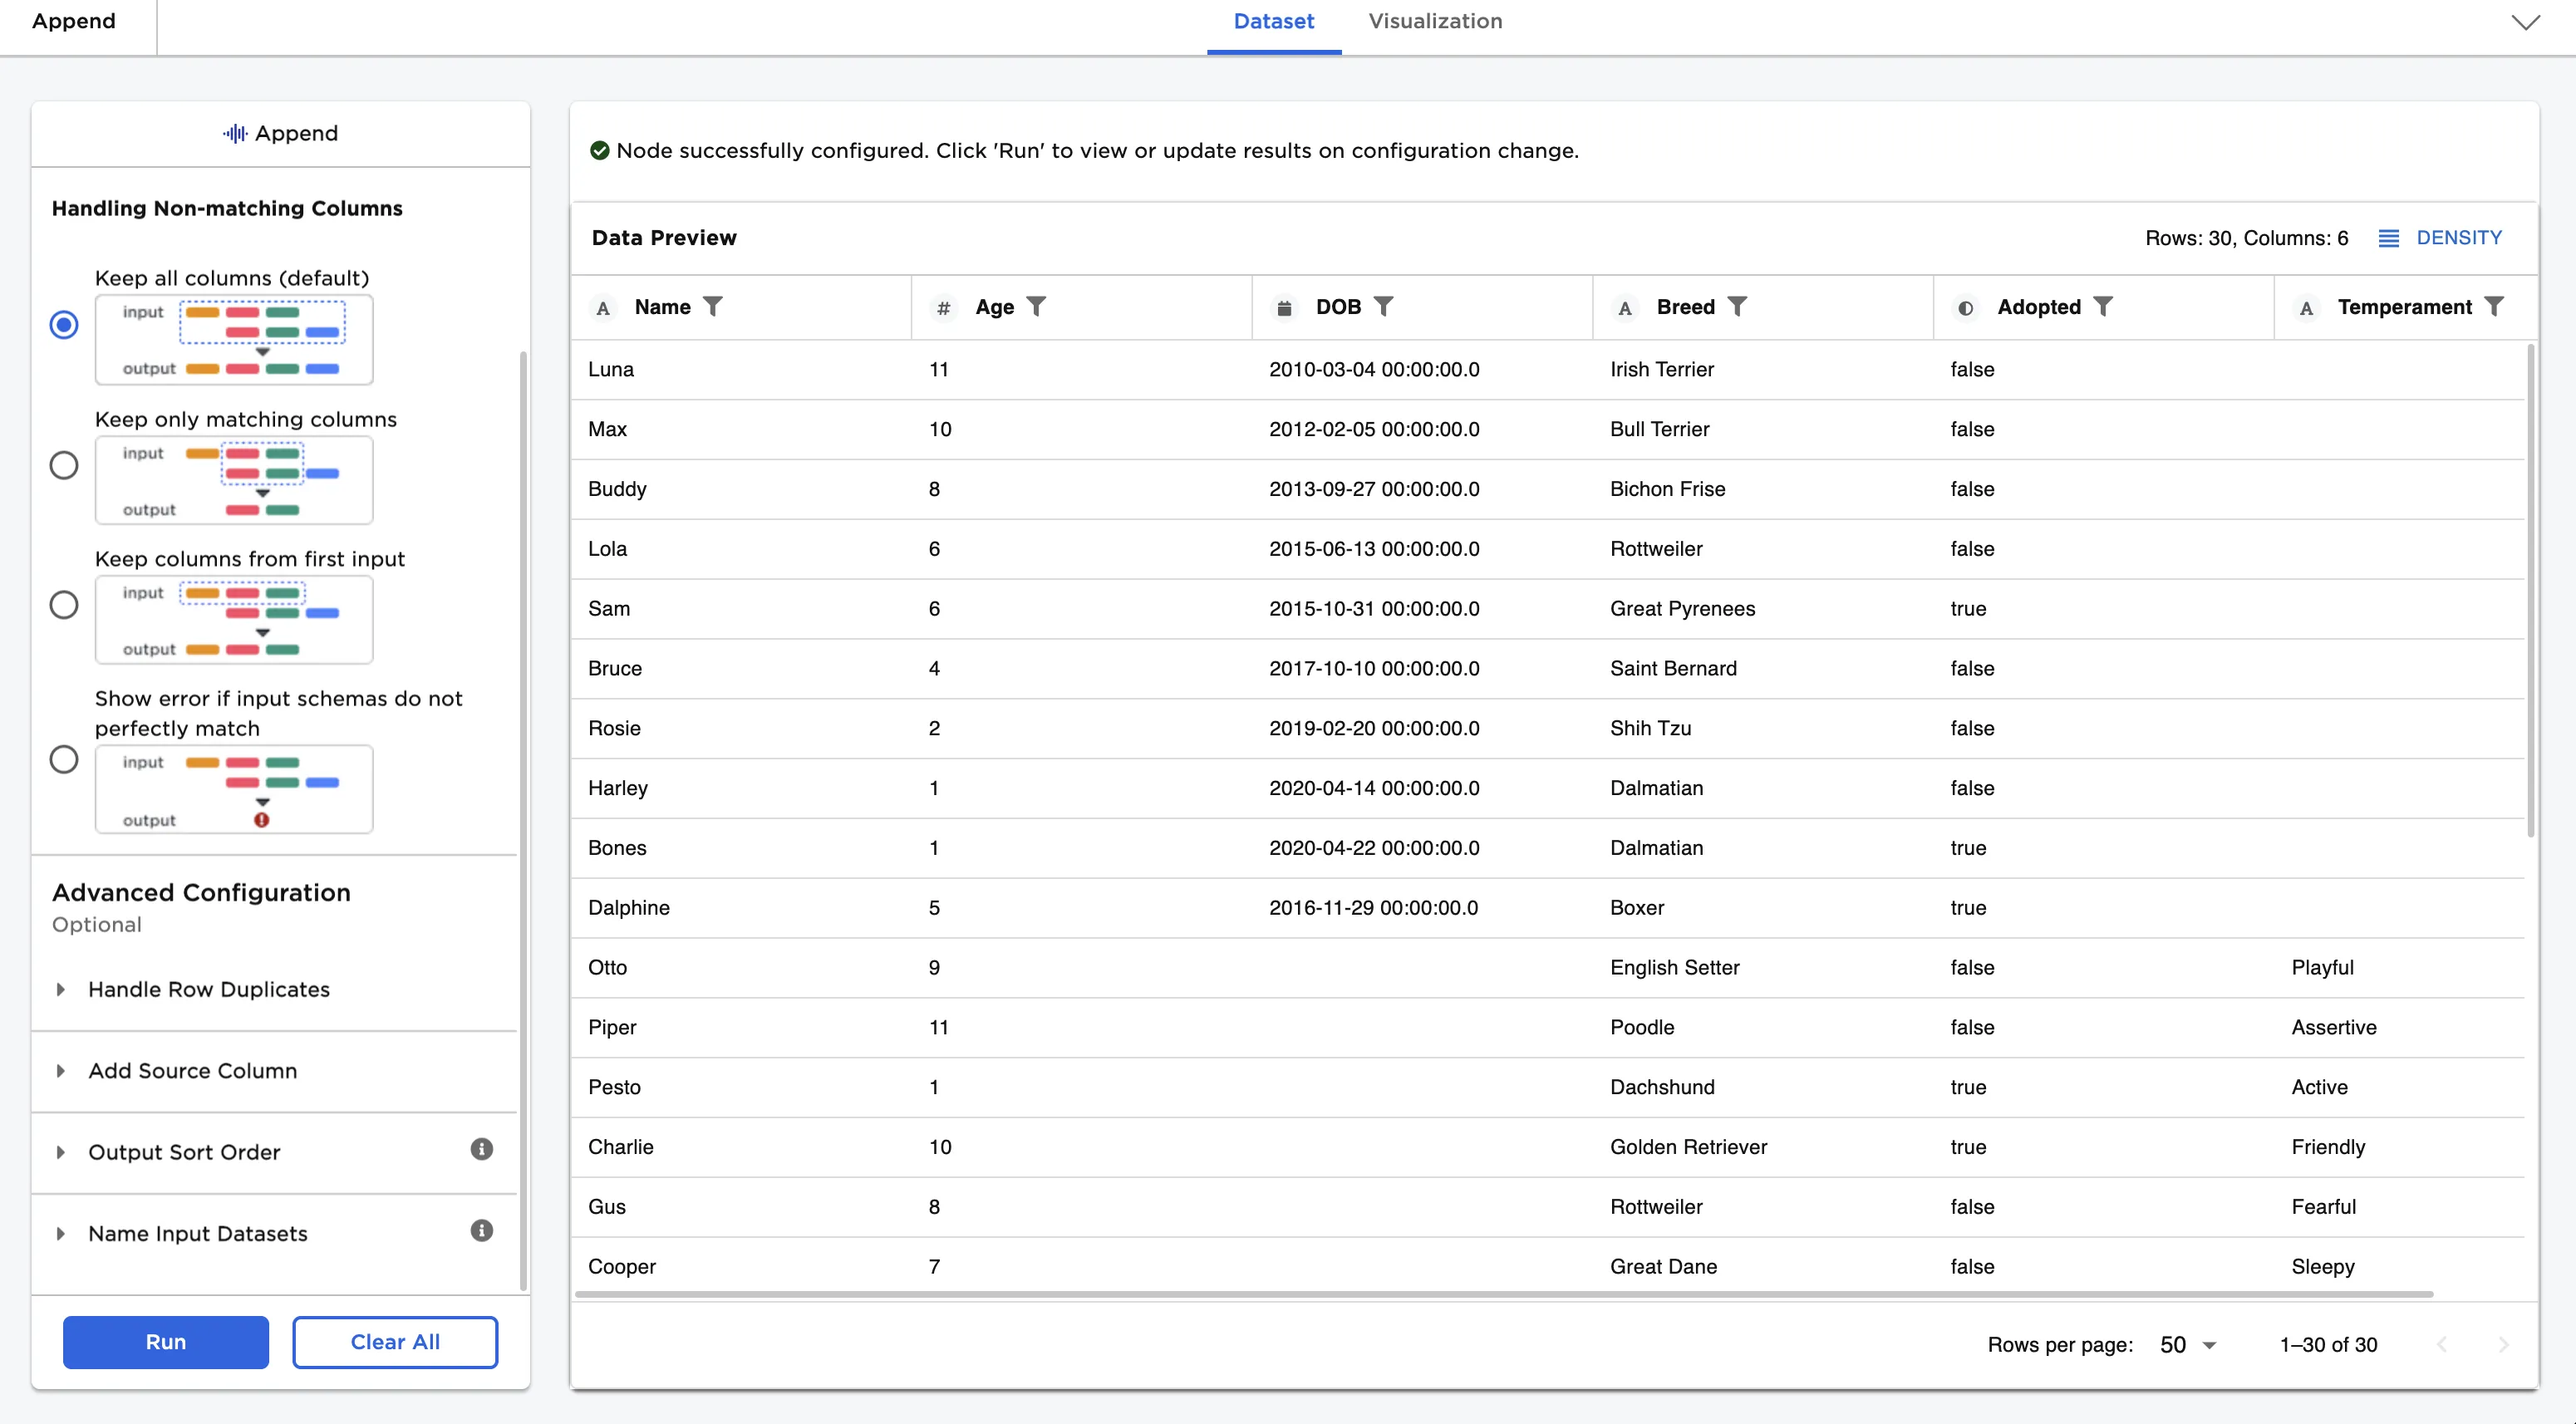
Figure 1: Example output
Examples
The Append node requires two input datasets. For this example, the first dataset contains records from a dog adoption agency called "Happy Dogs." The dataset includes each dog's name, age, breed, date of birth, and adoption status.
The example data is available in the Visual Notebooks sample datasets.
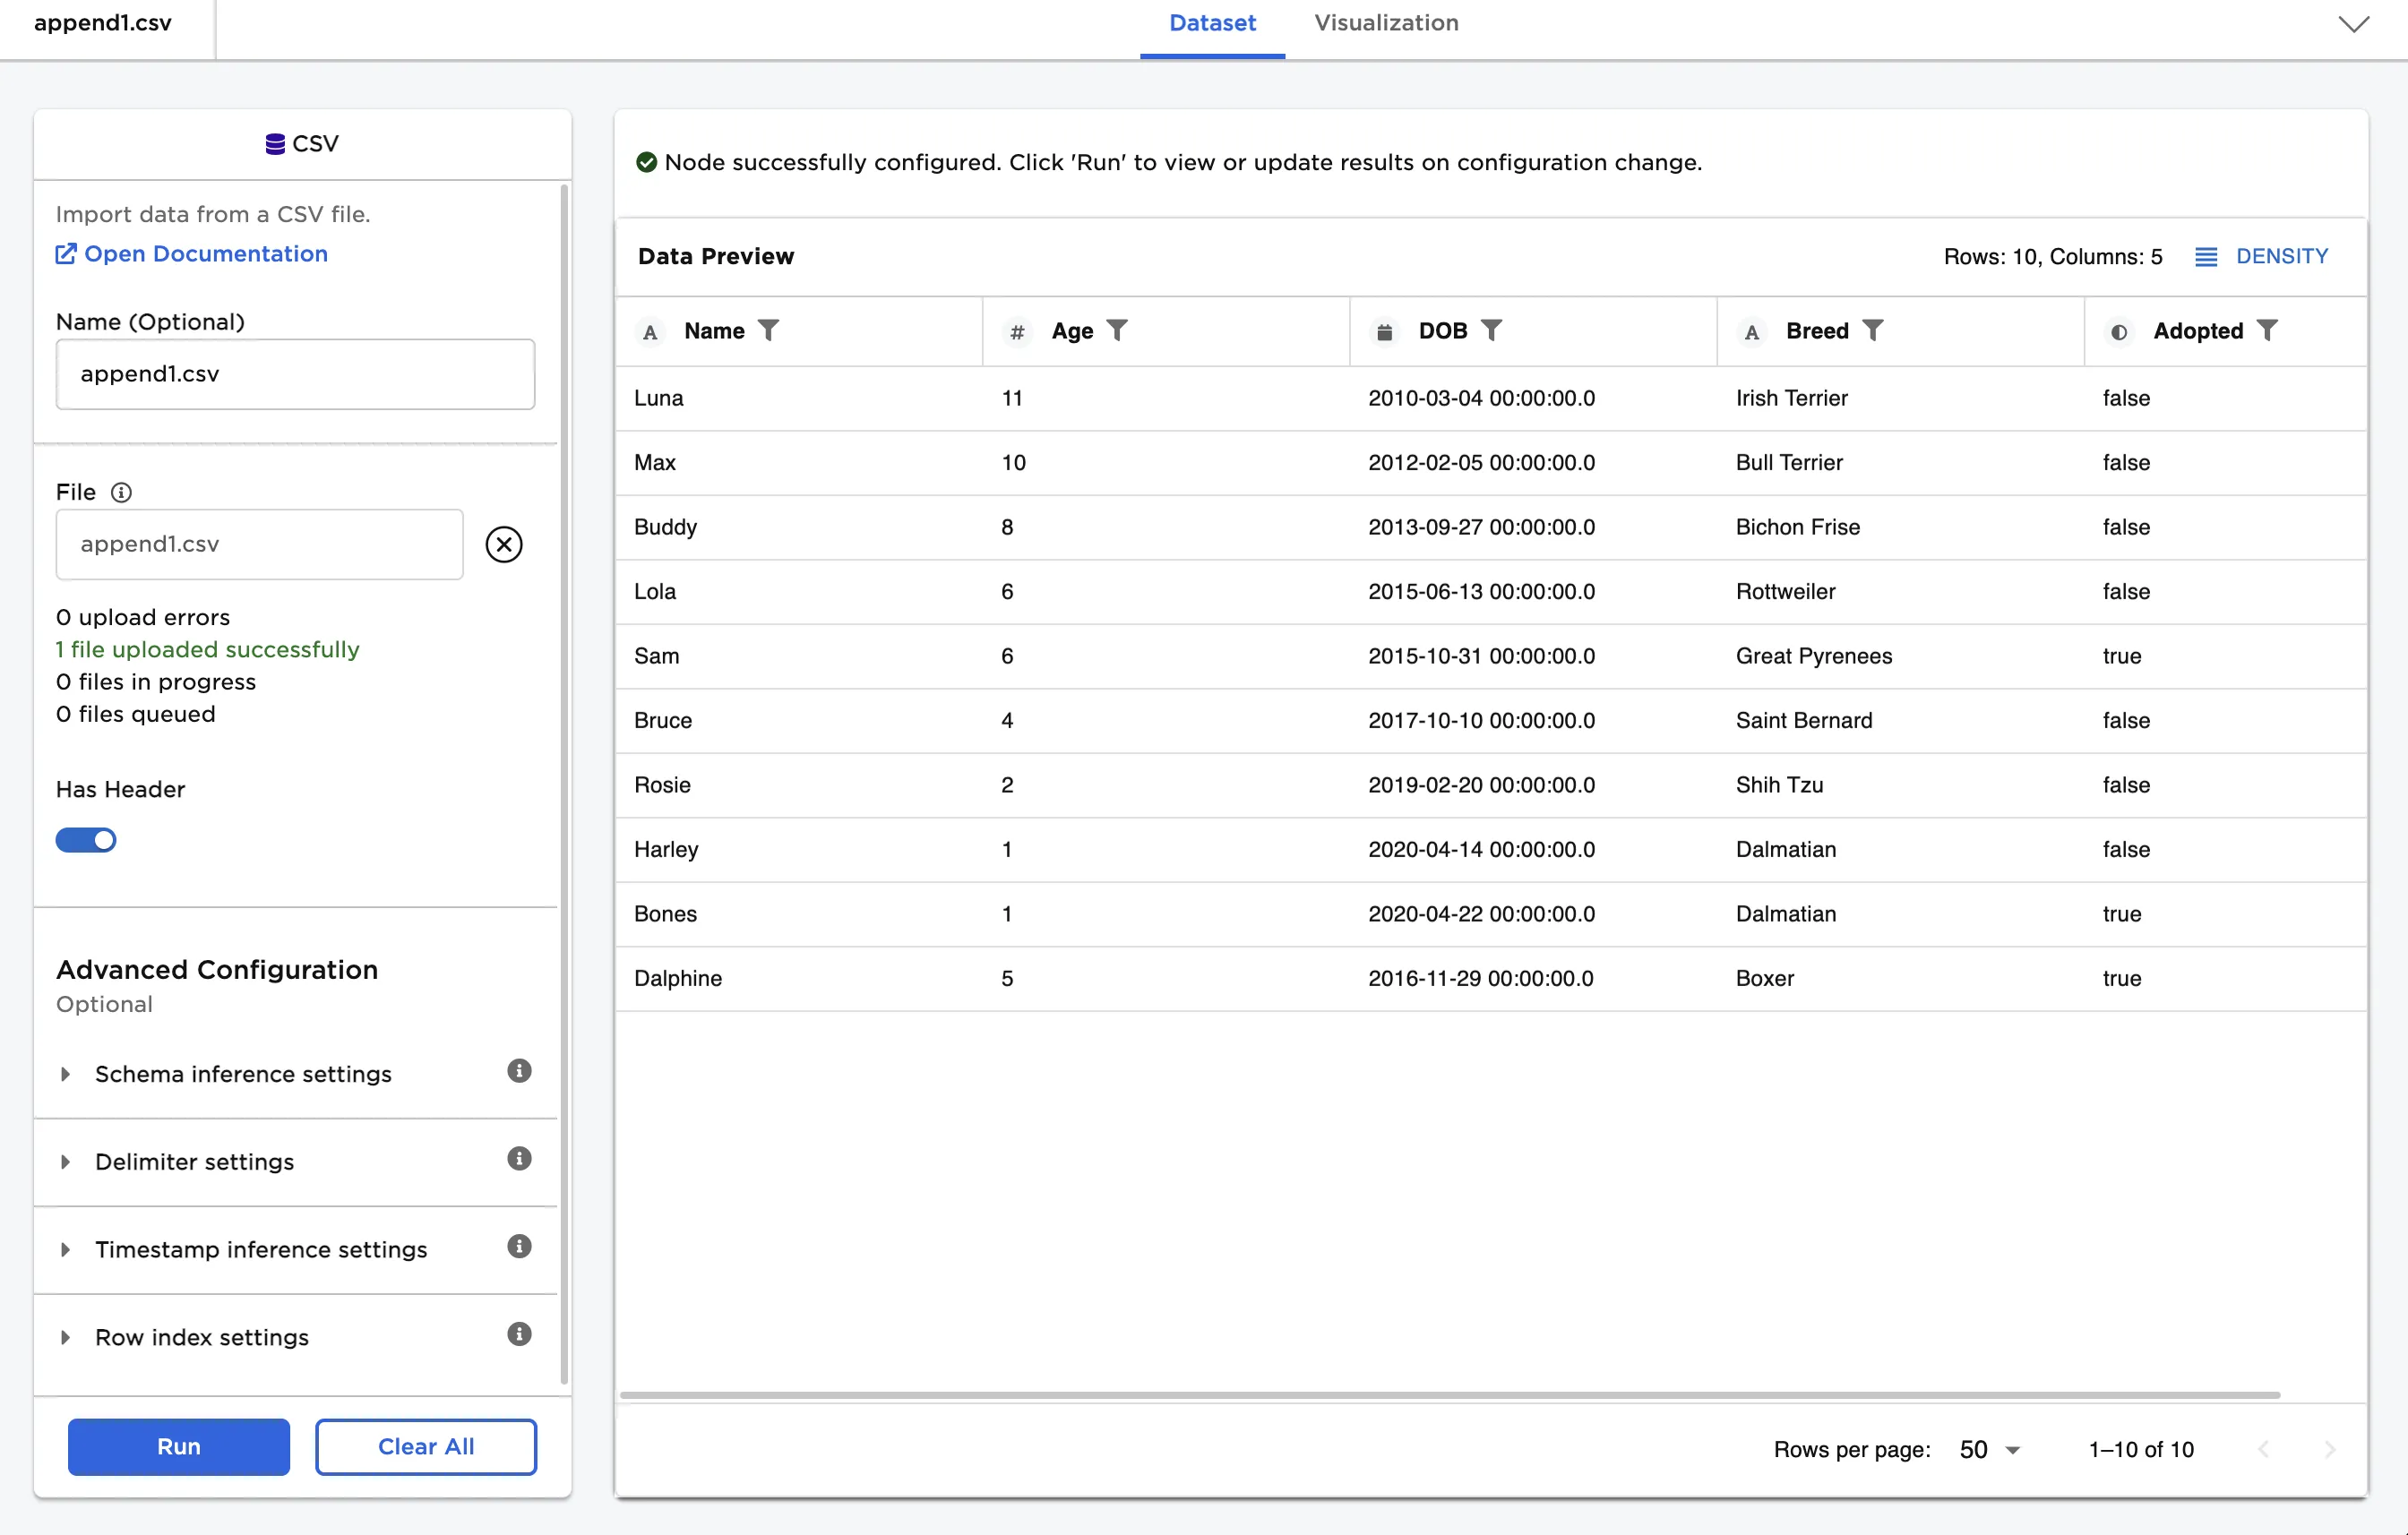
Figure 2: Example input data
The second dataset contains records from a different dog adoption agency called "Tails & Treats." The dataset includes each dog's name, age, breed, temperament, and adoption status.
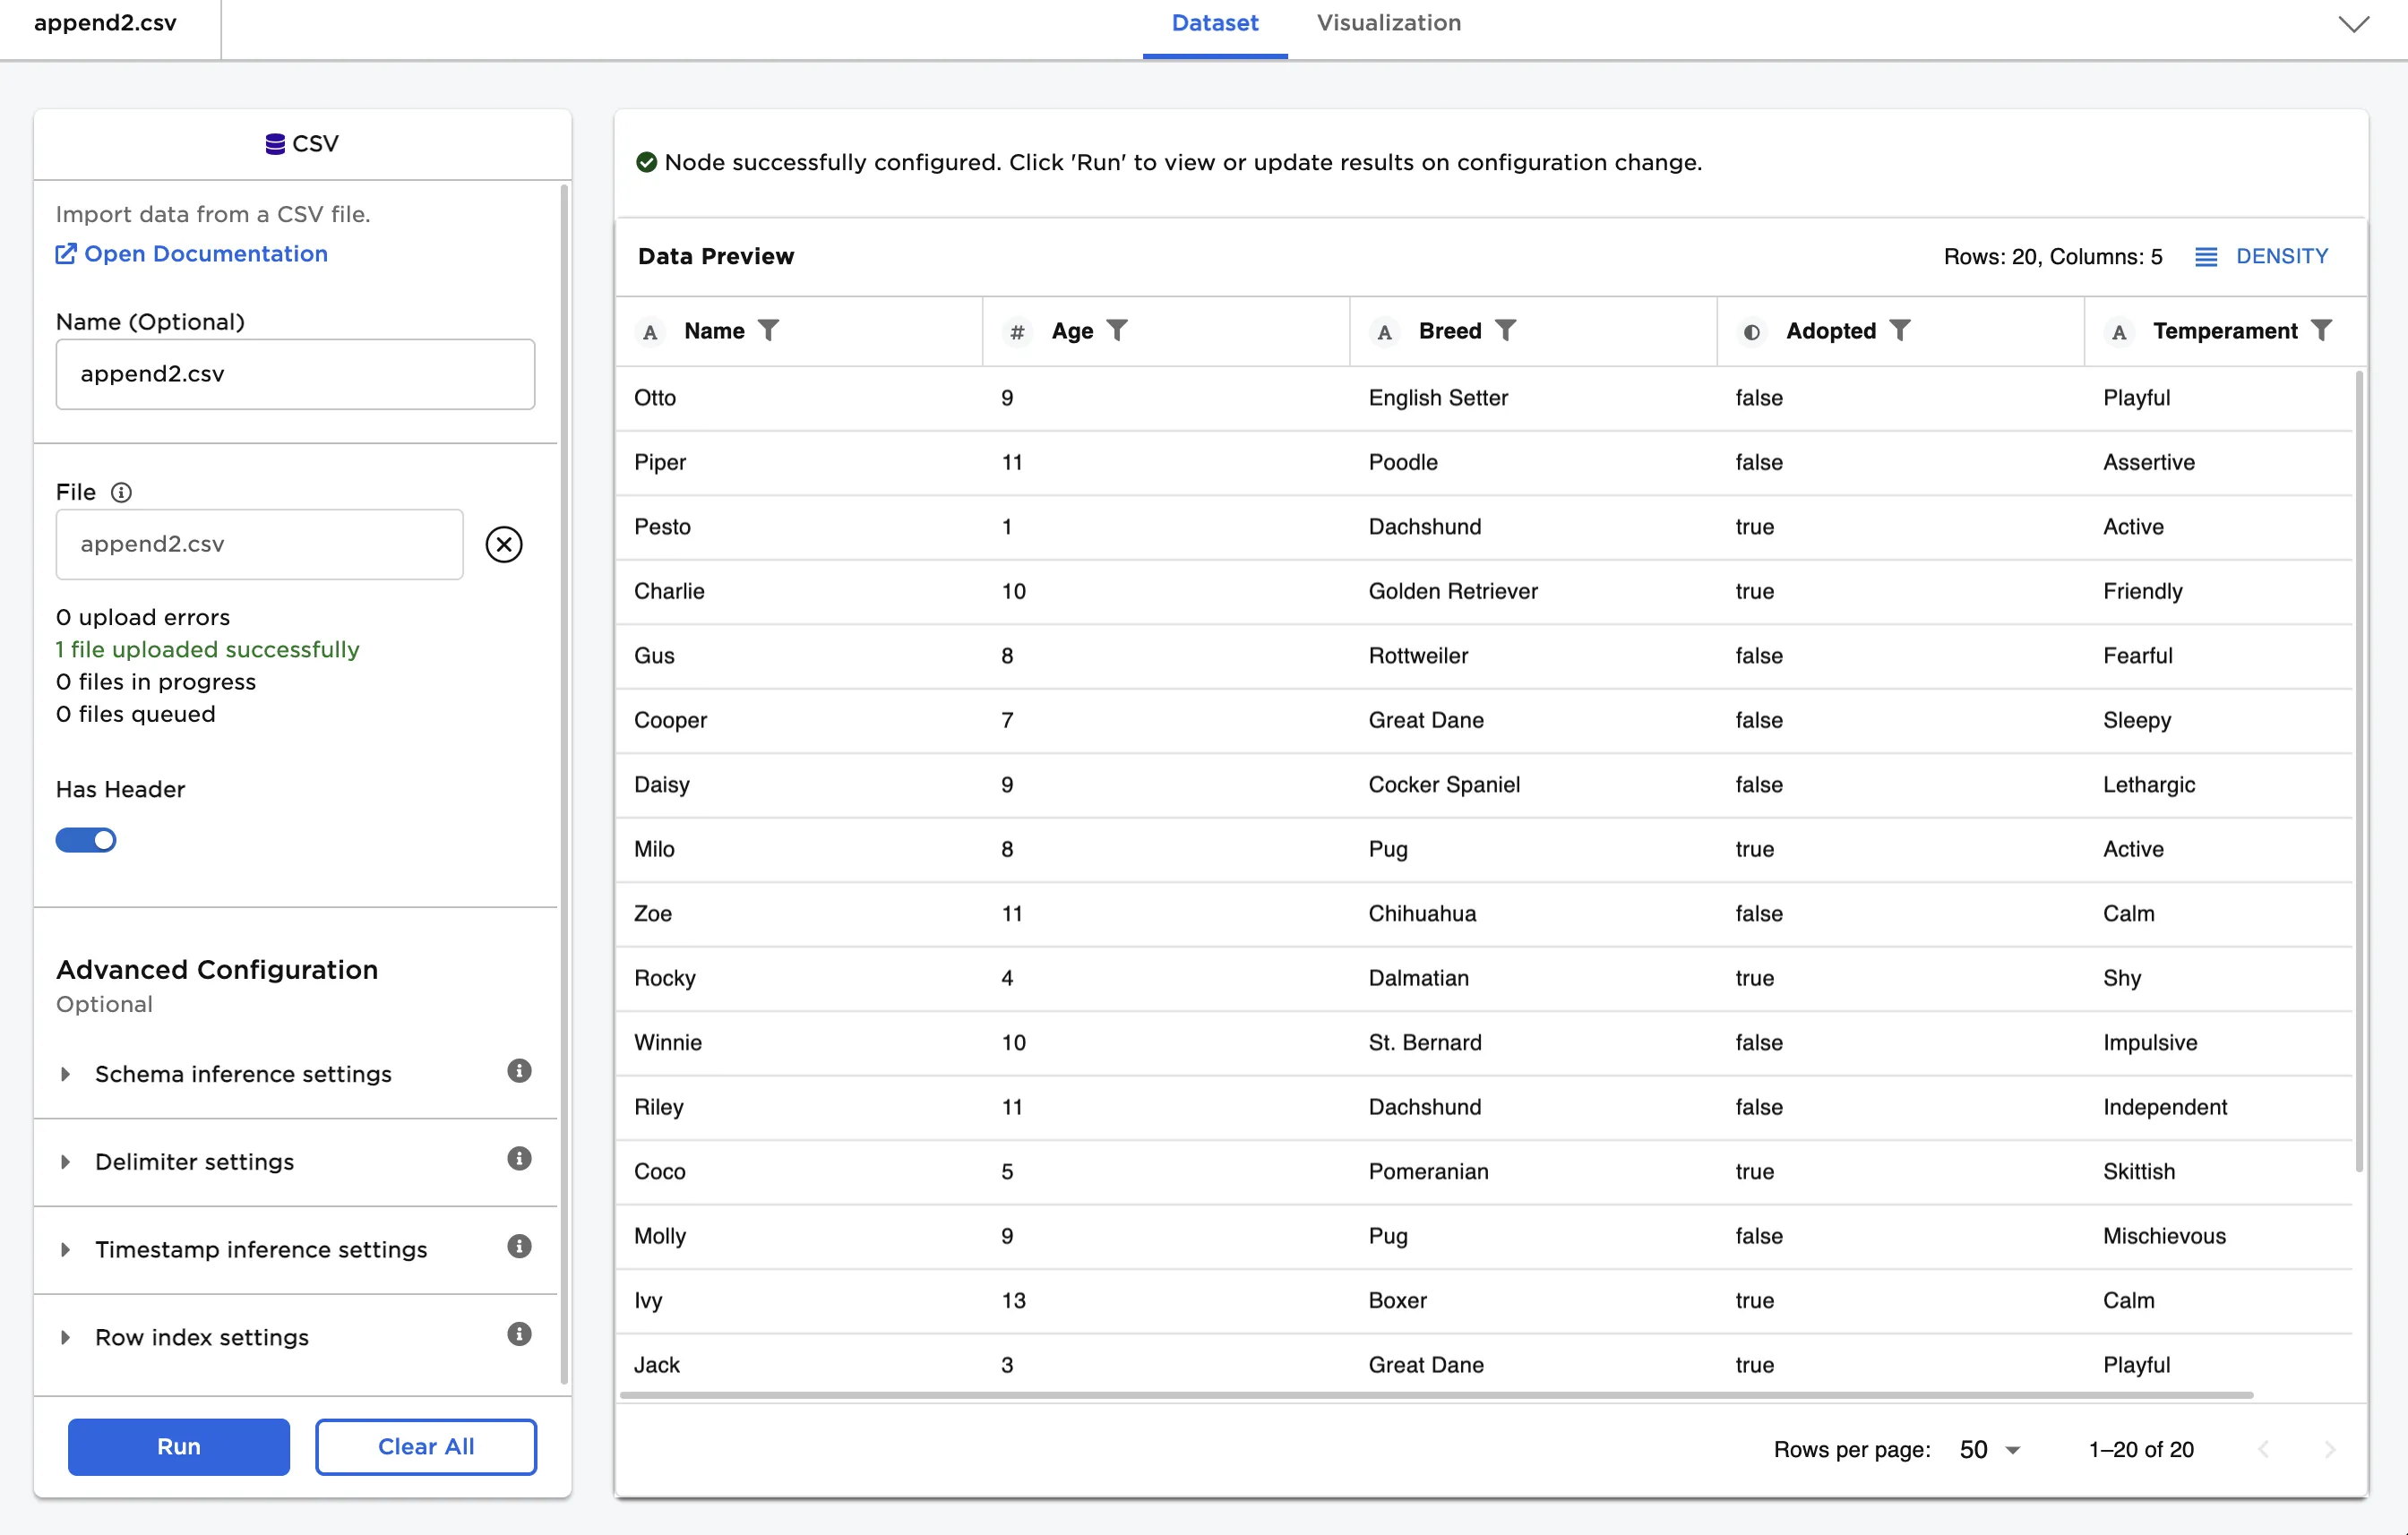
Figure 3: Example input data
Imagine these two dog adoption agencies merge to create one entity. Use the Append node to combine the data from both agencies.
- Connect an Append node to two existing nodes. In the example, connect a CSV node with the first dataset to the left dataset connector of the Append node. Connect a CSV node with the second dataset to the right dataset connector of the Append node.
- Select Run to run the node with the default settings.
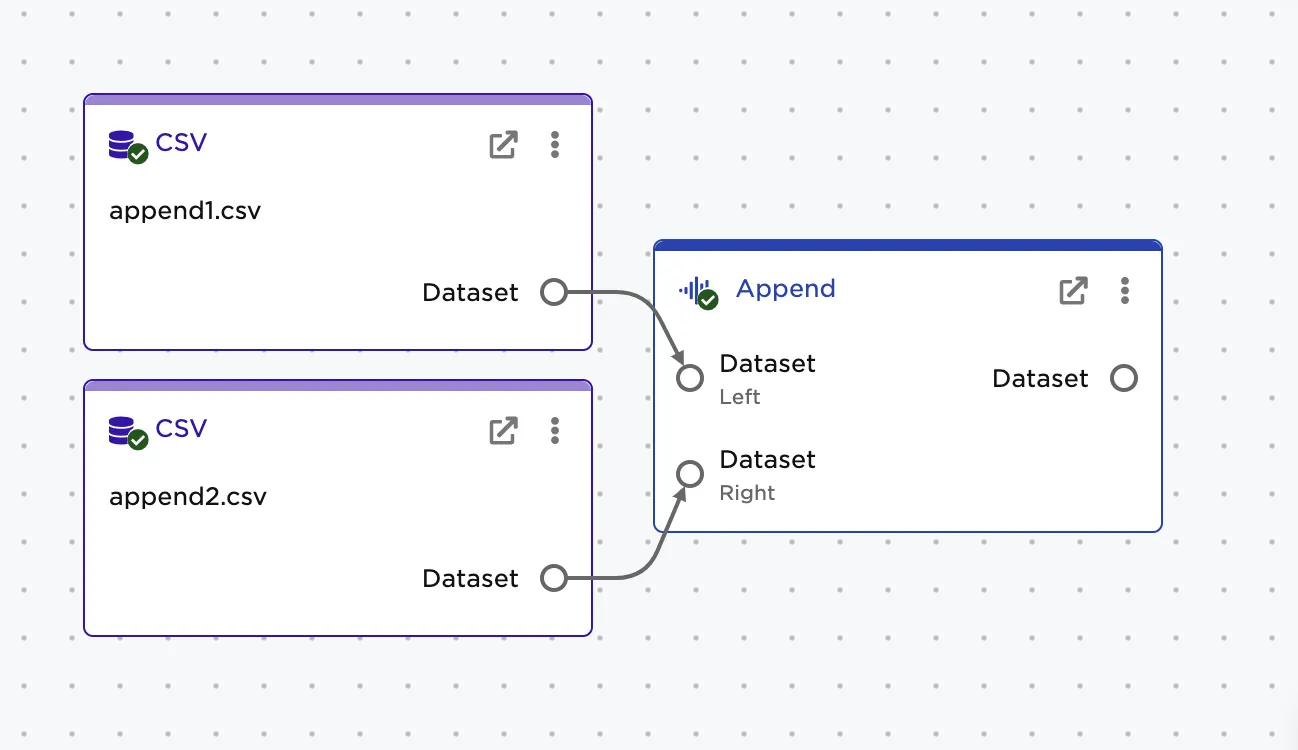
Figure 4: Example workspace
Notice that the "DOB" column and "Temperament" columns that were only present in one of the original datasets are included in the resulting dataframe. Rows that didn't originally contain these columns have empty values for these columns.
Figure 5: Example dataframe with default settings
Perhaps the combined dog adoption agency only wants to track the columns in common--name, age, breed, and adoption status--going forward. Follow the steps below to create a dataframe with only matching columns.
- Select Keep only matching columns for the Handling Non-matching Columns field.
- Select Run.
Notice that only the columns the two datasets had in common exist in the resulting dataframe. Columns must have the same name and data type to be considered matching.
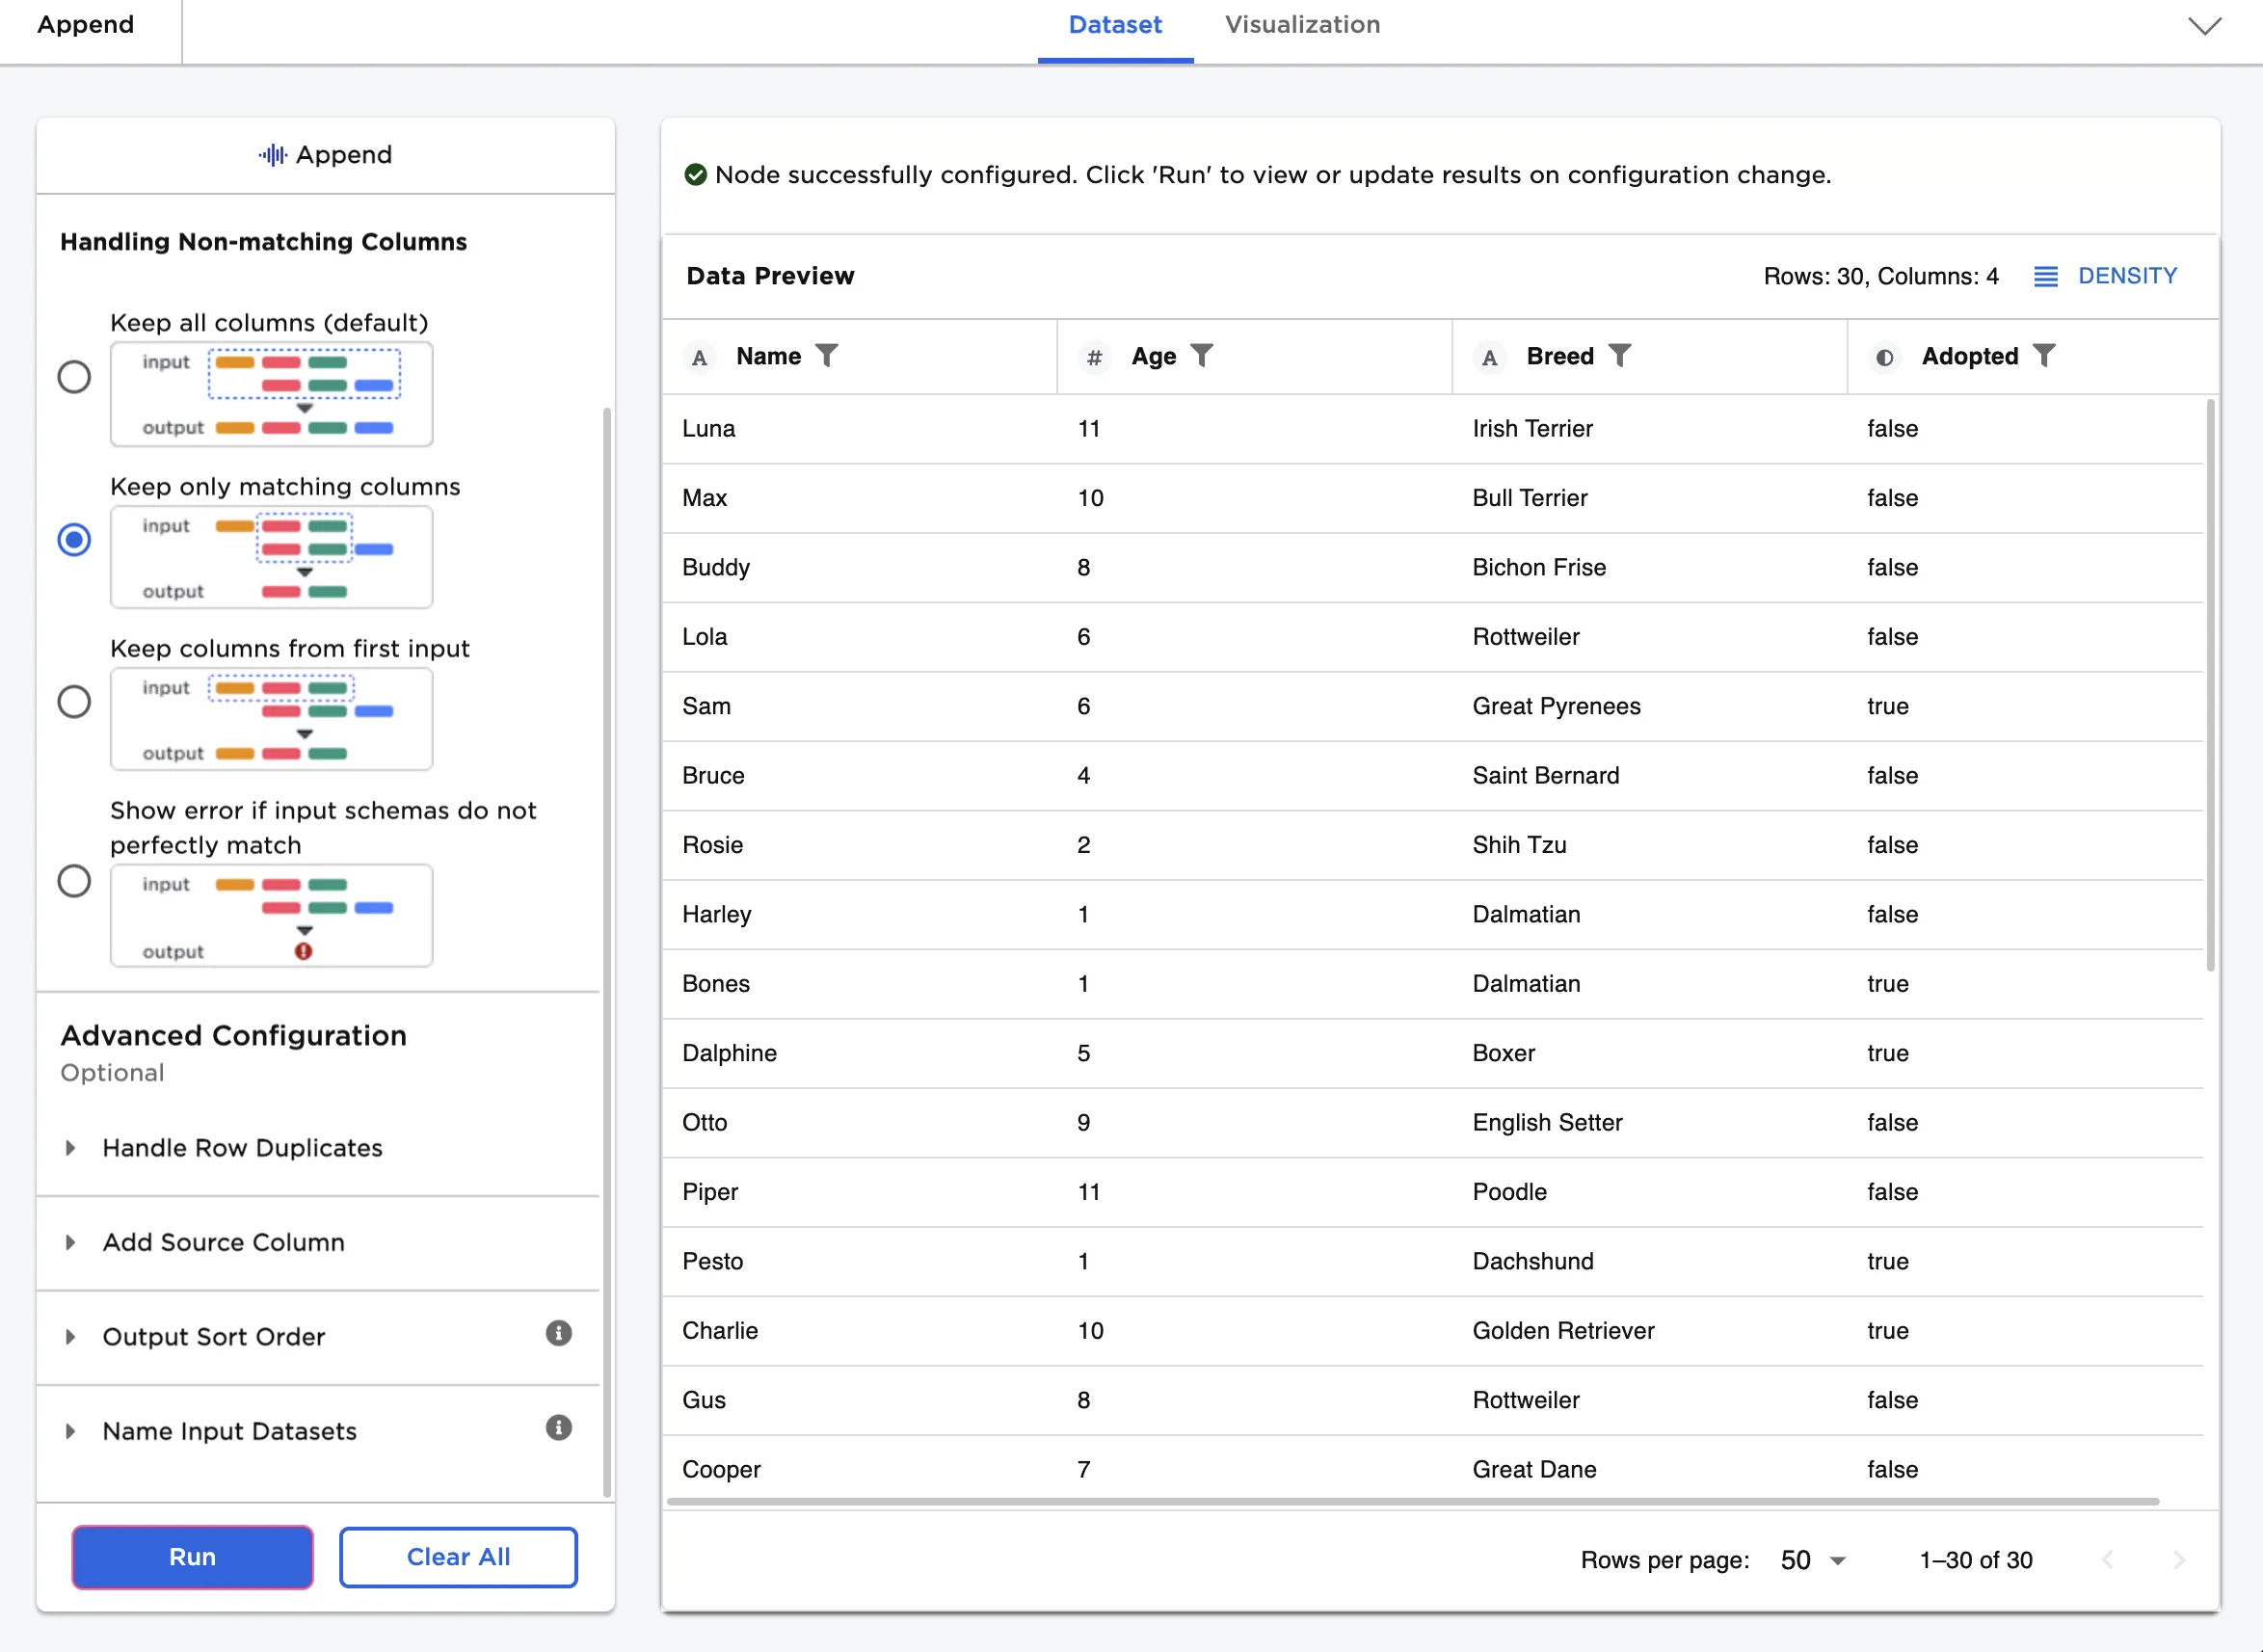
Figure 6: Example dataframe with only matching columns
When combining two different datasets, it is sometimes useful to track which dataset each record originated from. Follow the steps below to add a column with each dog's original adoption agency.
- Select the checkbox for the Add new column to indicate which dataset each row came from field.
- Select Custom for the Define Source Column Name field.
- Enter "Agency" for the Source field.
- Enter "Happy Dogs" for the First Dataset Name field.
- Enter "Tails & Treats" for the Second Dataset Name field.
- Select Run.
Notice that an additional column has been added called "Agency" that contains the name of the agency the dog originally came from.
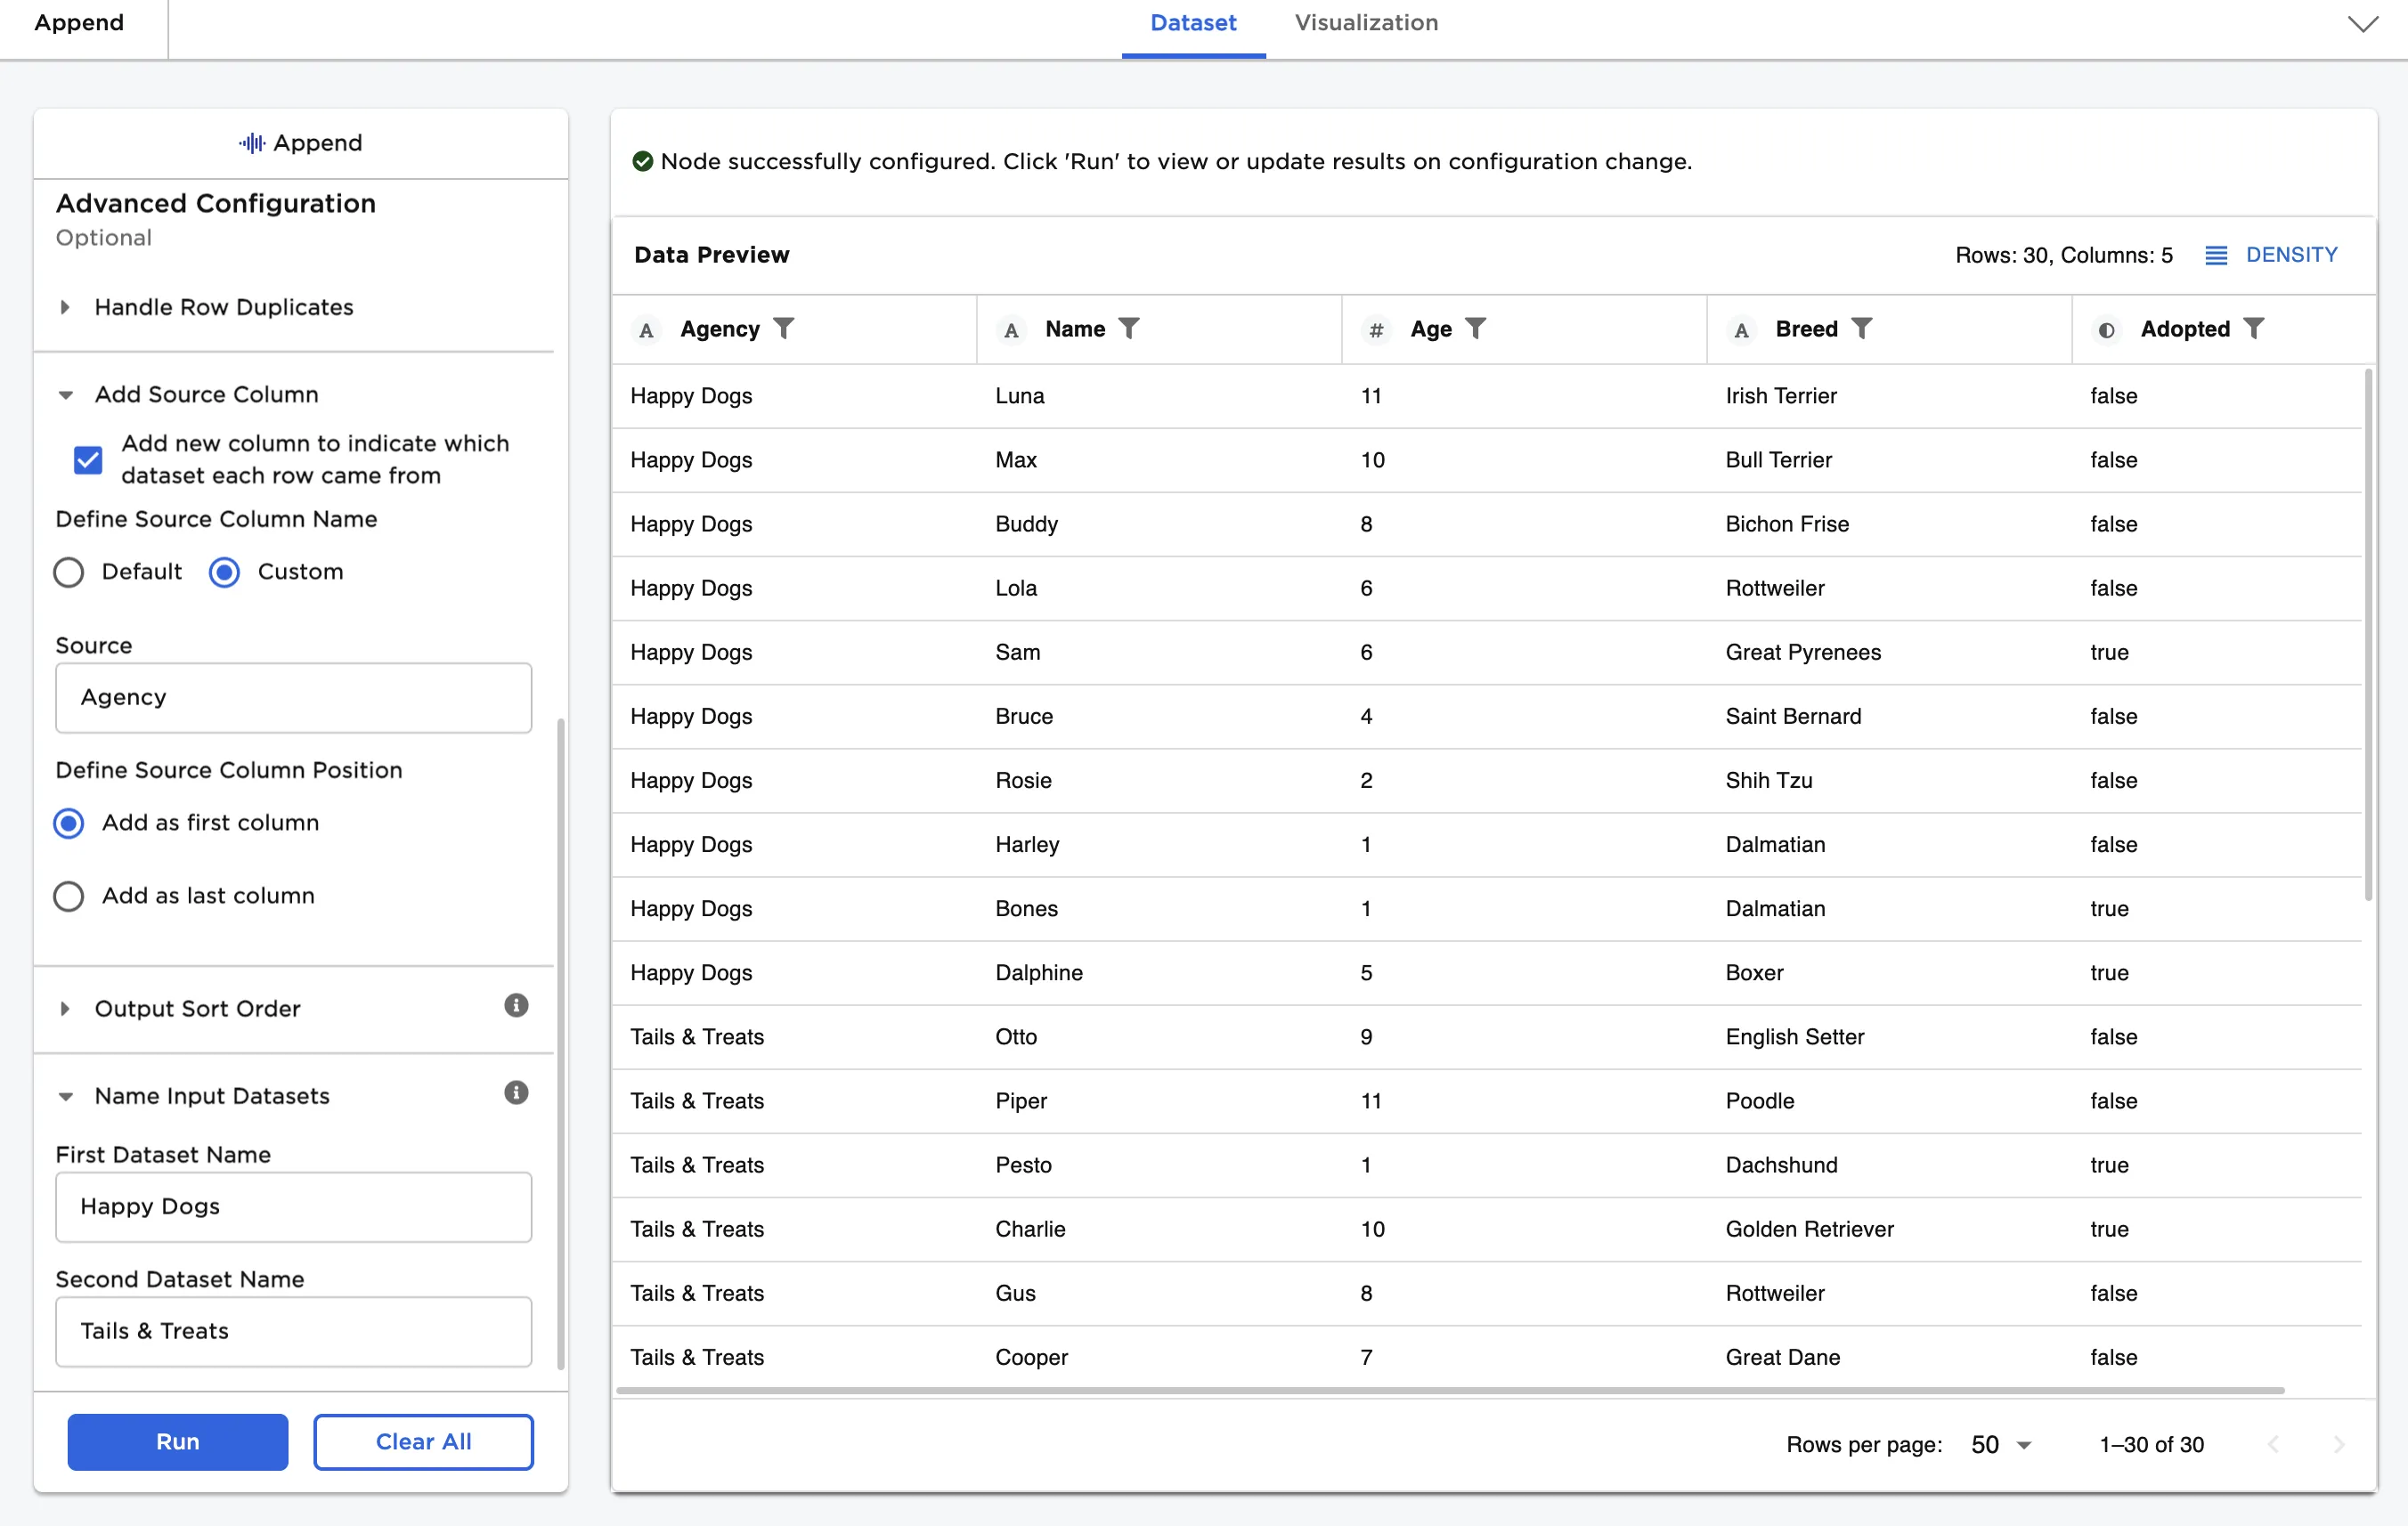
Figure 7: Example dataframe with custom source column
Finally, sort the combined dataset by dog age.
- Select the Add sort step button.
- Select Age for the Sort By field.
- Select the arrow icon to the right of the Sort By field to switch to a downward arrow.
- Select Run.
Notice that the dogs are ordered by age from youngest to oldest.
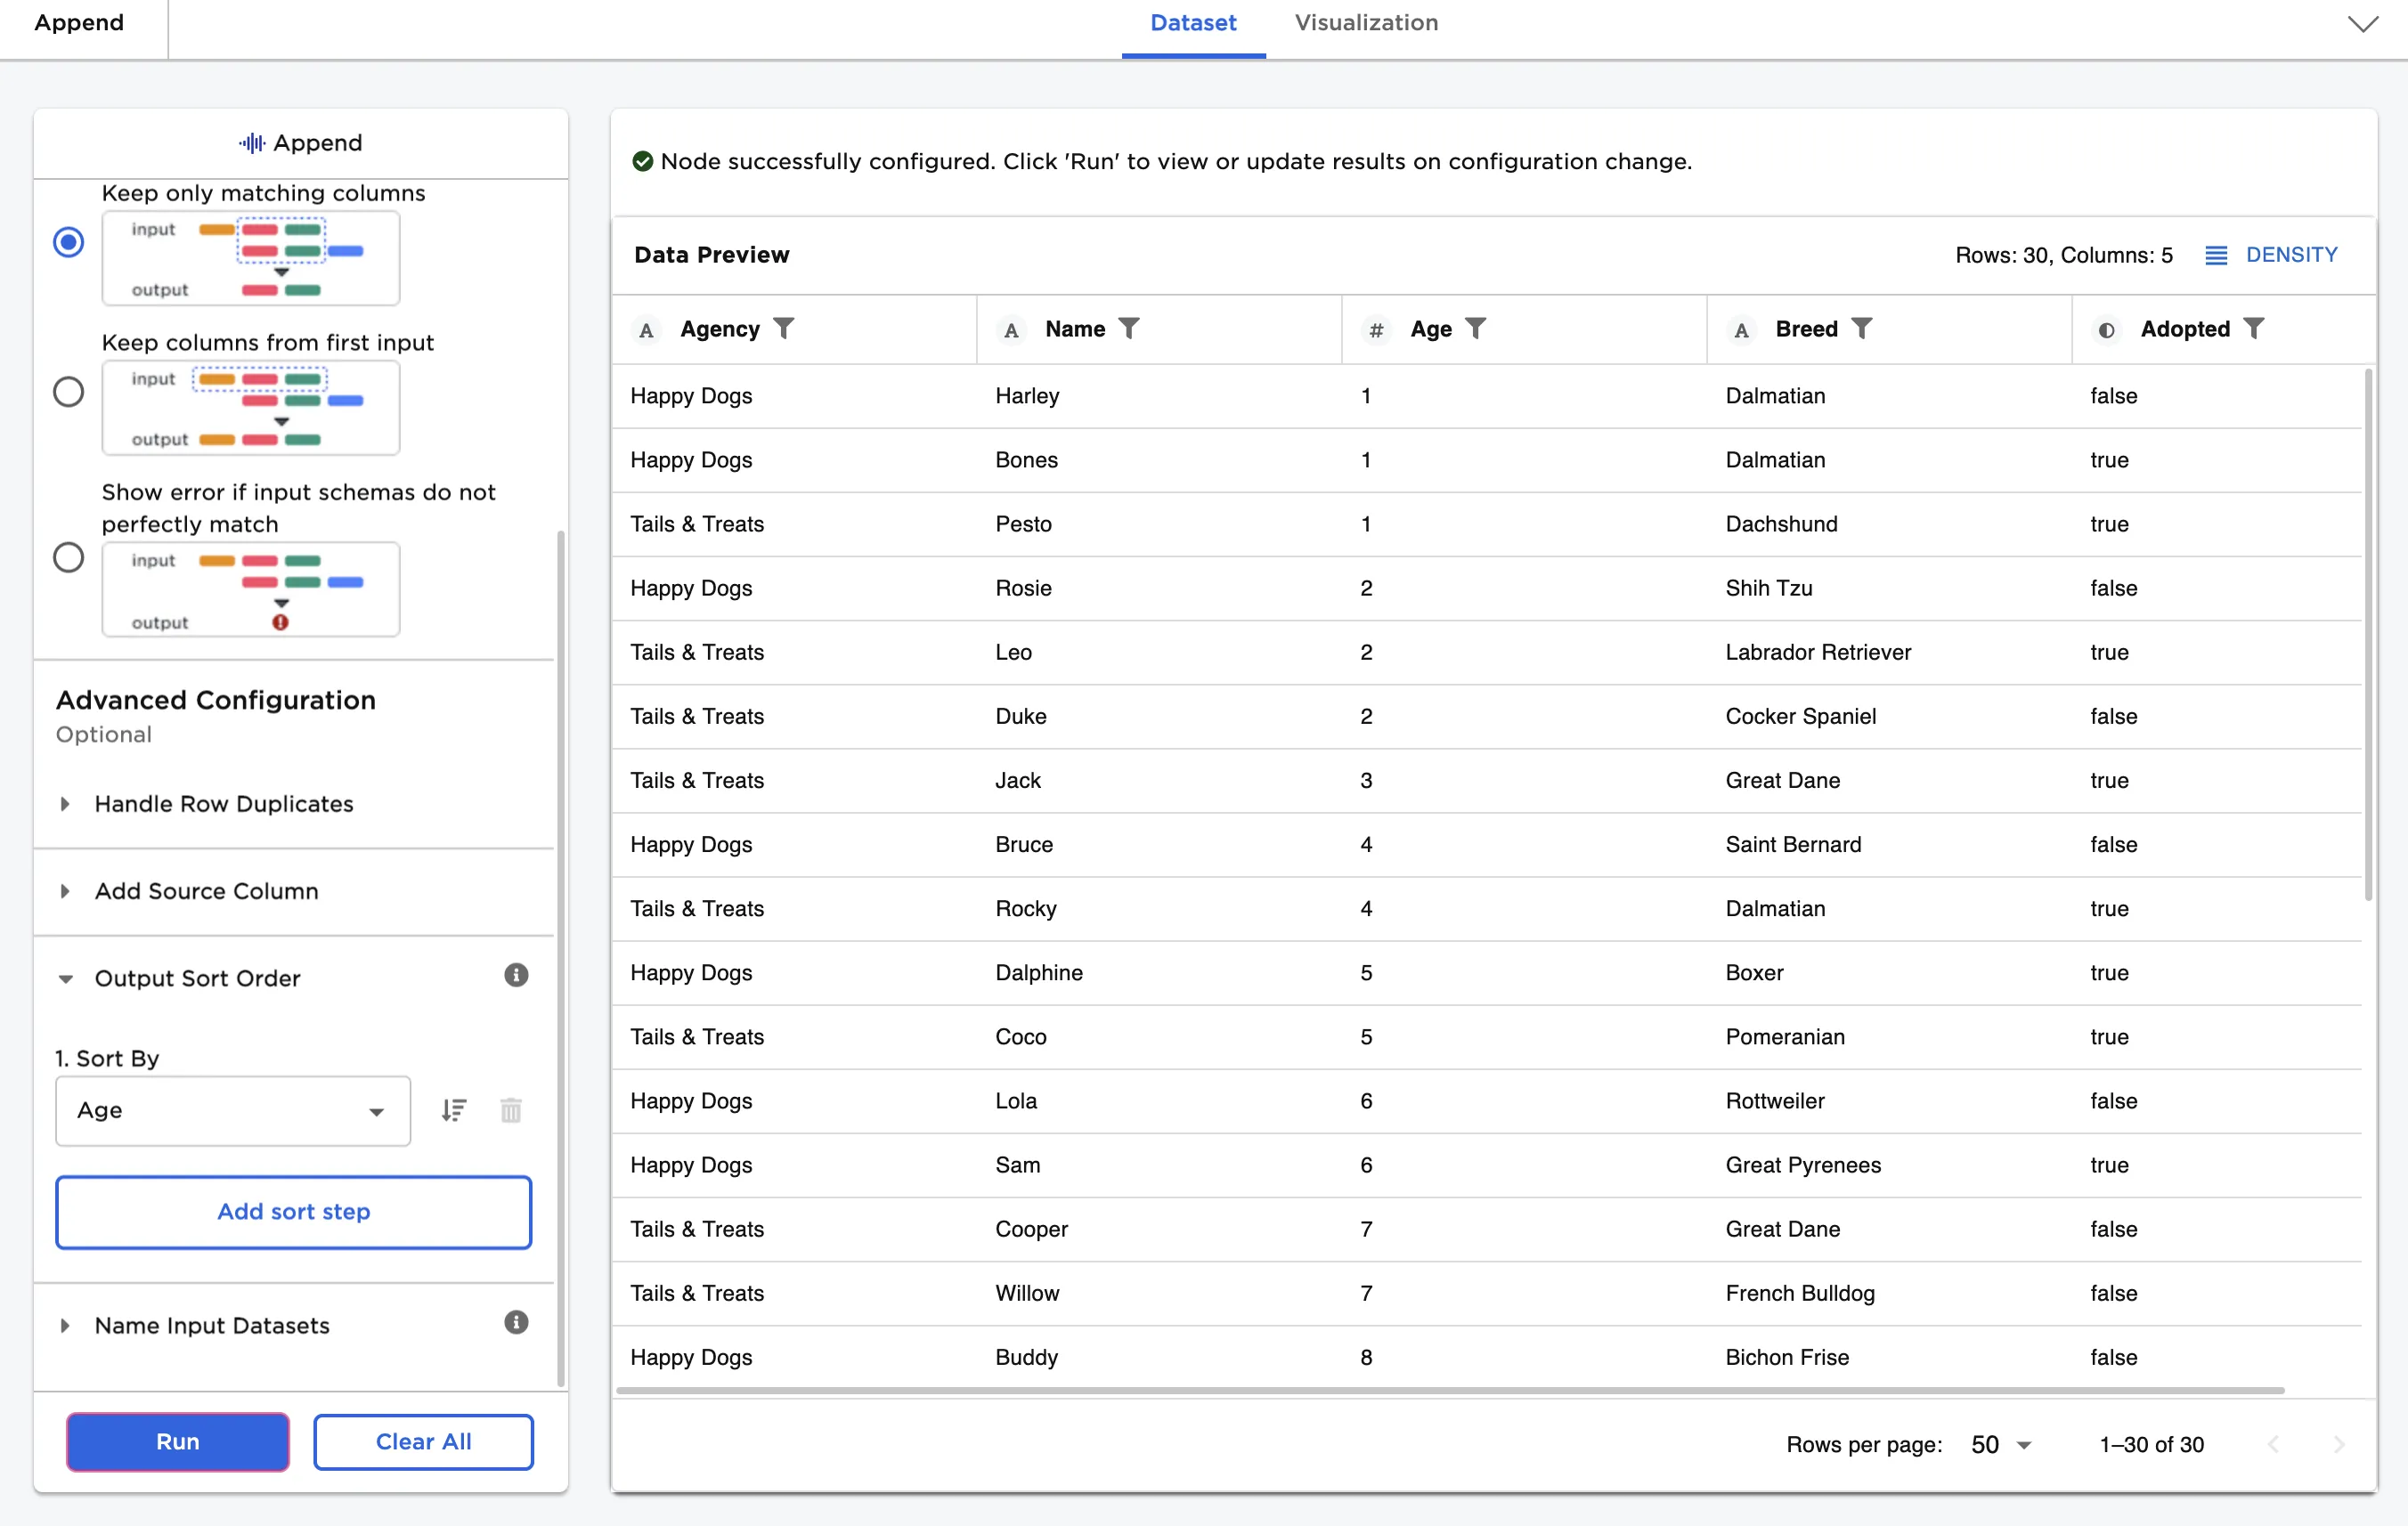
Figure 8: Example dataframe with dogs sorted by age