Computing Array Lengths in Visual Notebooks
Compute the number of elements in a column of type Array, consisting of single or multidimensional arrays.
Arrays in Visual Notebooks can contain the following combinations of data types:
- Strings, numeric (i.e., double, integer, long), timestamp and Boolean (Note: all data is converted to string)
- Multiple arrays
If an Array consists entirely of numeric values and has only one level (i.e., it is one-dimensional), it is labeled as type Vector.
Data analysis often involves a large number of concurrent mathematical operations on structured data (i.e., stored in a database and indexable by row and column). Matrix algebra is most commonly used to perform these operations efficiently. Arrays are equivalent to row vectors, and they complement the efficient column operations built into Visual Notebooks. Several transformations are provided for manipulating arrays, including creating arrays, extracting values from arrays, and disassembling arrays.
Configuration
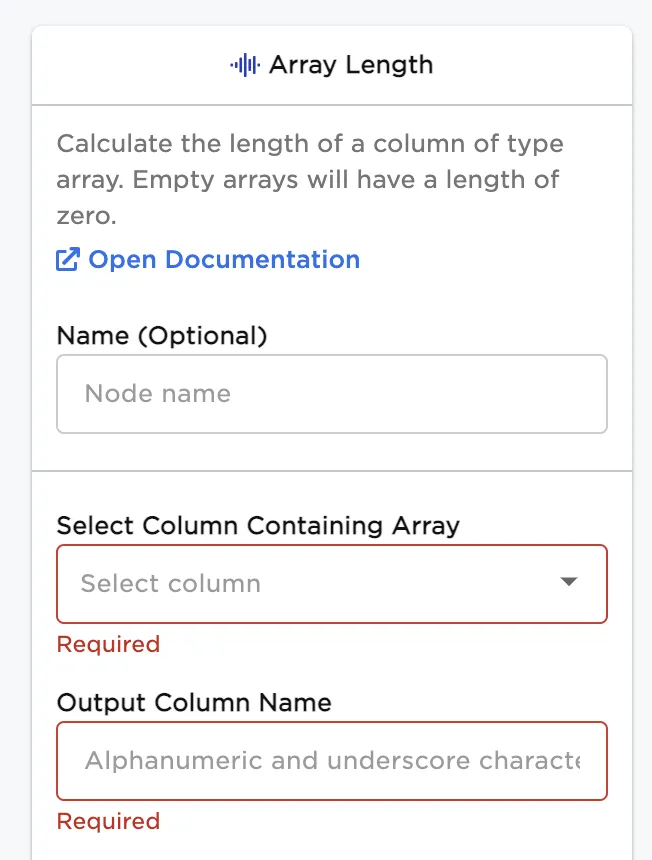
Configuration sidebar
| Field | Description |
|---|---|
Name (default=none) | Name of the node - A user-specified node name, displayed in the canvas and in the dataframe as a tab. |
| Select Column Containing Array Required | Select single column of type Array - Select the input array column from which to calculate array lengths. |
| Output Column Name Required | Output column name for the new array length column - Enter a name for the new column containing the array lengths. |
Node Inputs/Outputs
| Input | A Visual Notebooks dataframe with at least one column of type Array |
|---|---|
| Output | A dataframe including a column of array lengths |
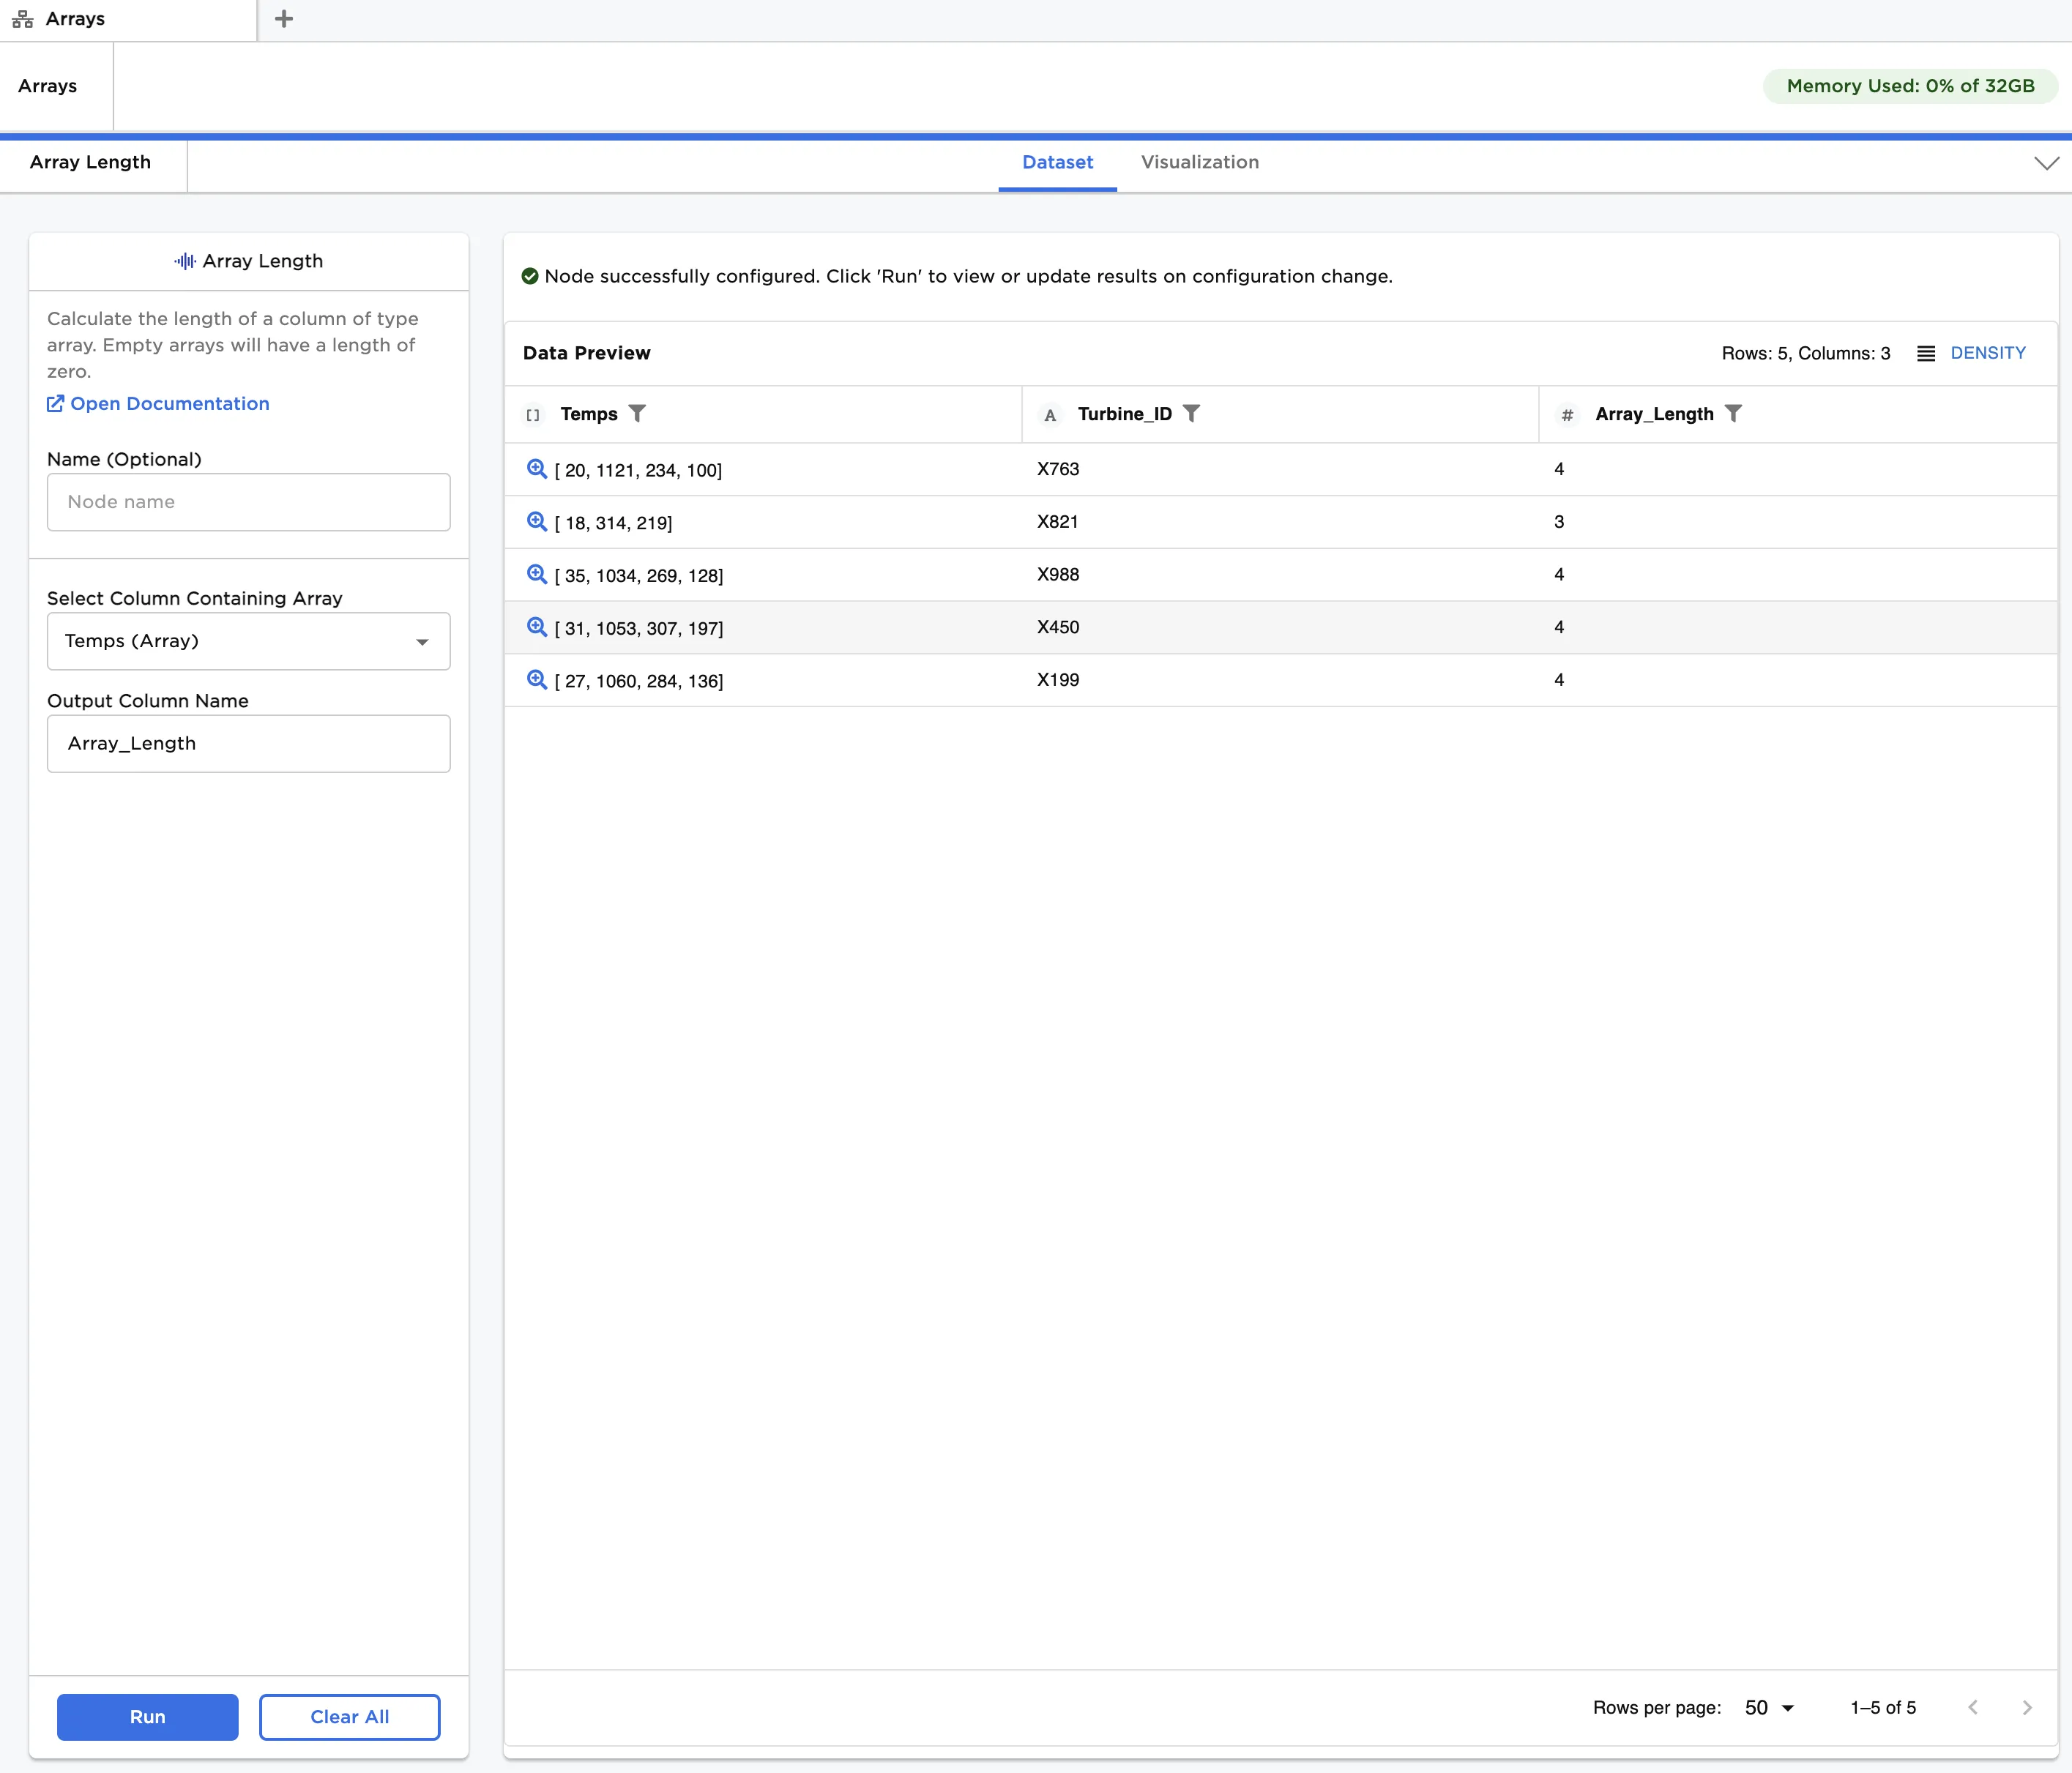
Figure 1: Example dataframe output
Examples
The data shown in Figure 2 is used in the following example. We start with a JSON file comprising temperature data for a number of gas turbine powered generators. Each generator has multiple temperature measurement points, which together are represented in an array. We use the Array Length node to count the number of measurements for each generator and see if any are missing.
The example data is available in the Visual Notebooks sample datasets.
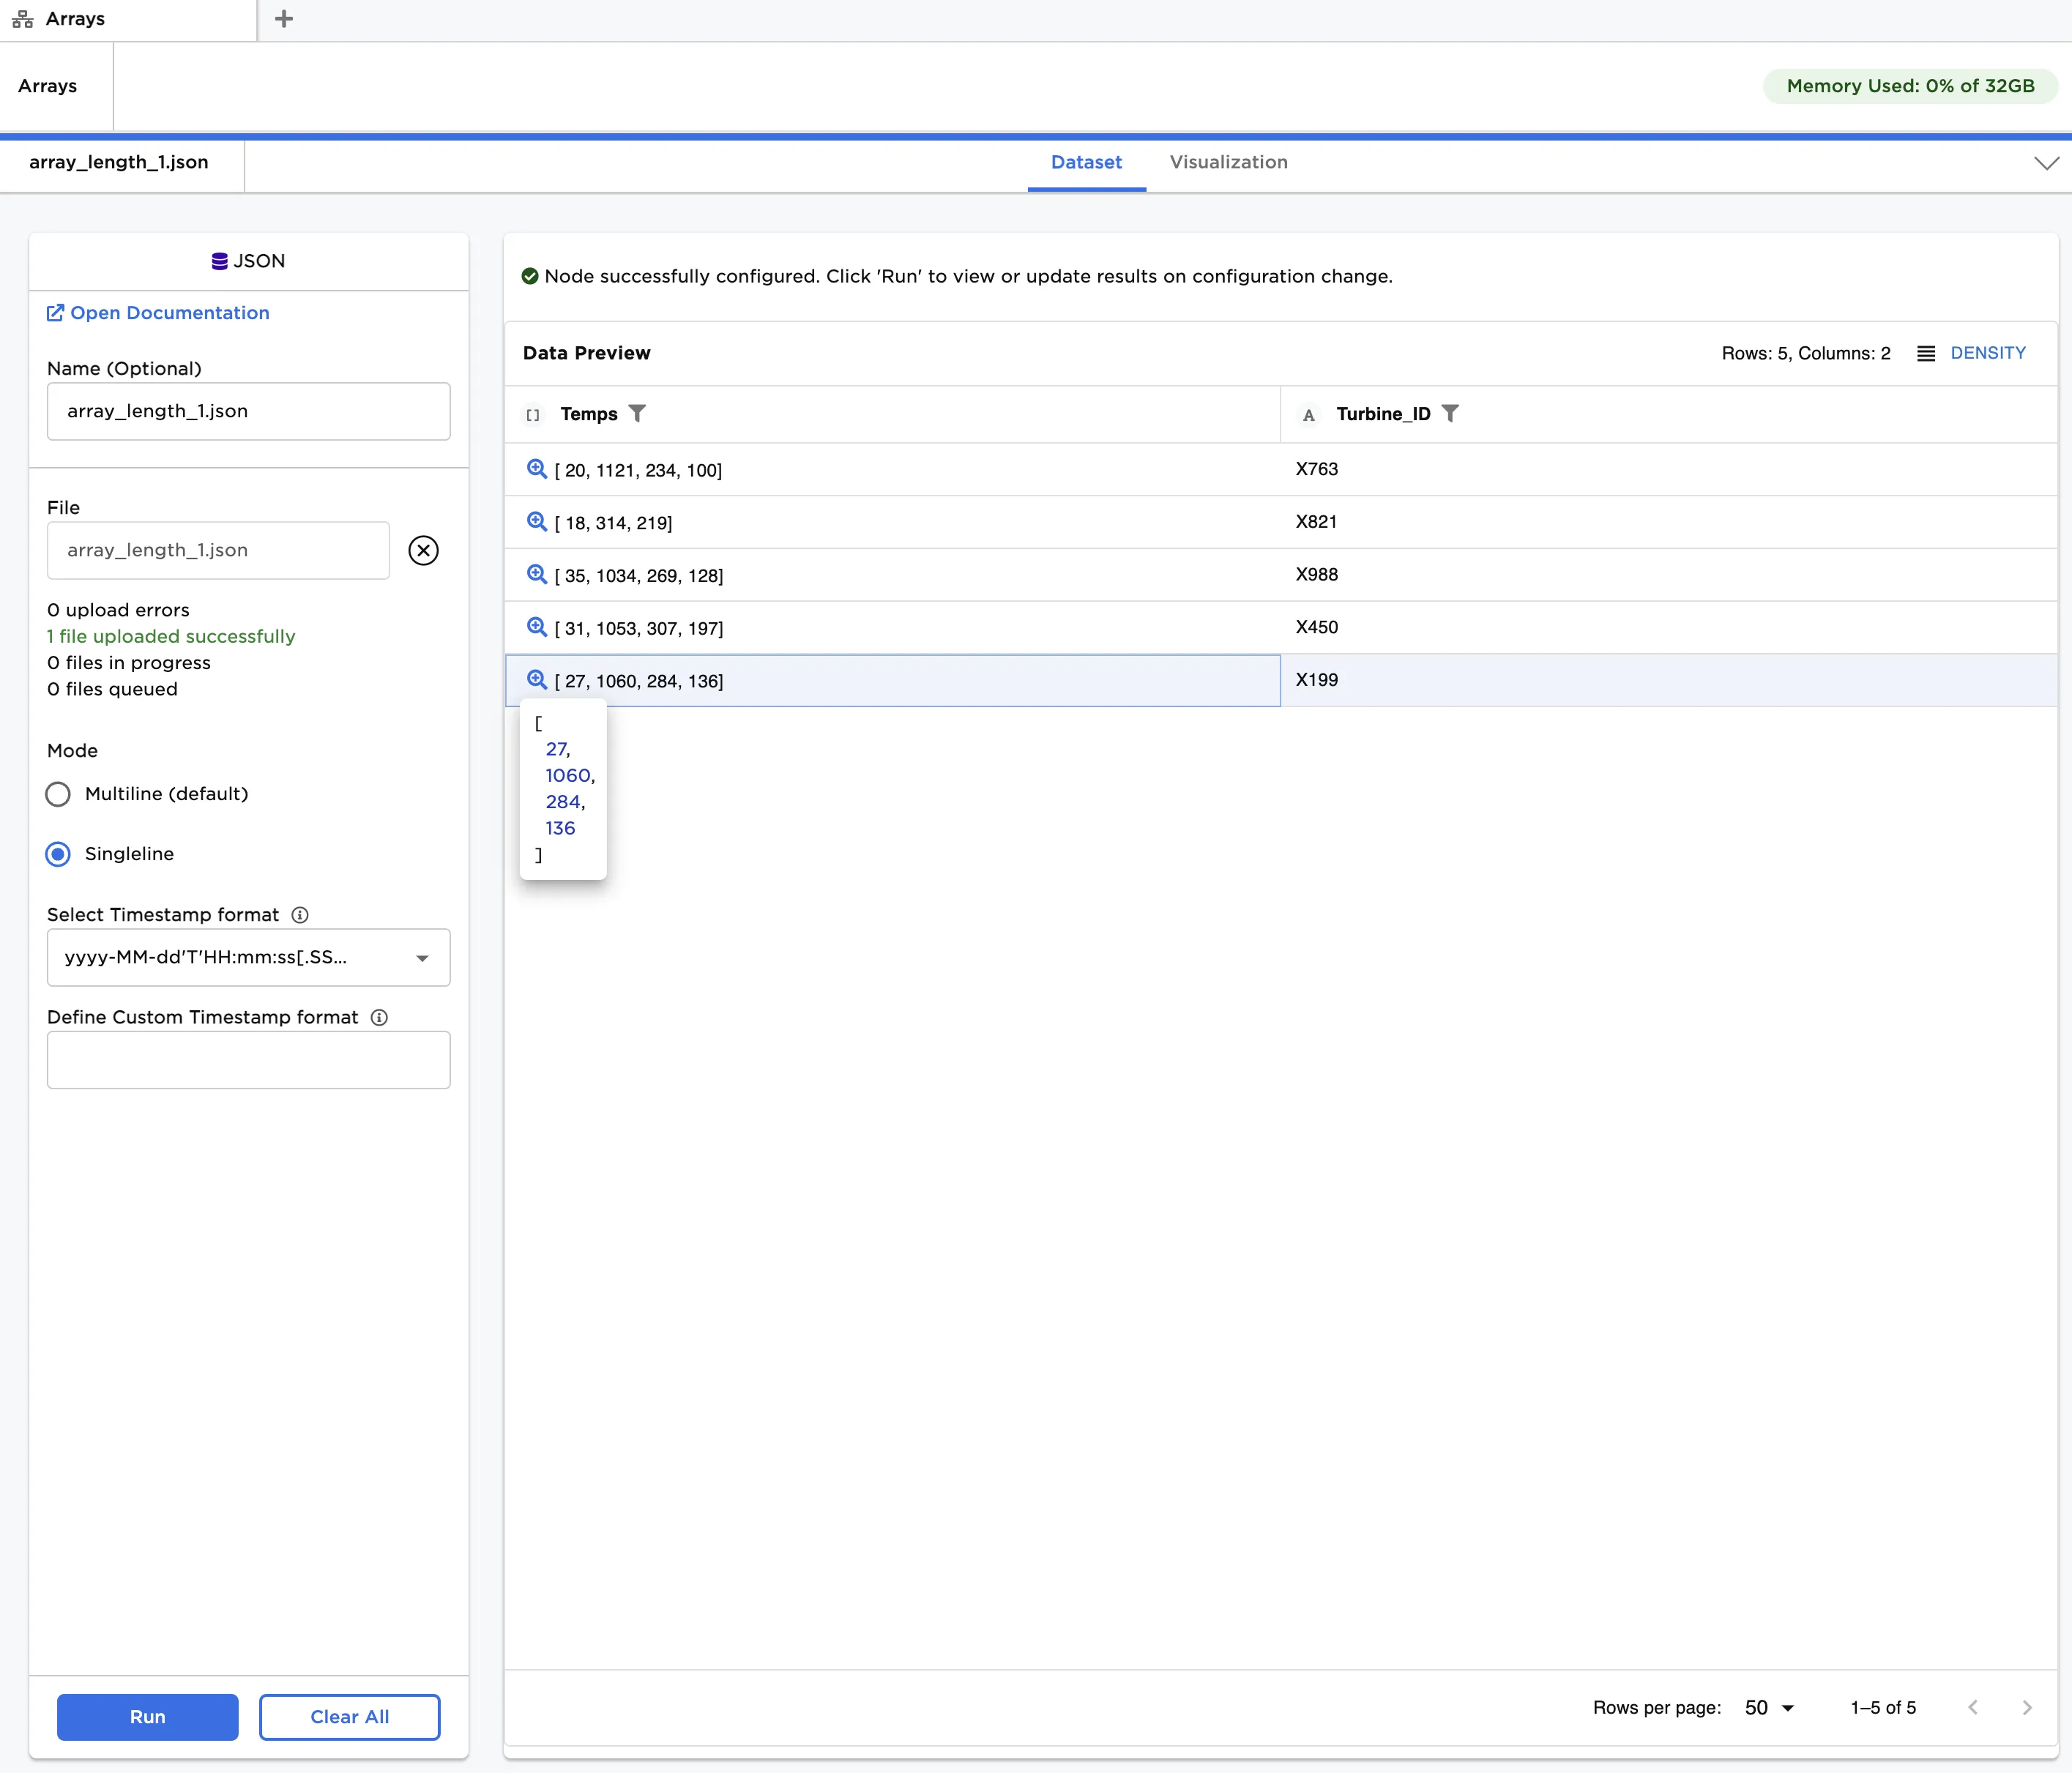
Figure 2: Example input data for one-dimensional array
- Connect an Array Length node to an existing node. In this case, it is connected to a JSON node with the example data provided.
- In the JSON node under Mode, select Singleline.
- In the Array Length node, select Temps (Array) under Select Column Containing Array.
- Enter
Array_Lengthunder Output Column Name and click Run.
After running the node, a new column called "Array_Length" can be seen in Figure 3, indicating the number of entries in each array. From this, we see that the generator with "Turbine_ID" equal to "X821" has only three temperature measurements, while the others have four. In practice, this might result from a sensor issue we wish to investigate further.
Figure 3: Array lengths for one-dimensional arrays
Now, let's analyze a JSON file comprising a multidimensional array of operating data for gas turbine powered generators. For a given generator, each array corresponds to a different group of parameters. From left to right, the parameters are temperature, pressure, speed and power, as shown in Figure 4.
The example data is available in the Visual Notebooks sample datasets.
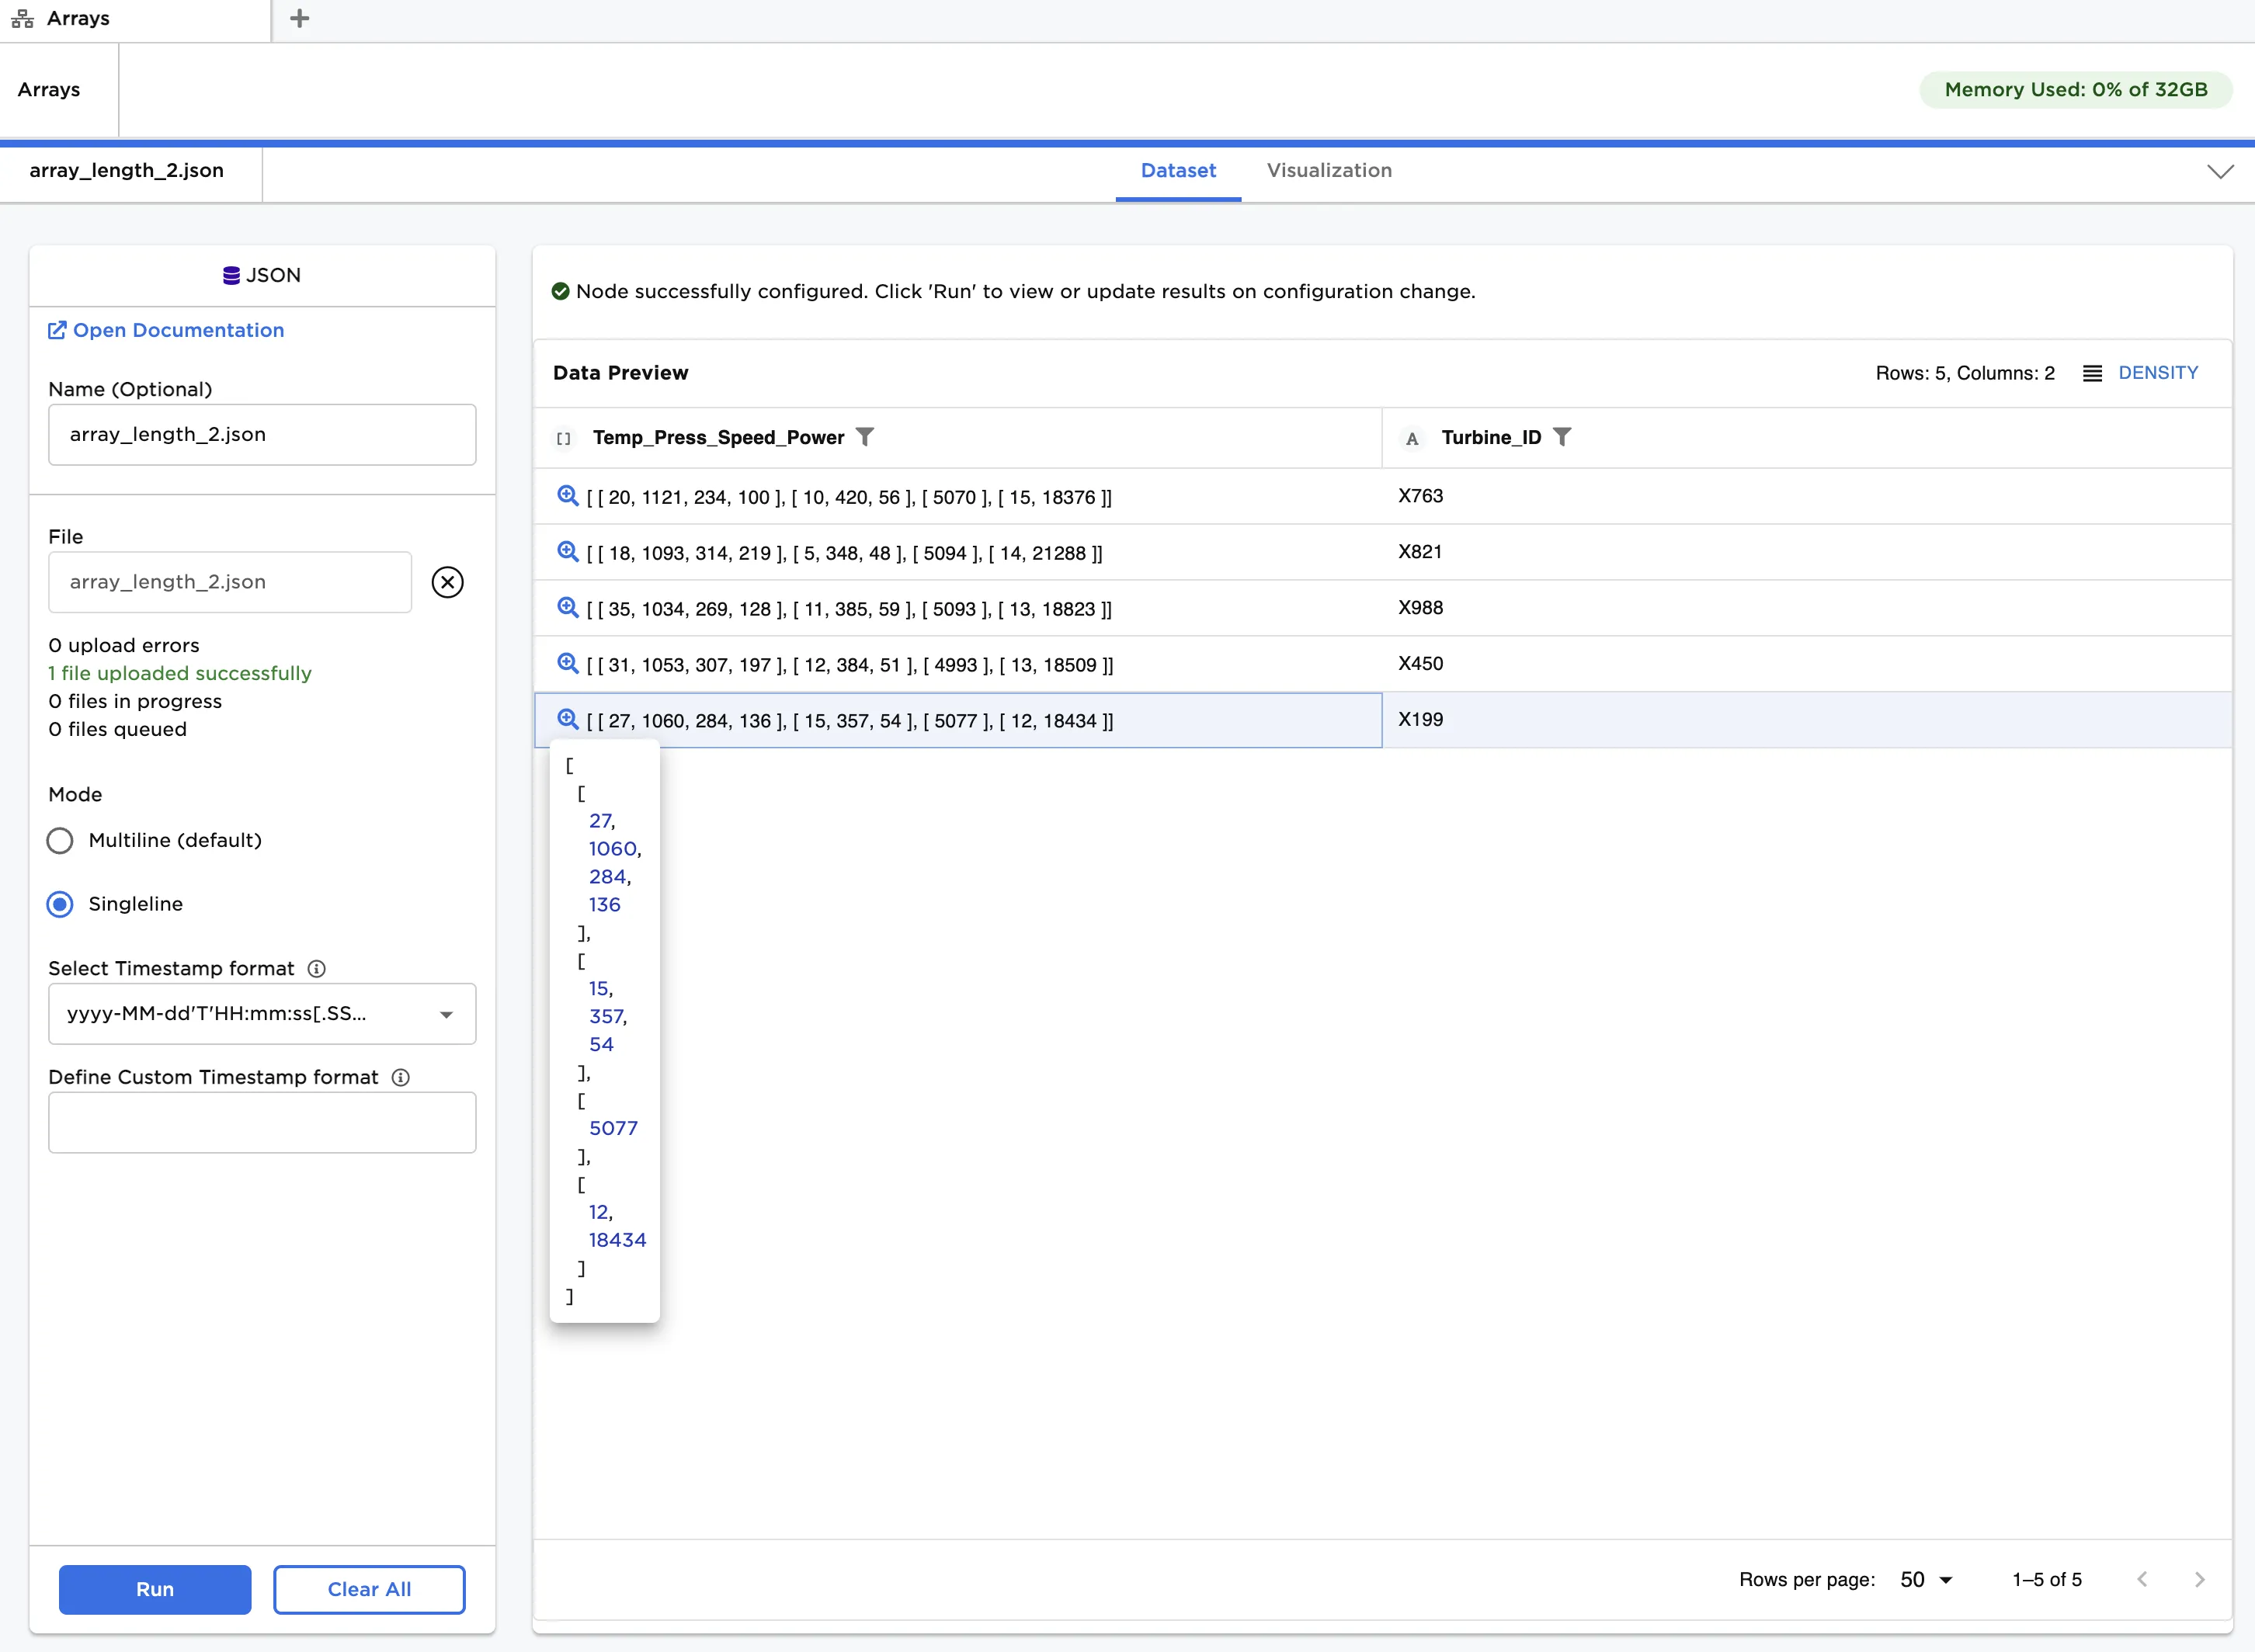
Figure 4: Example input data for multidimensional array
Repeat the steps in the previous example, except select Temp_Press_Speed_Power (Array) under Select Column Containing Array. Results are shown in Figure 5.
Notice that the array lengths are all four, corresponding to the number of vectors in each Array and not the number of values. In general, the array length of a multidimensional Array is equal to the number of comma separated matrices. So, as an example, an Array of the form [[2x2 matrix], [1x5 vector], [3x5x5 matrix]] would have an array length of three, even though there are 84 values.
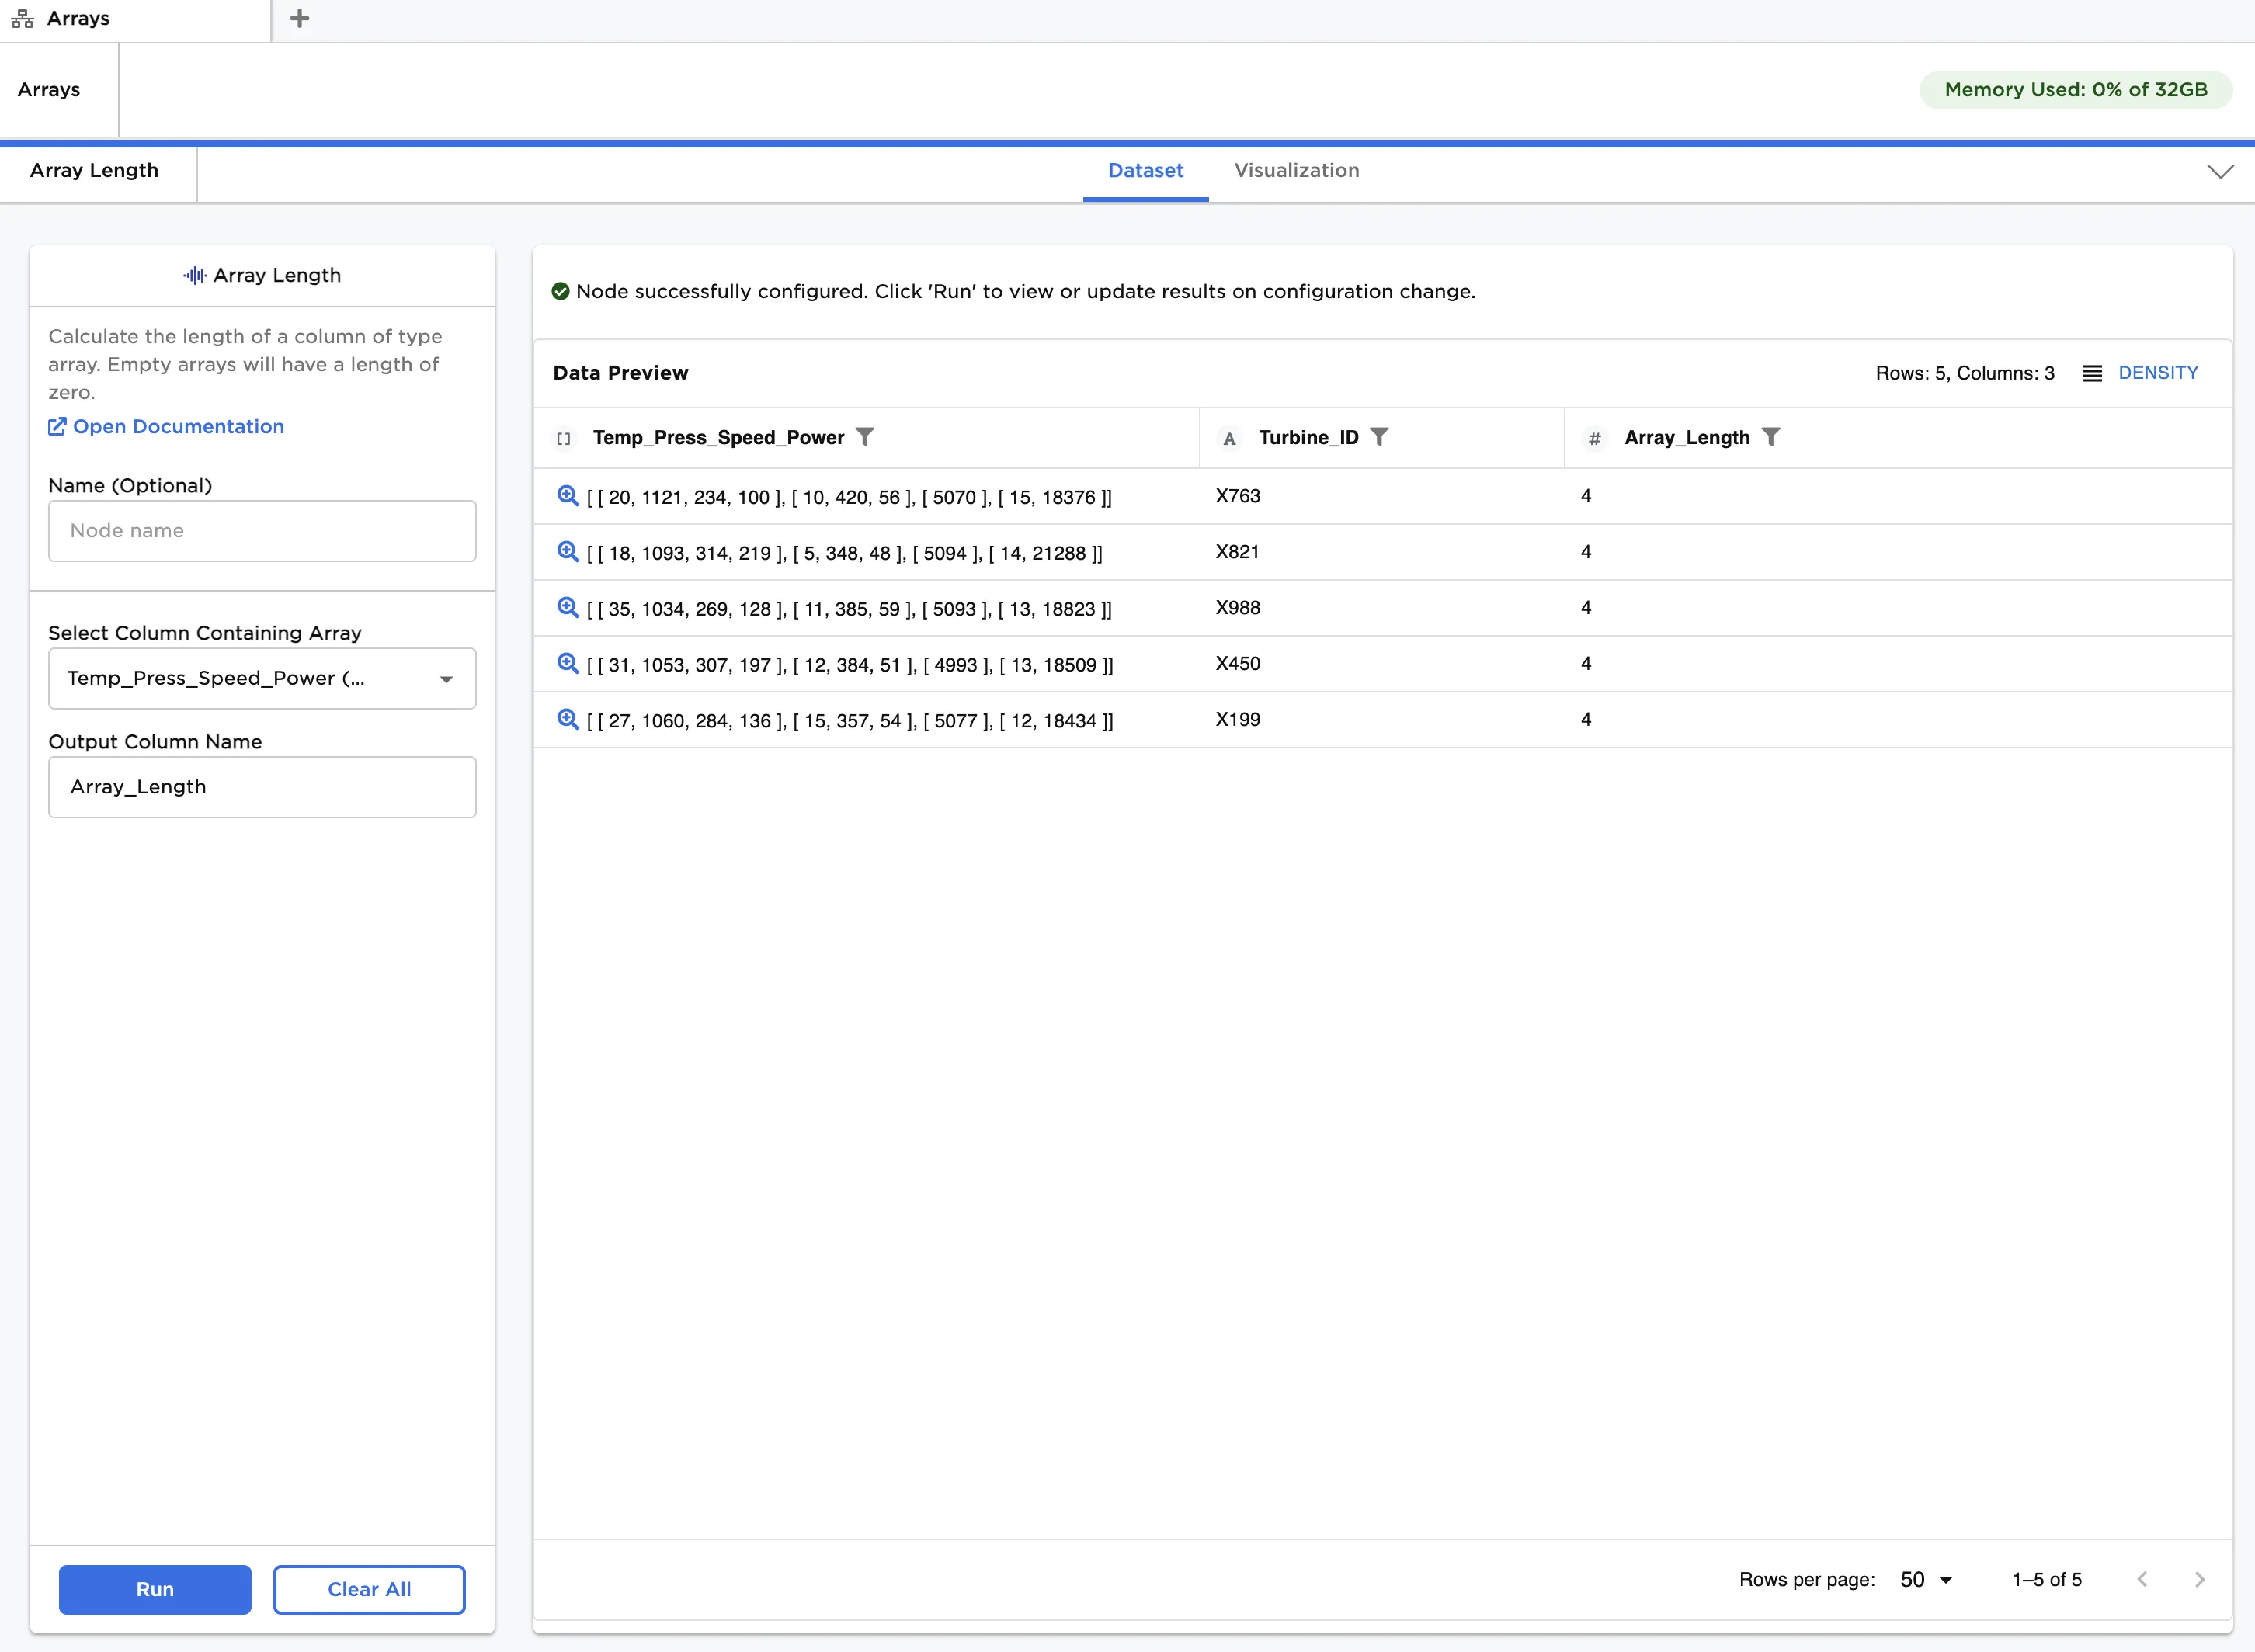
Figure 5: Array lengths for multidimensional arrays