Assemble Graph
Format data in Visual Notebooks so it can be used with a Graph node.
Configuration
| Field | Description |
|---|---|
Name default=Assemble Graph | A user-specified node name displayed in the workspace |
| Select Column with Vertex ids Required | Vertex IDs |
| Select the column in the vertices dataset that contains the vertex IDs. | |
| Select Source Columns Required | Source column |
| Select the column in the edges dataset that contains the source of each relationship. | |
| Select Destination Column Required | Destination column |
| Select the column in the edges dataset that contains the destination of each relationship. |
Node Inputs/Outputs
| Input | A dataframe with vertices data and a dataframe with edges data |
|---|---|
| Output | Vertices and edges data that can be used with a Graph node |
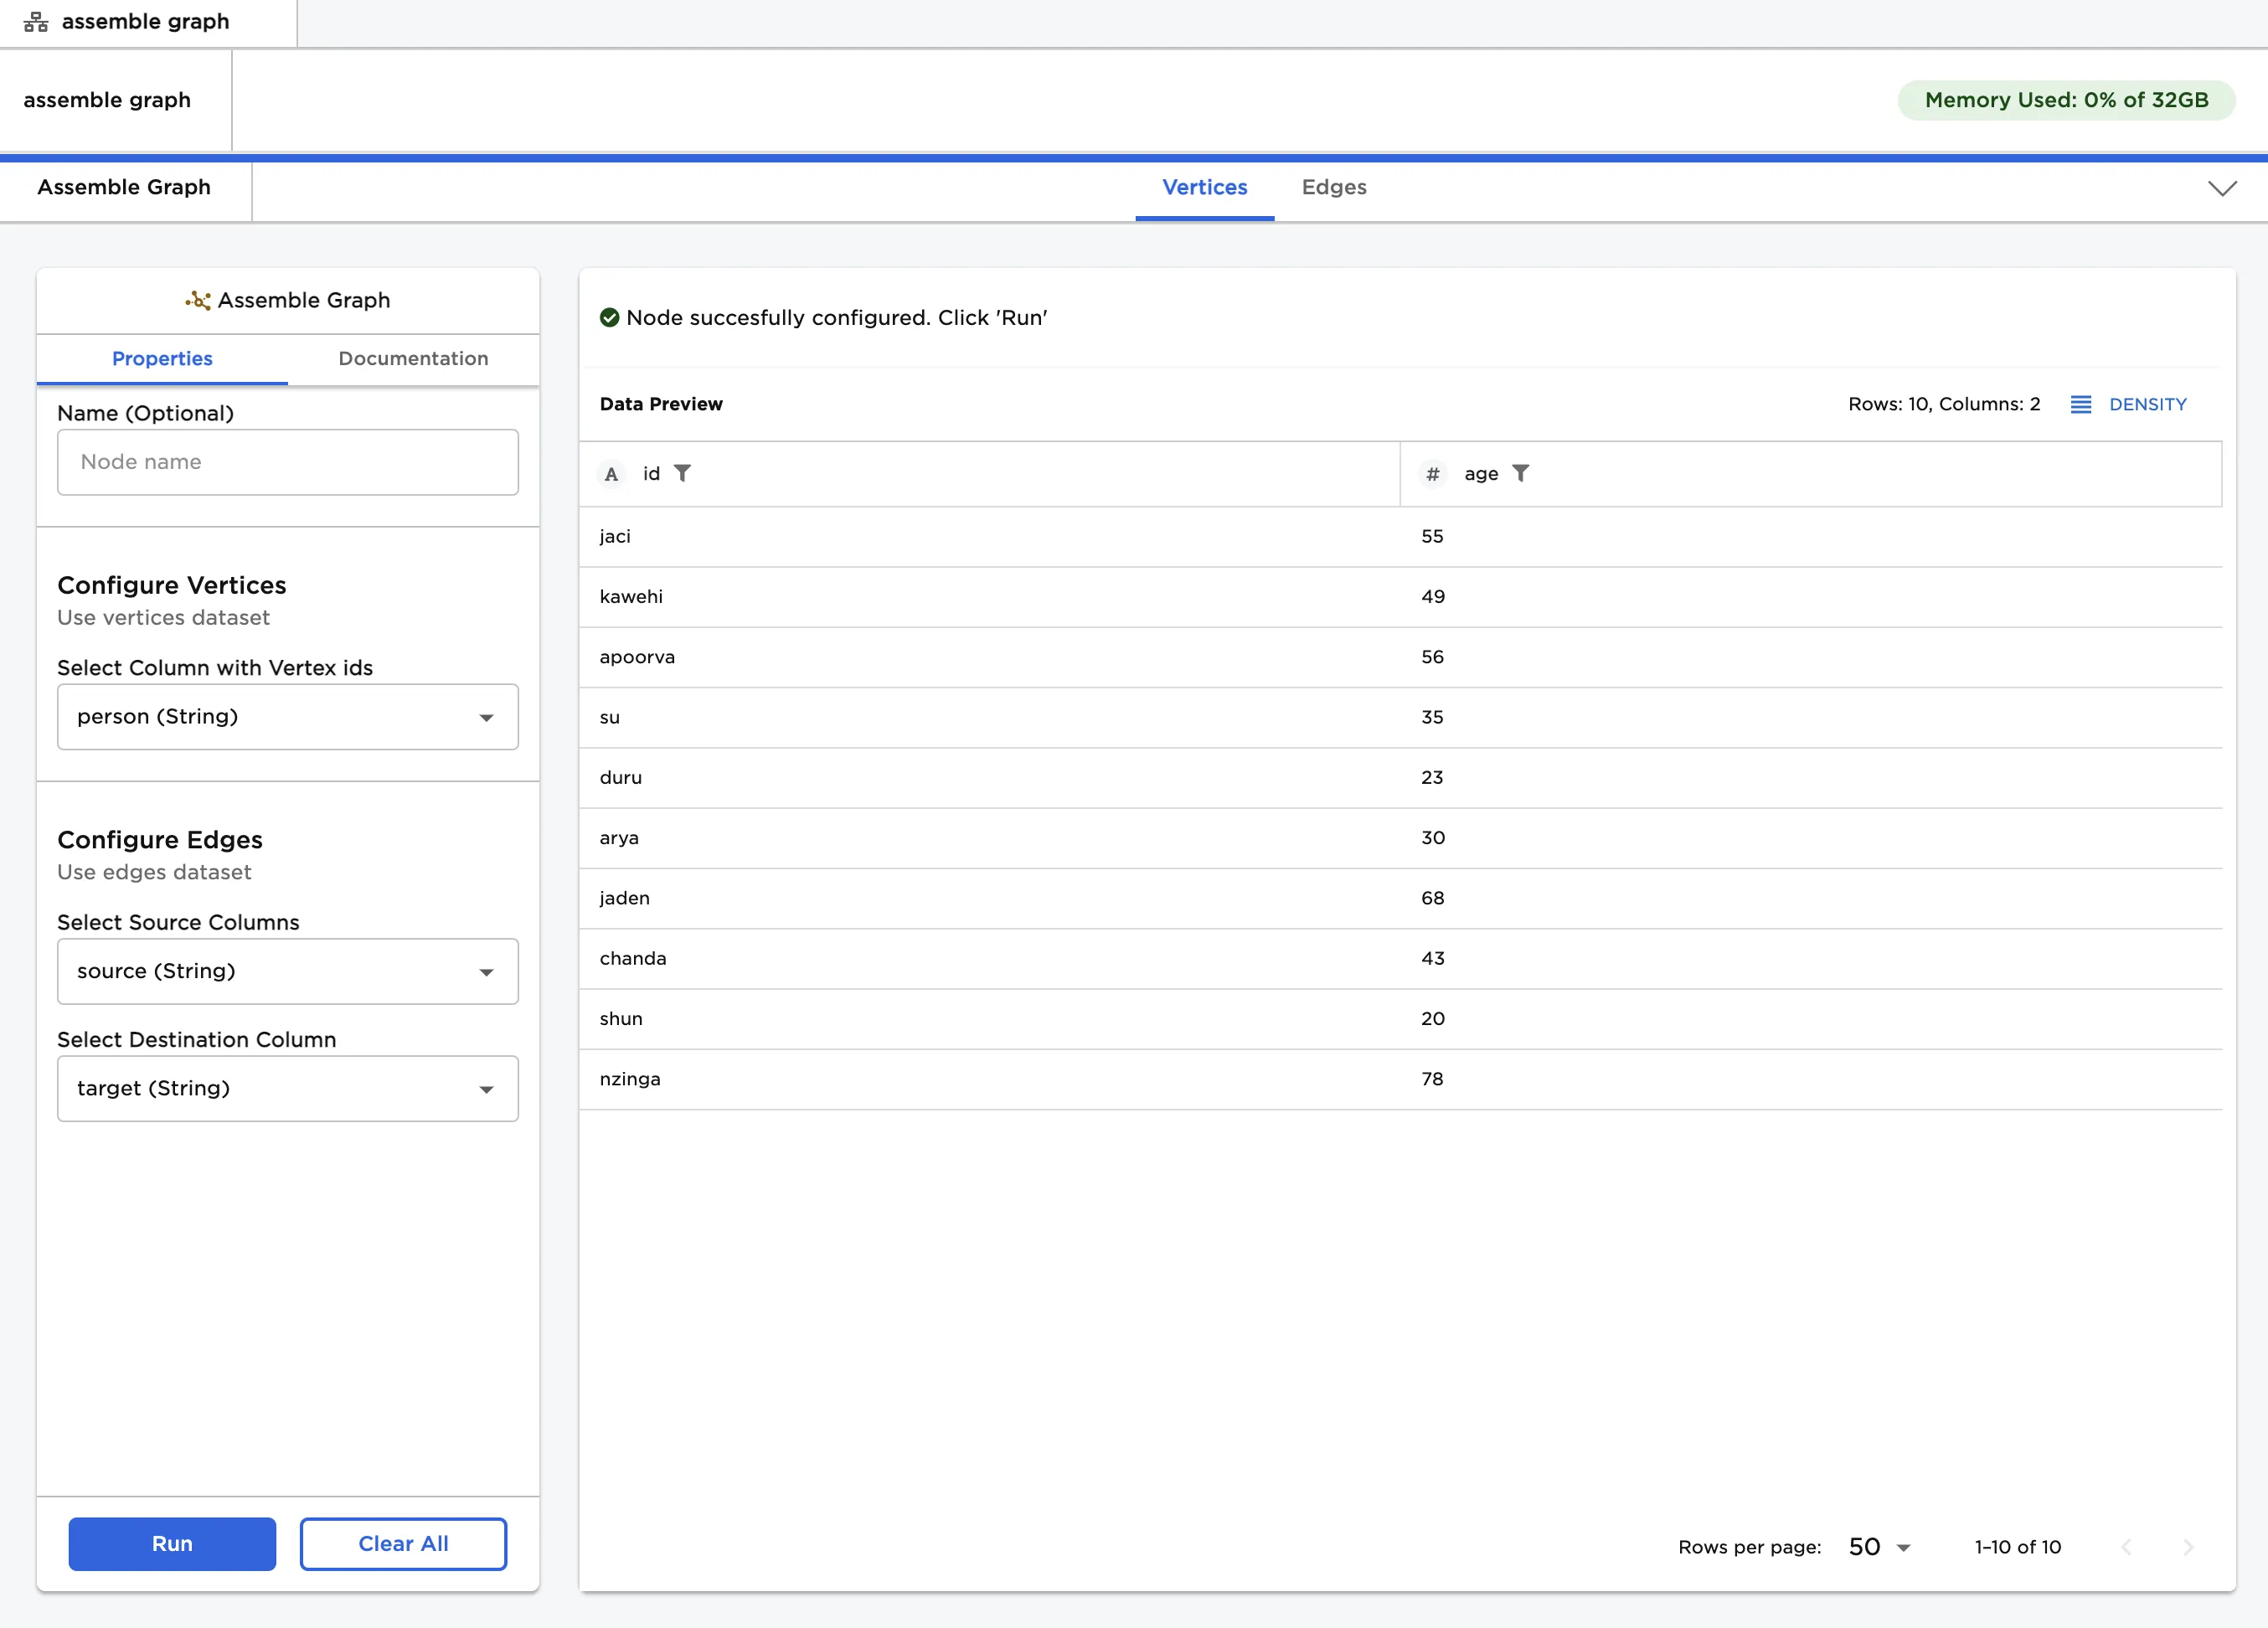
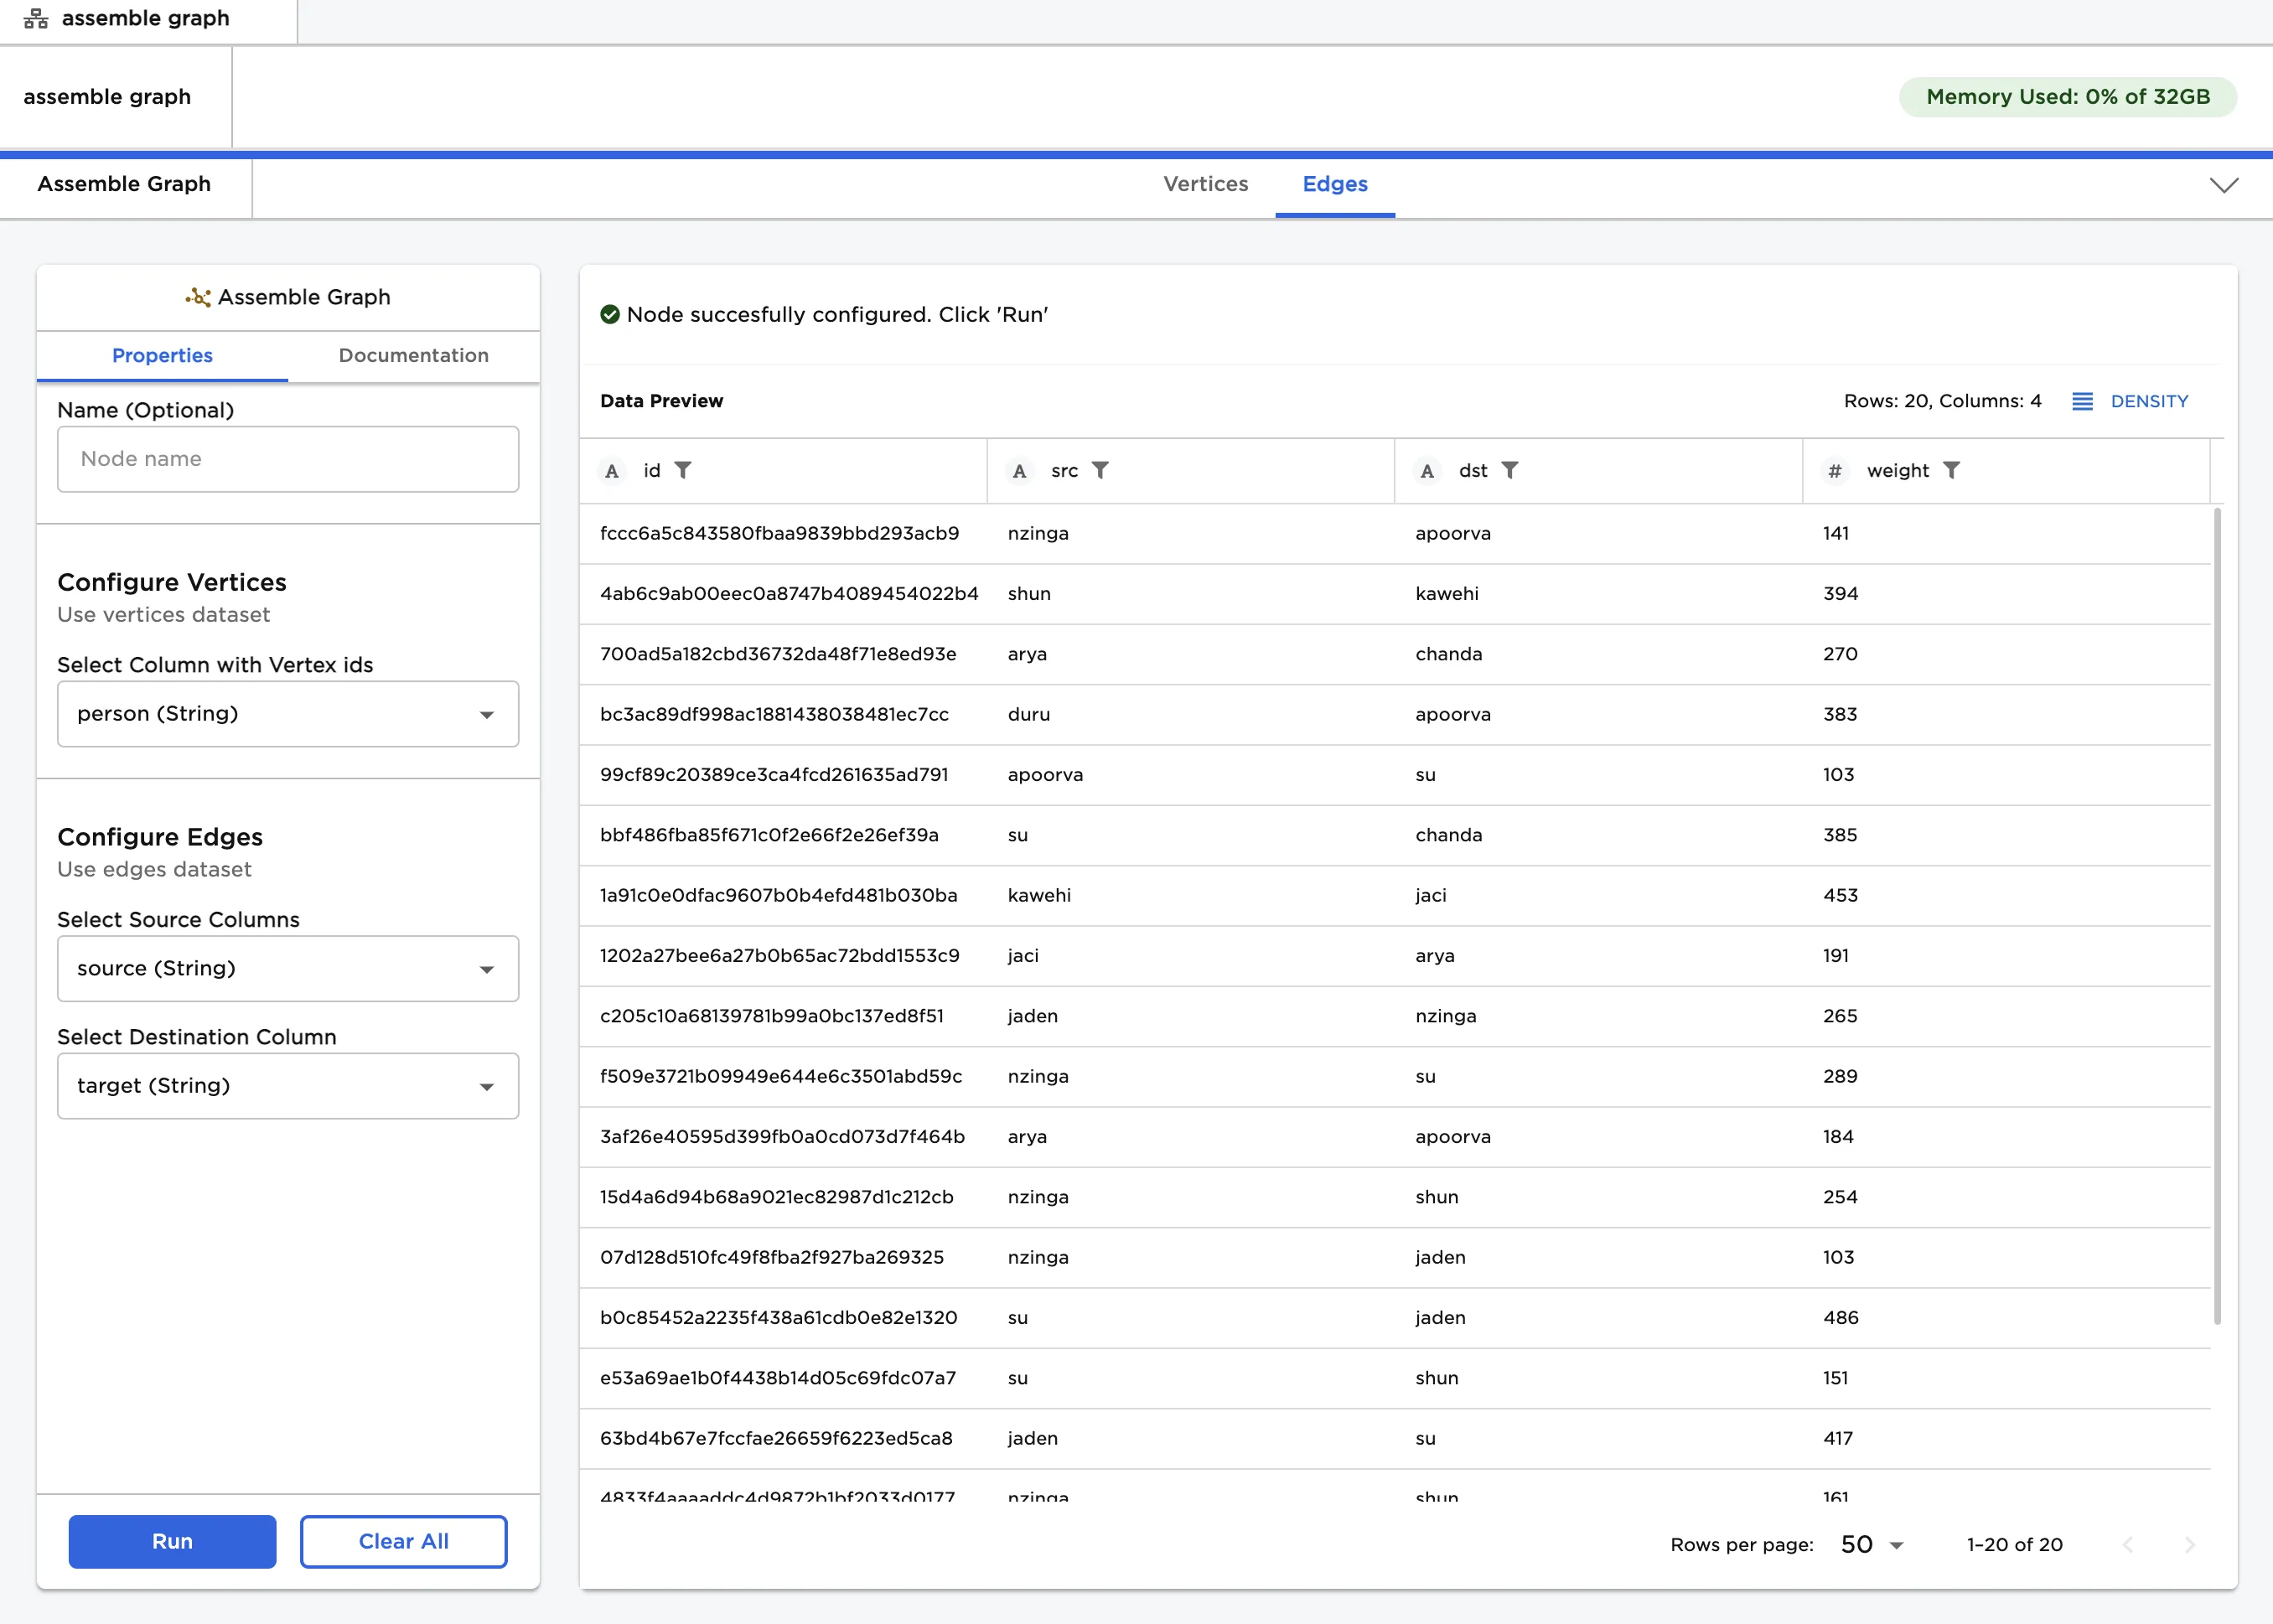
Figure 1: Example output
Examples
- Connect a dataset with vertices and a dataset with edges to an Assemble Graph node. Ideally, these are separate datasets. If the datasets are not separate, arrange the data so all the IDs are in the same column.
- The dataframes shown below are used in this example. The "people.csv" data contains a list of people and their ages. This data is used as vertices. The "relationships.csv" data contains a list of connections between the people, as well as a "weight" column that quantifies the strength of each relationship. This data is used as edges.
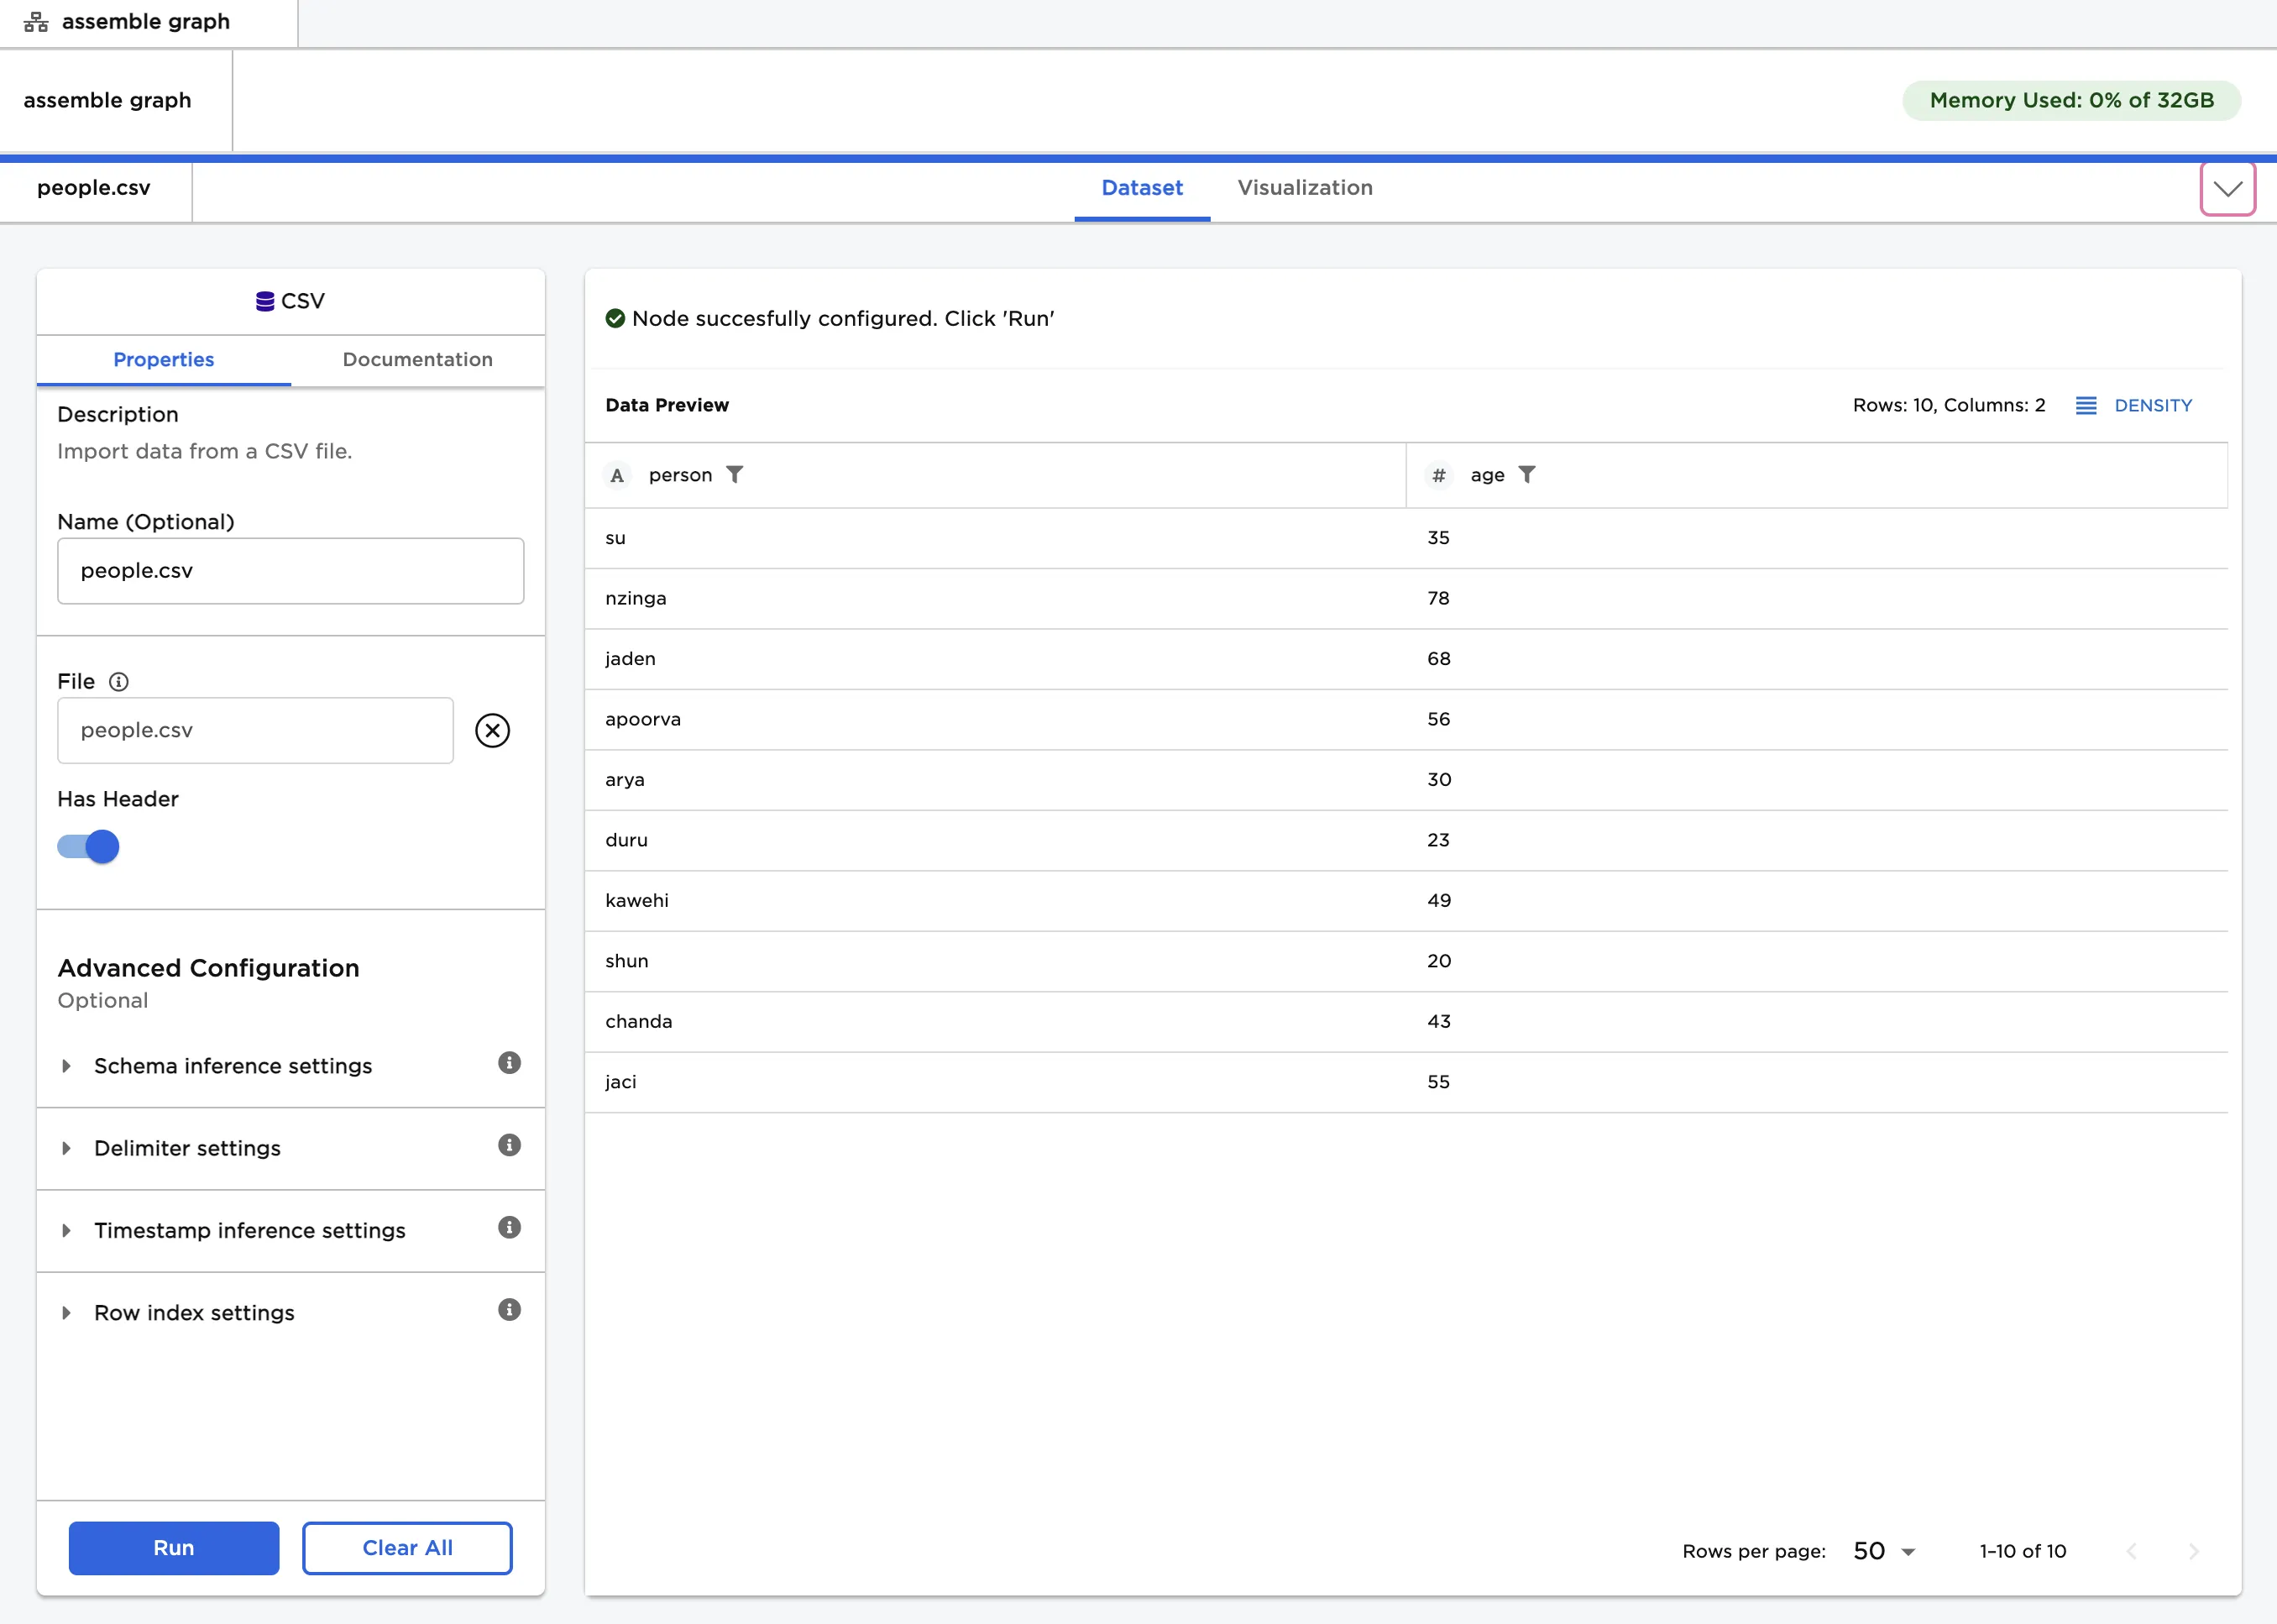
Figure 2: Example vertices dataset
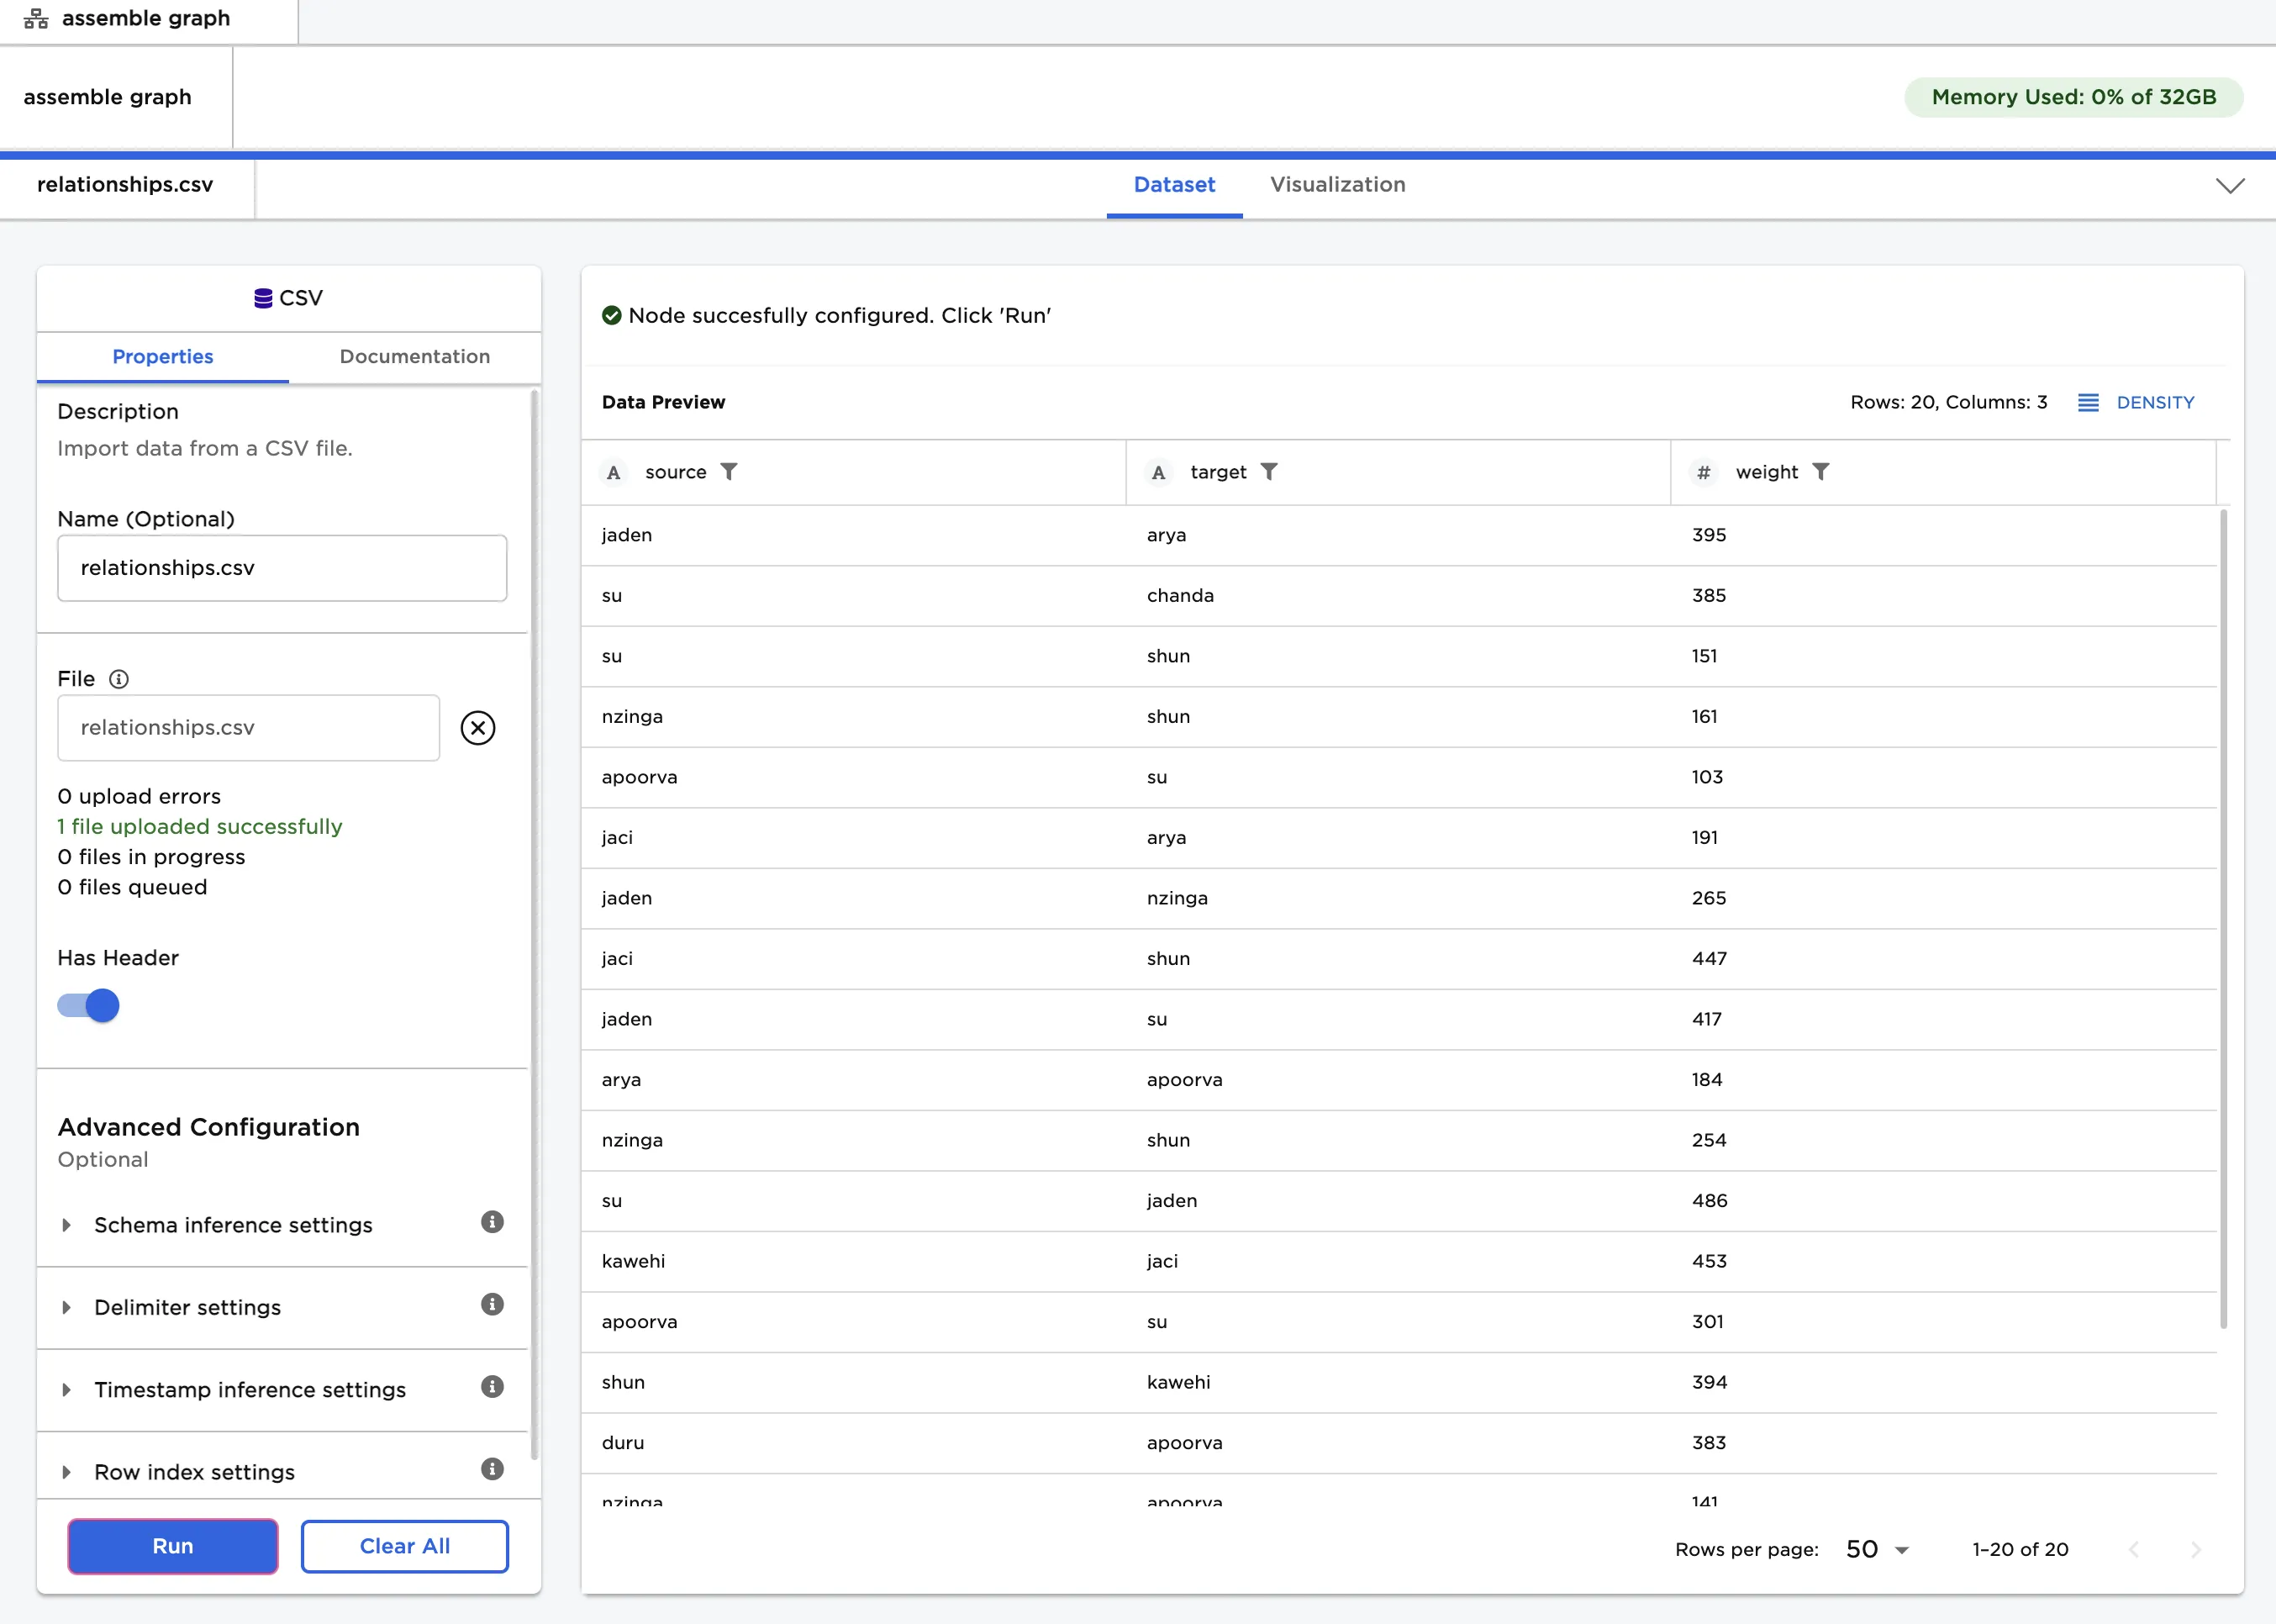
Figure 3: Example edges dataset
- Select the "person" column for the "Select Column with Vertex ids" field.
- Select the "source" column for the "Select Source Columns" field, and select the "target" column for the "Select Destination Columns" field.
- Select "Run" to format the data so it can be used for a graph.
- Use the tabs near the top to toggle between the vertices and edges. Notice that Visual Notebooks makes some slight changes to the input data.
- This output can be connected to a Graph node.
Figure 4: Example output