Degree Centrality
Identify influential vertices in a Visual Notebooks graph by analyzing the number of incoming and outgoing relationships. Applications include identifying the most influential person(s) in a social network, key infrastructure nodes in the Internet or urban networks, super-spreaders of disease, and brain networks.
Configuration
| Field | Description |
|---|---|
| Name default=none | Field to name the node |
| A user-specified node name, displayed in the canvas and in the dataframe as a tab. | |
Total Degrees default=total_degrees | Name of column for total connections |
| Specify a custom name, if desired, for the column showing the total number of connections. | |
In Degrees default=in_degrees | Name of column for incoming connections |
| Specify a custom name, if desired, for the column showing the number of incoming connections only. | |
Out Degrees default=out_degrees | Name of column for outgoing connections |
| Specify a custom name, if desired, for the column showing the number of outgoing connections only. | |
| Sort By default=none | Column to sort on |
| Select a column on which to apply a sorting rule. The icon to the right of this field is a toggle for ascending or descending order. Sorting rules can only be applied to the three output columns. |
Node Inputs/Outputs
| Input | A Visual Notebooks graph, output from an Assemble Graph node |
|---|---|
| Output | Vertices and edges that can be used with a Graph node |
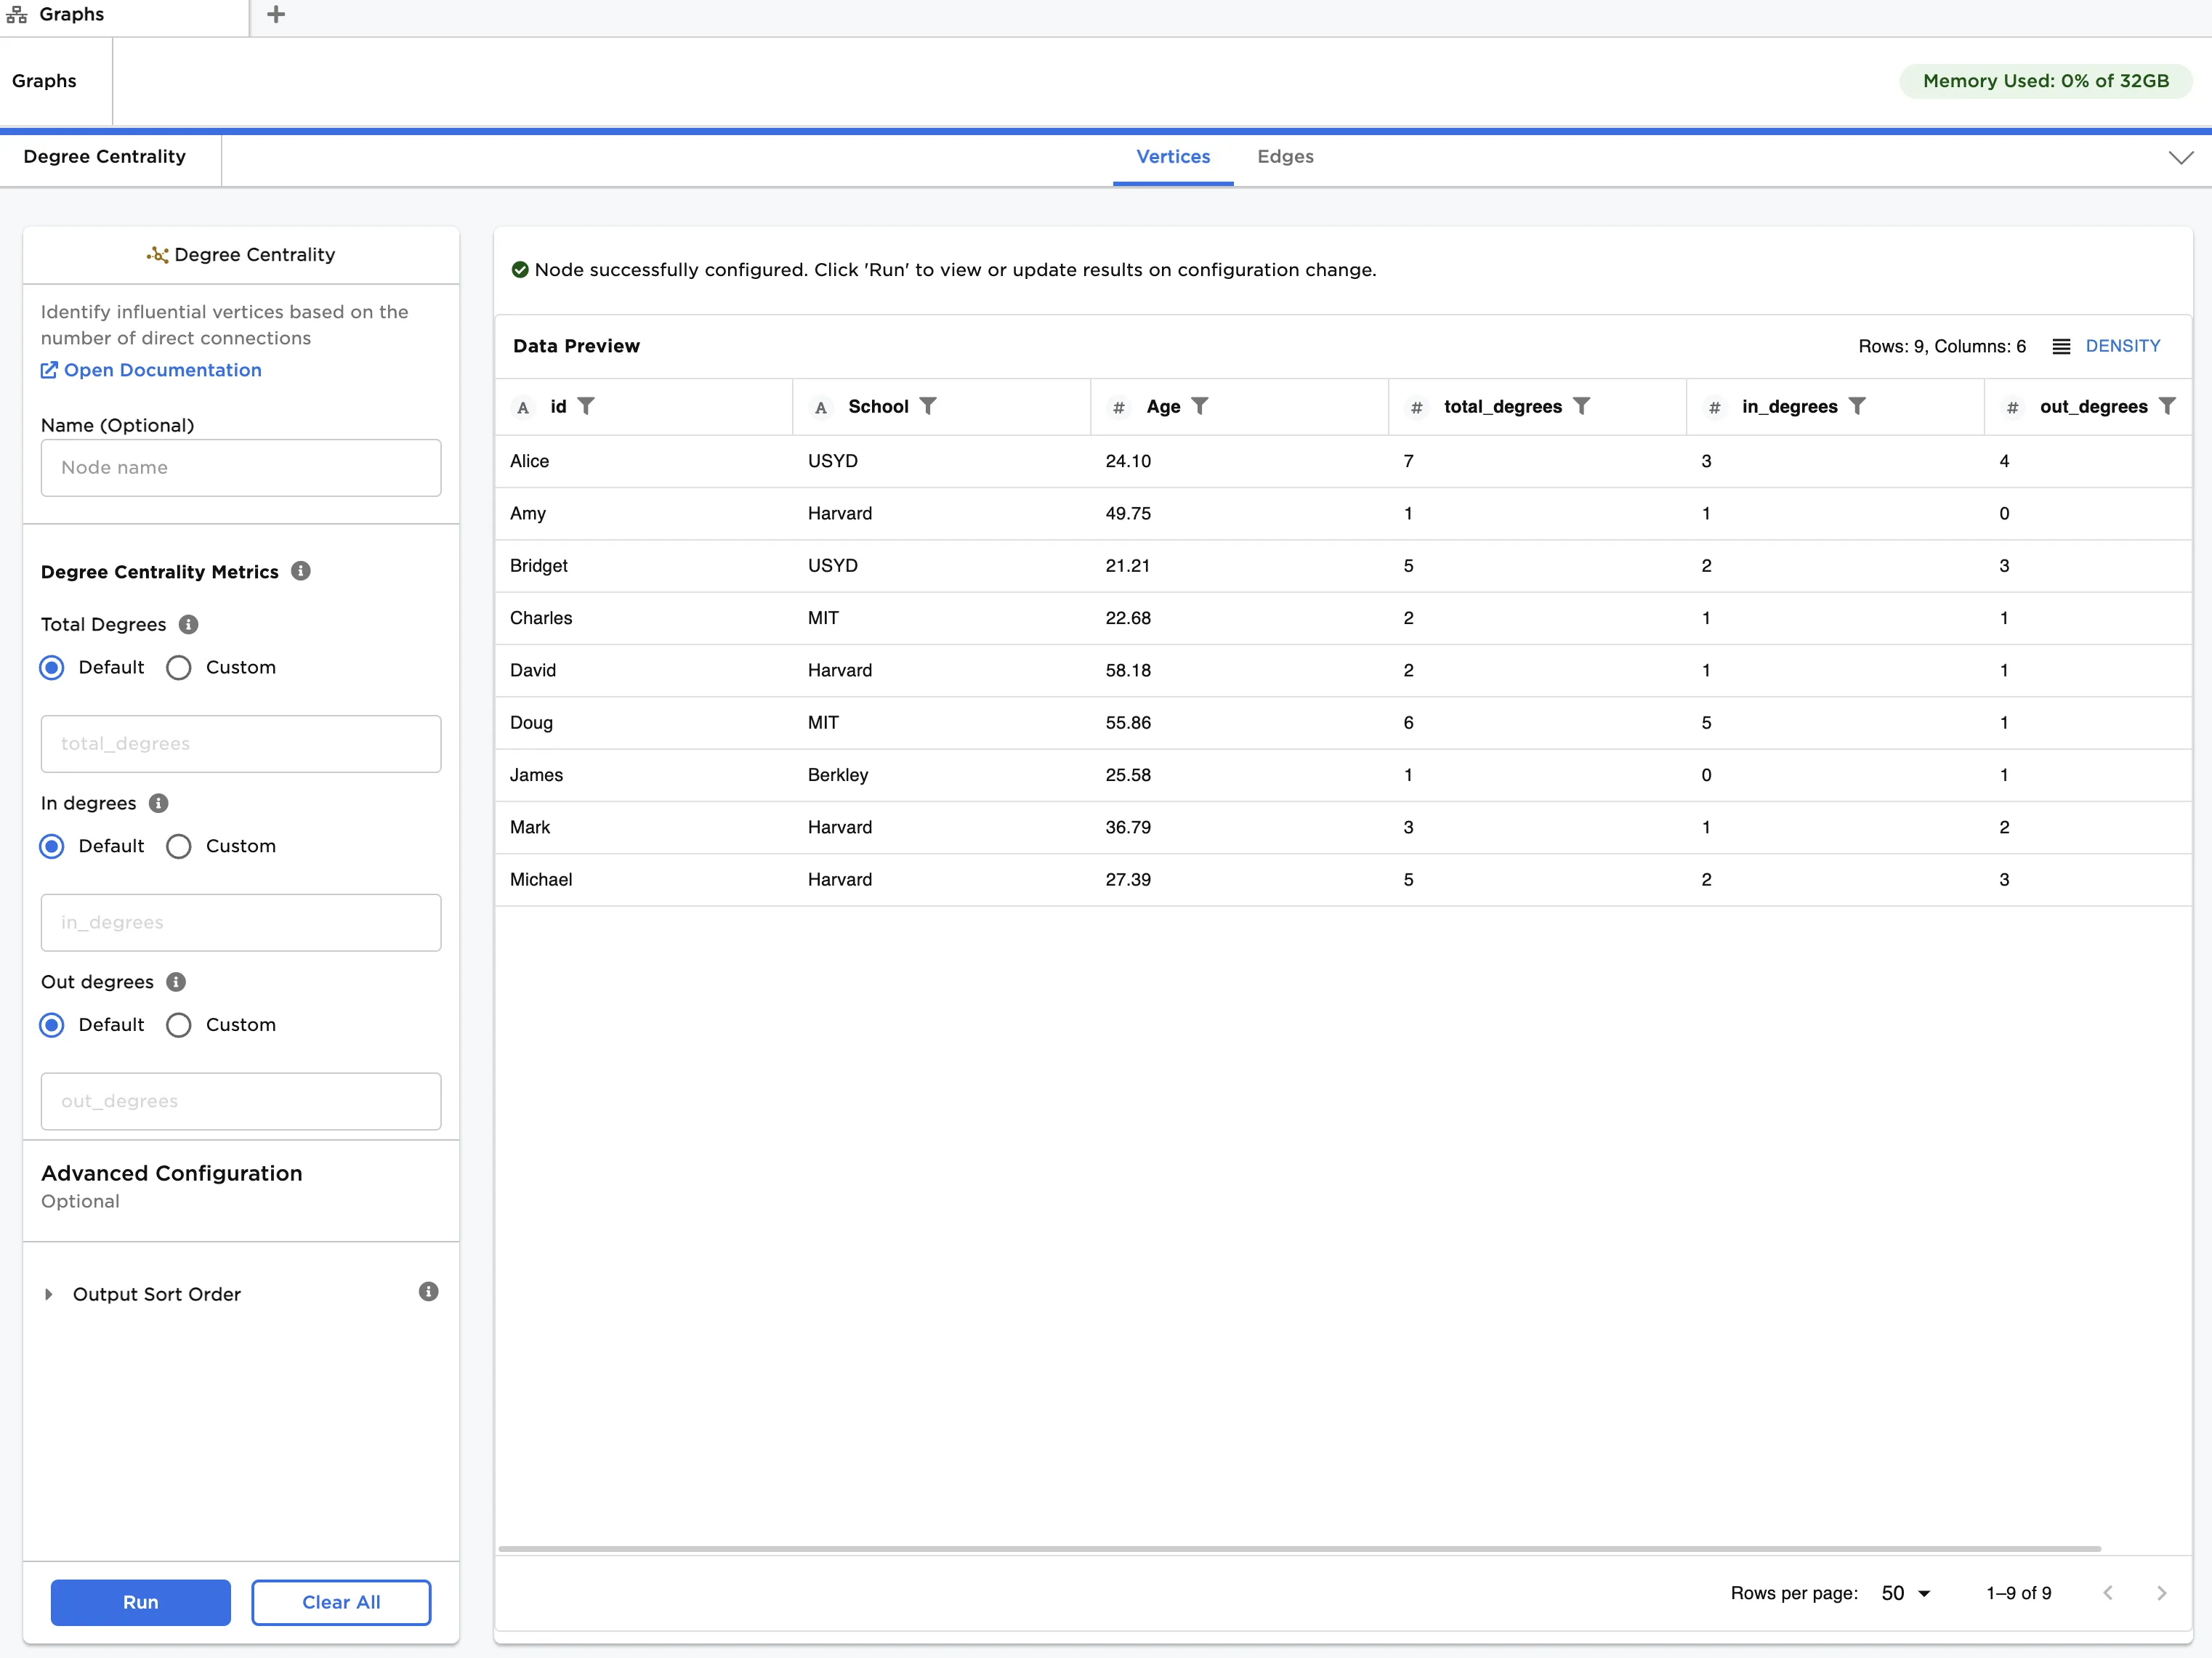
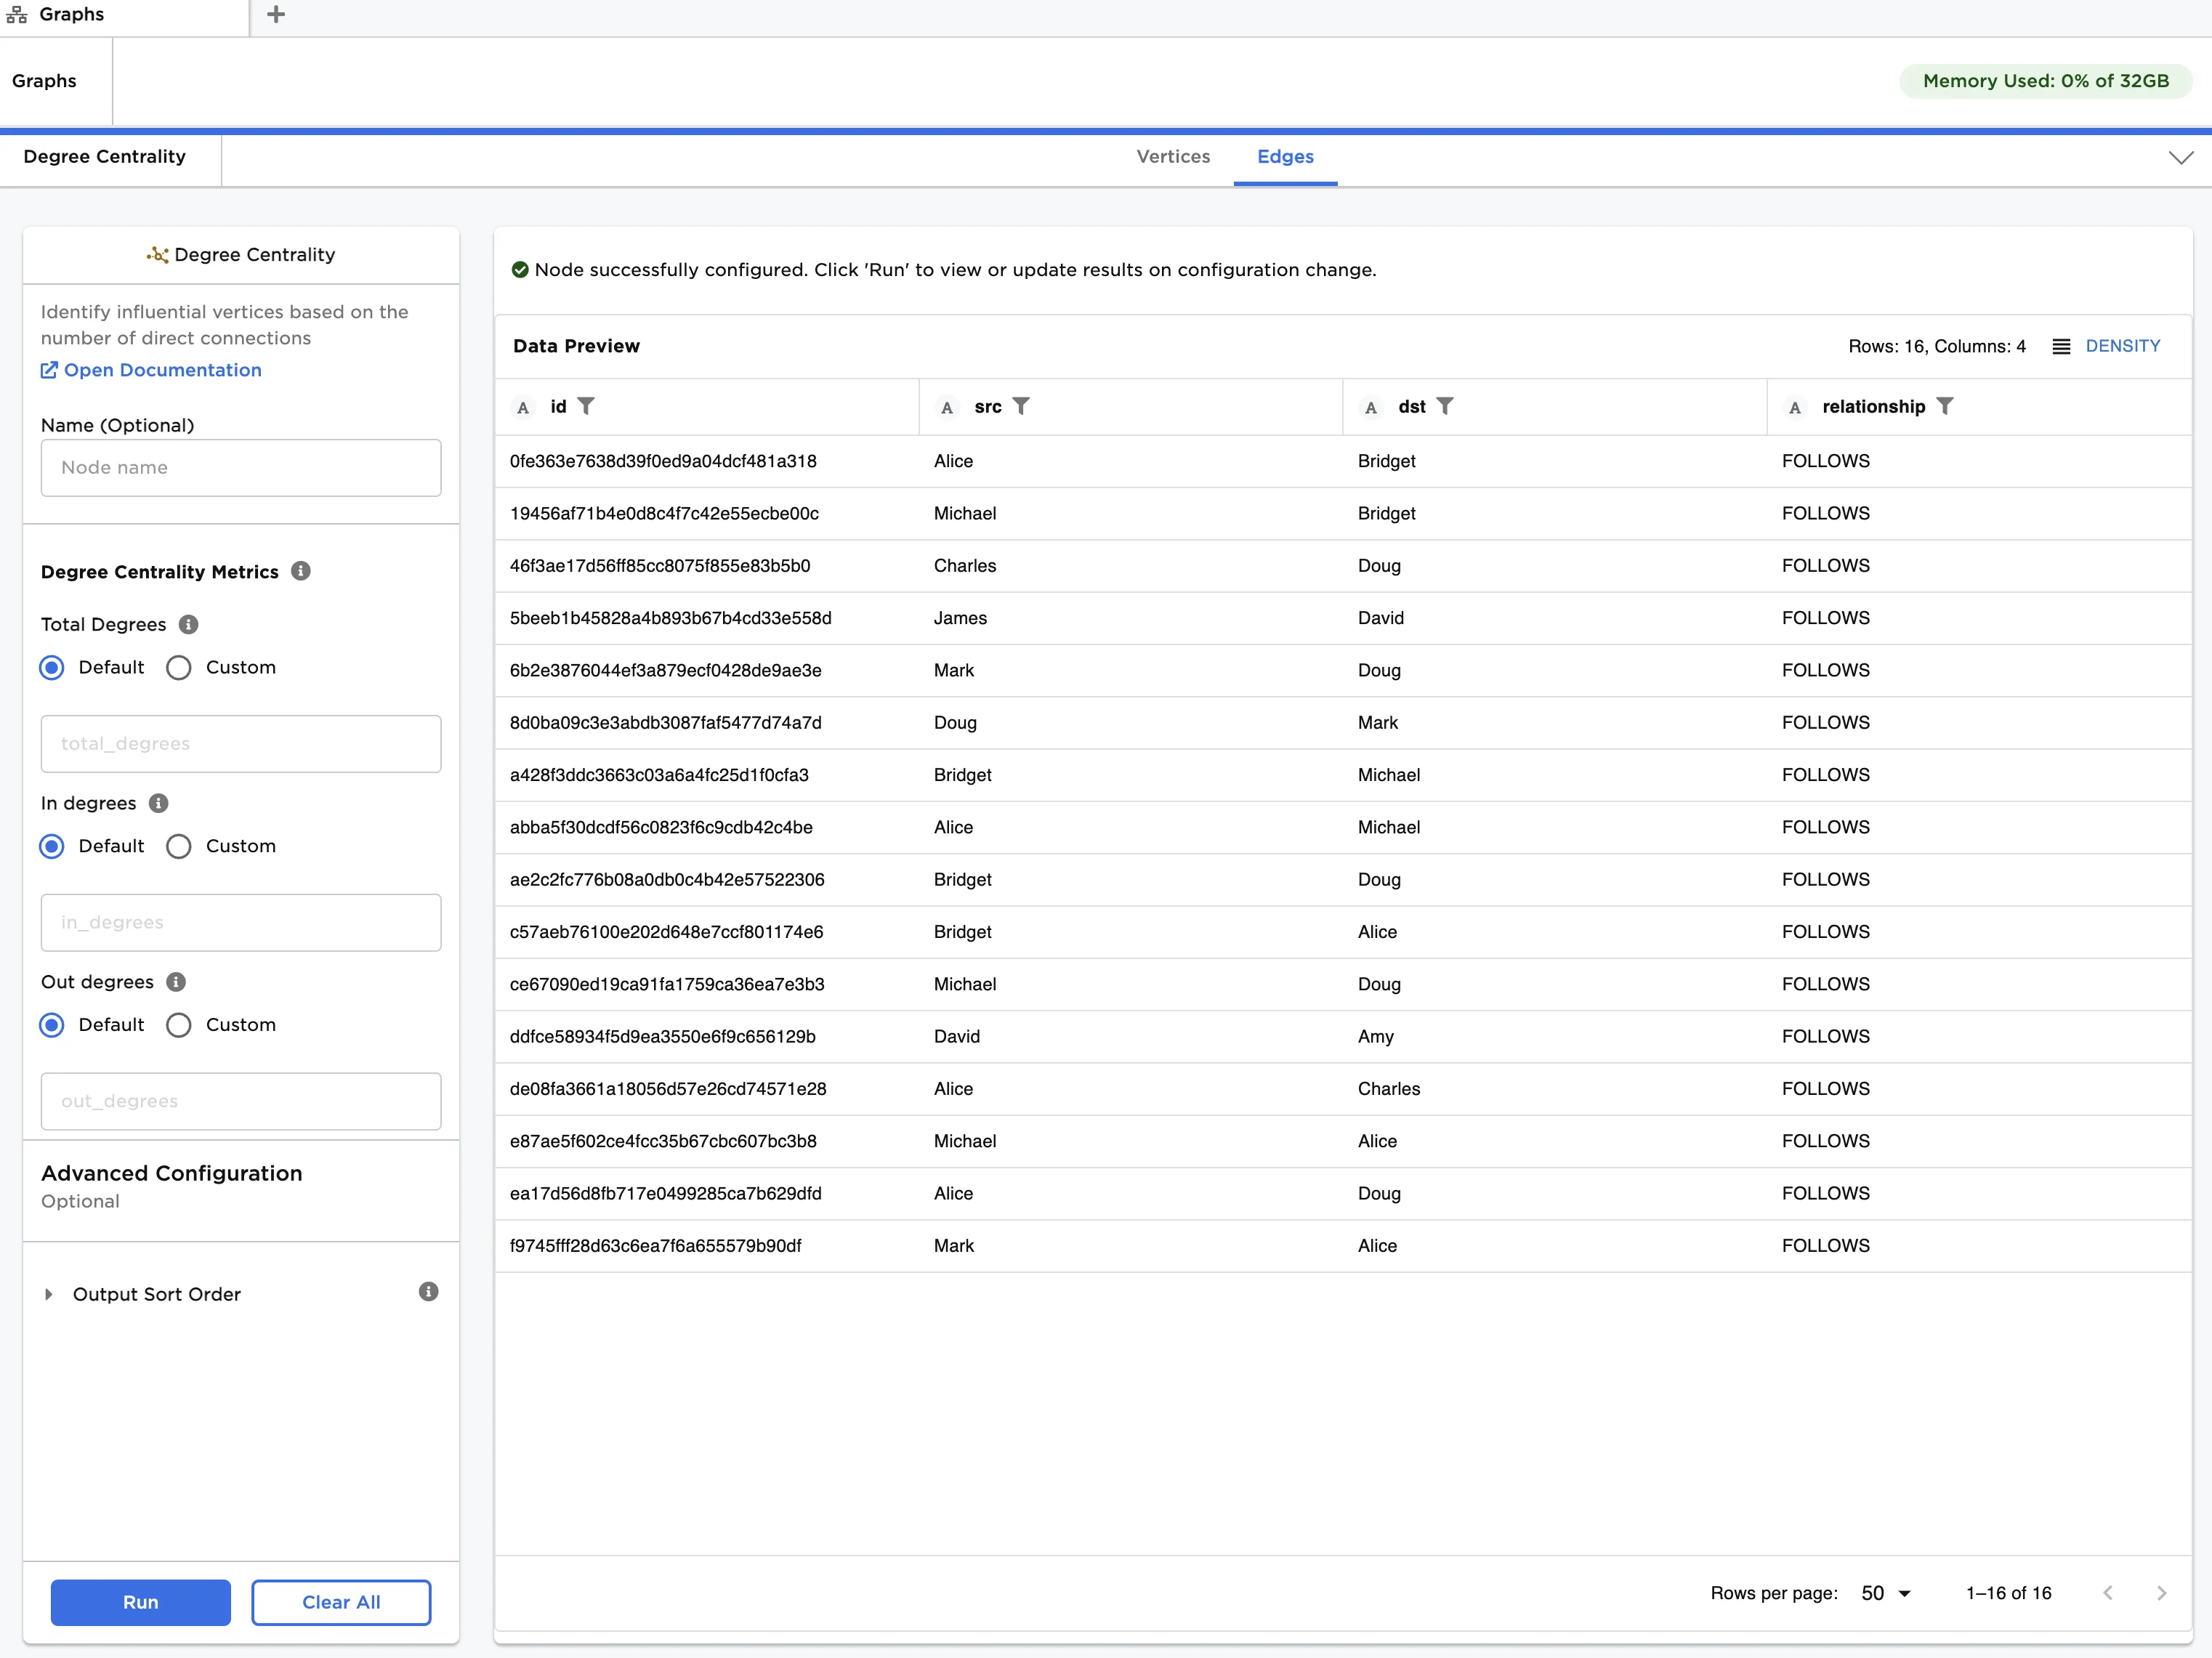
Figure 1: Example output
Examples
The data shown in Figure 2 is used in this example. It contains information about a group of students, and their connections within a social network. We create a graph from the data and then apply degree centrality to quantify incoming and outgoing connections.
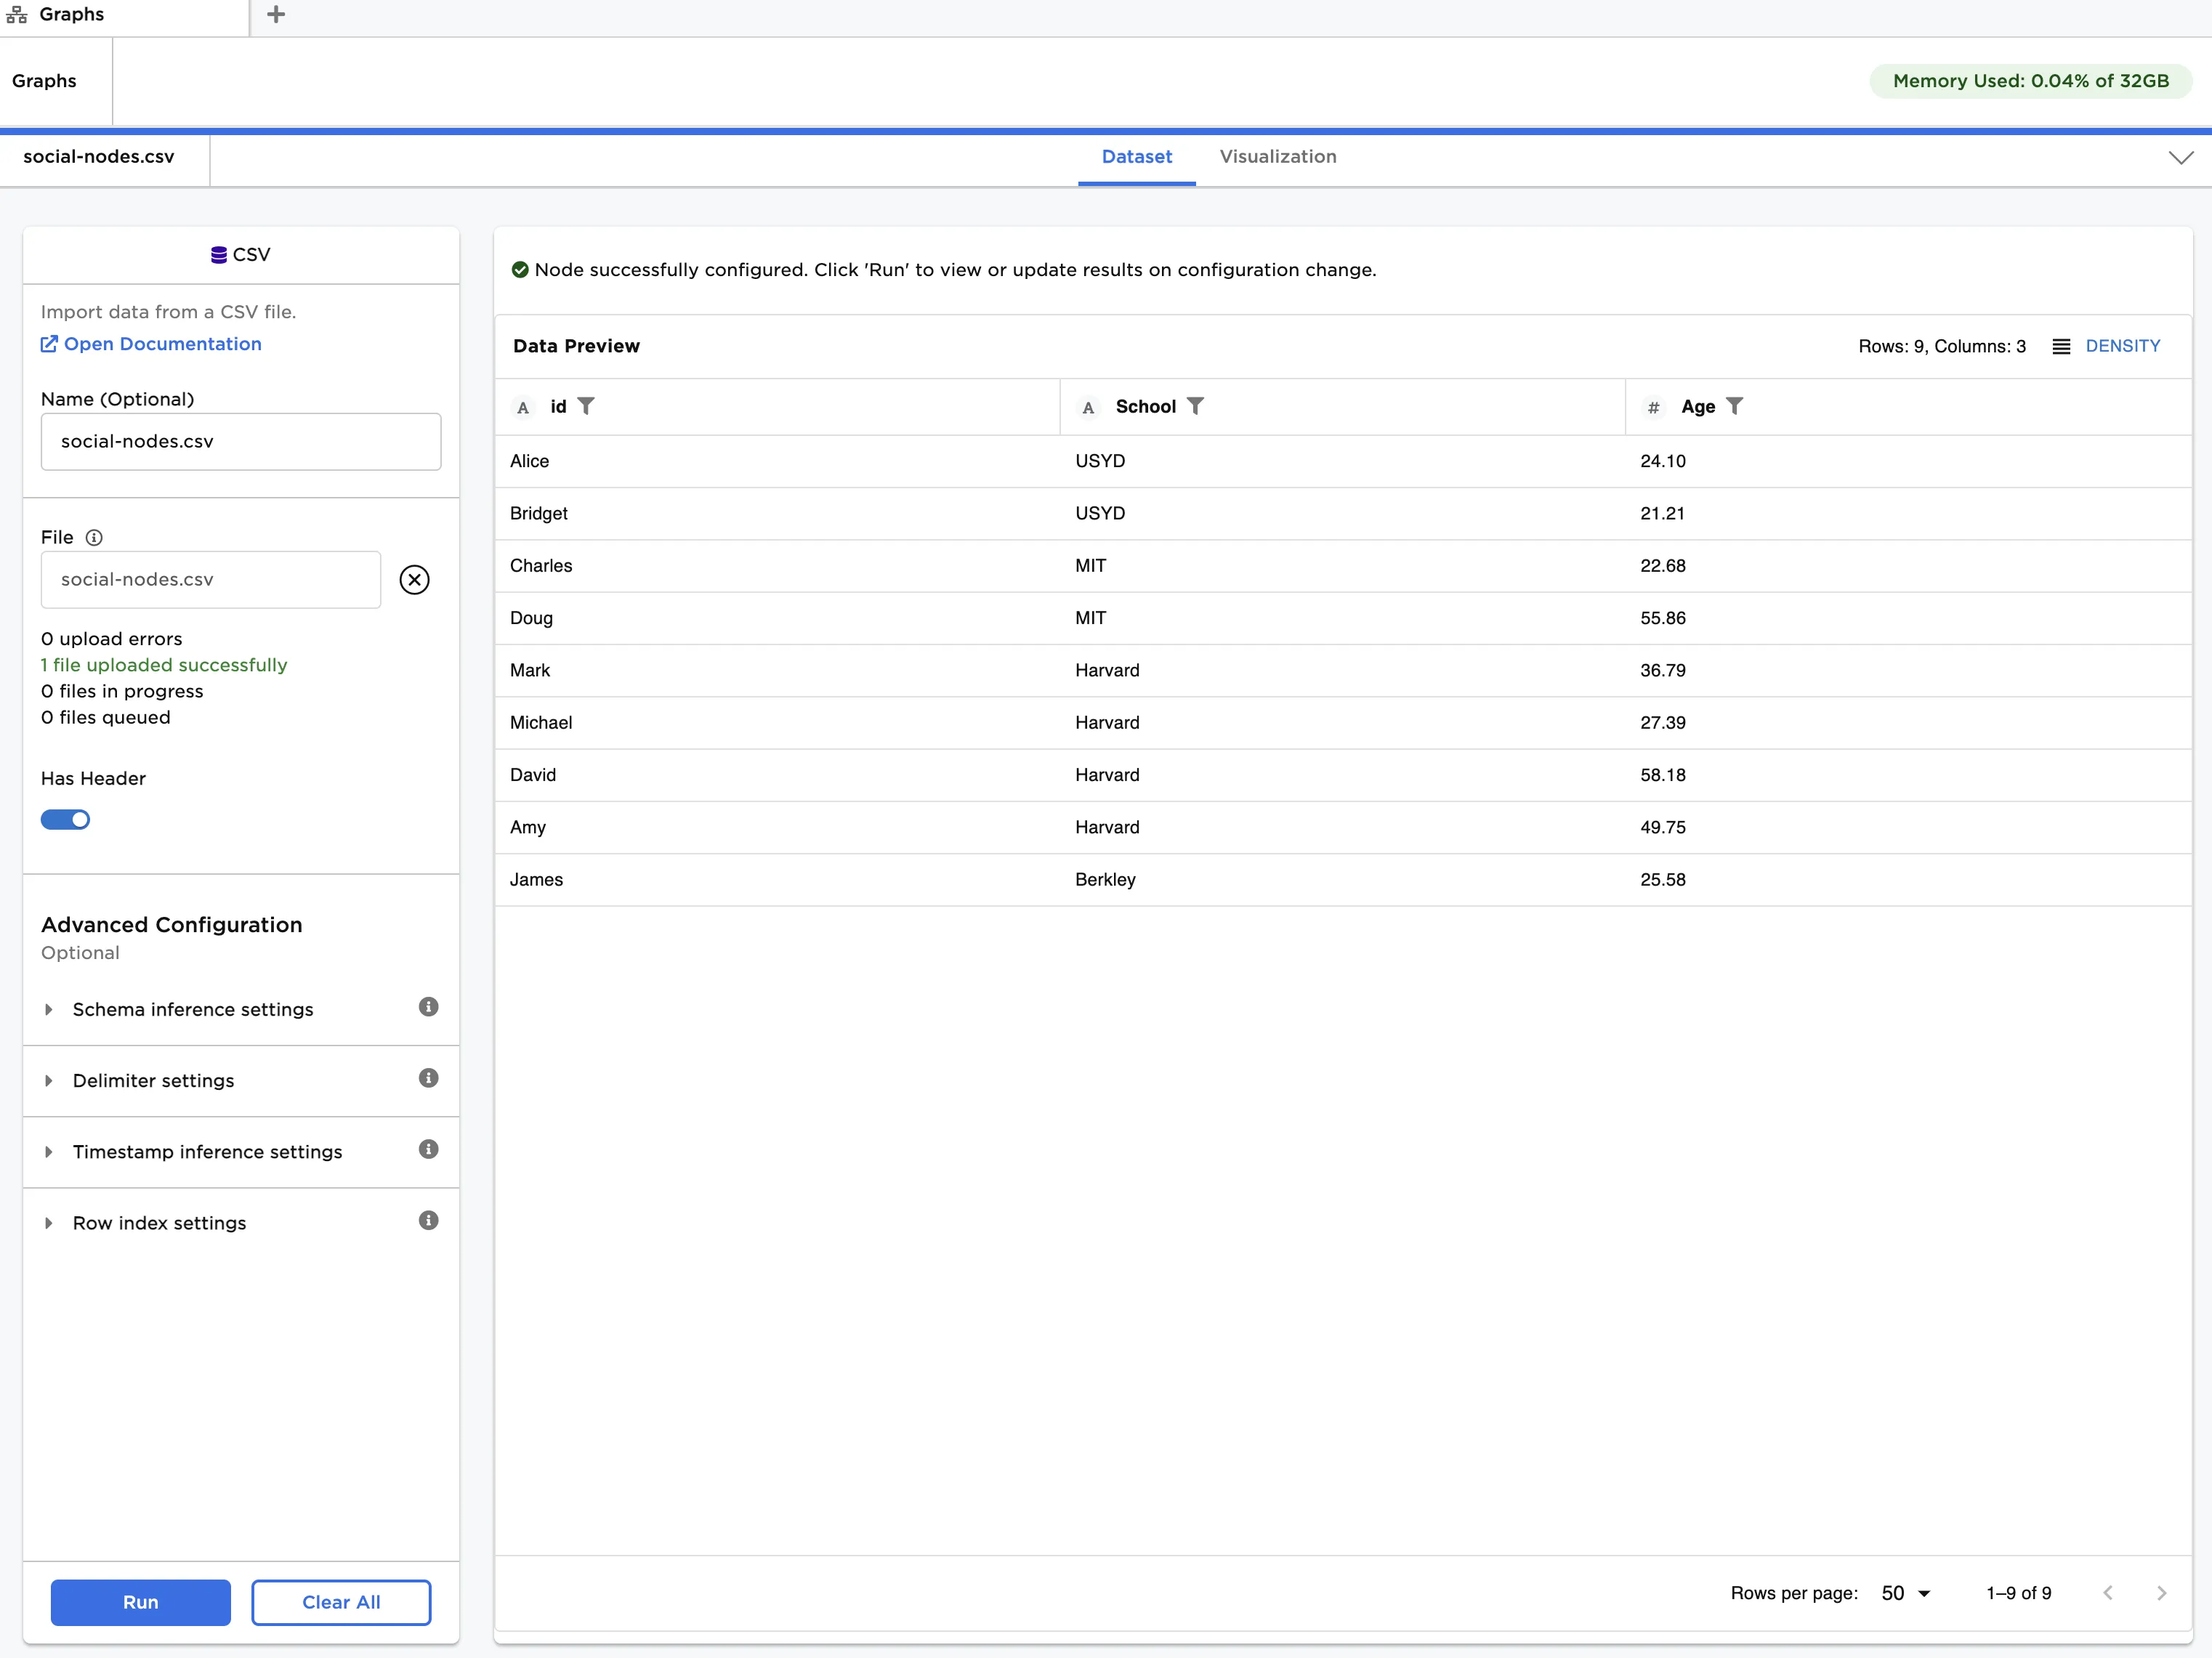
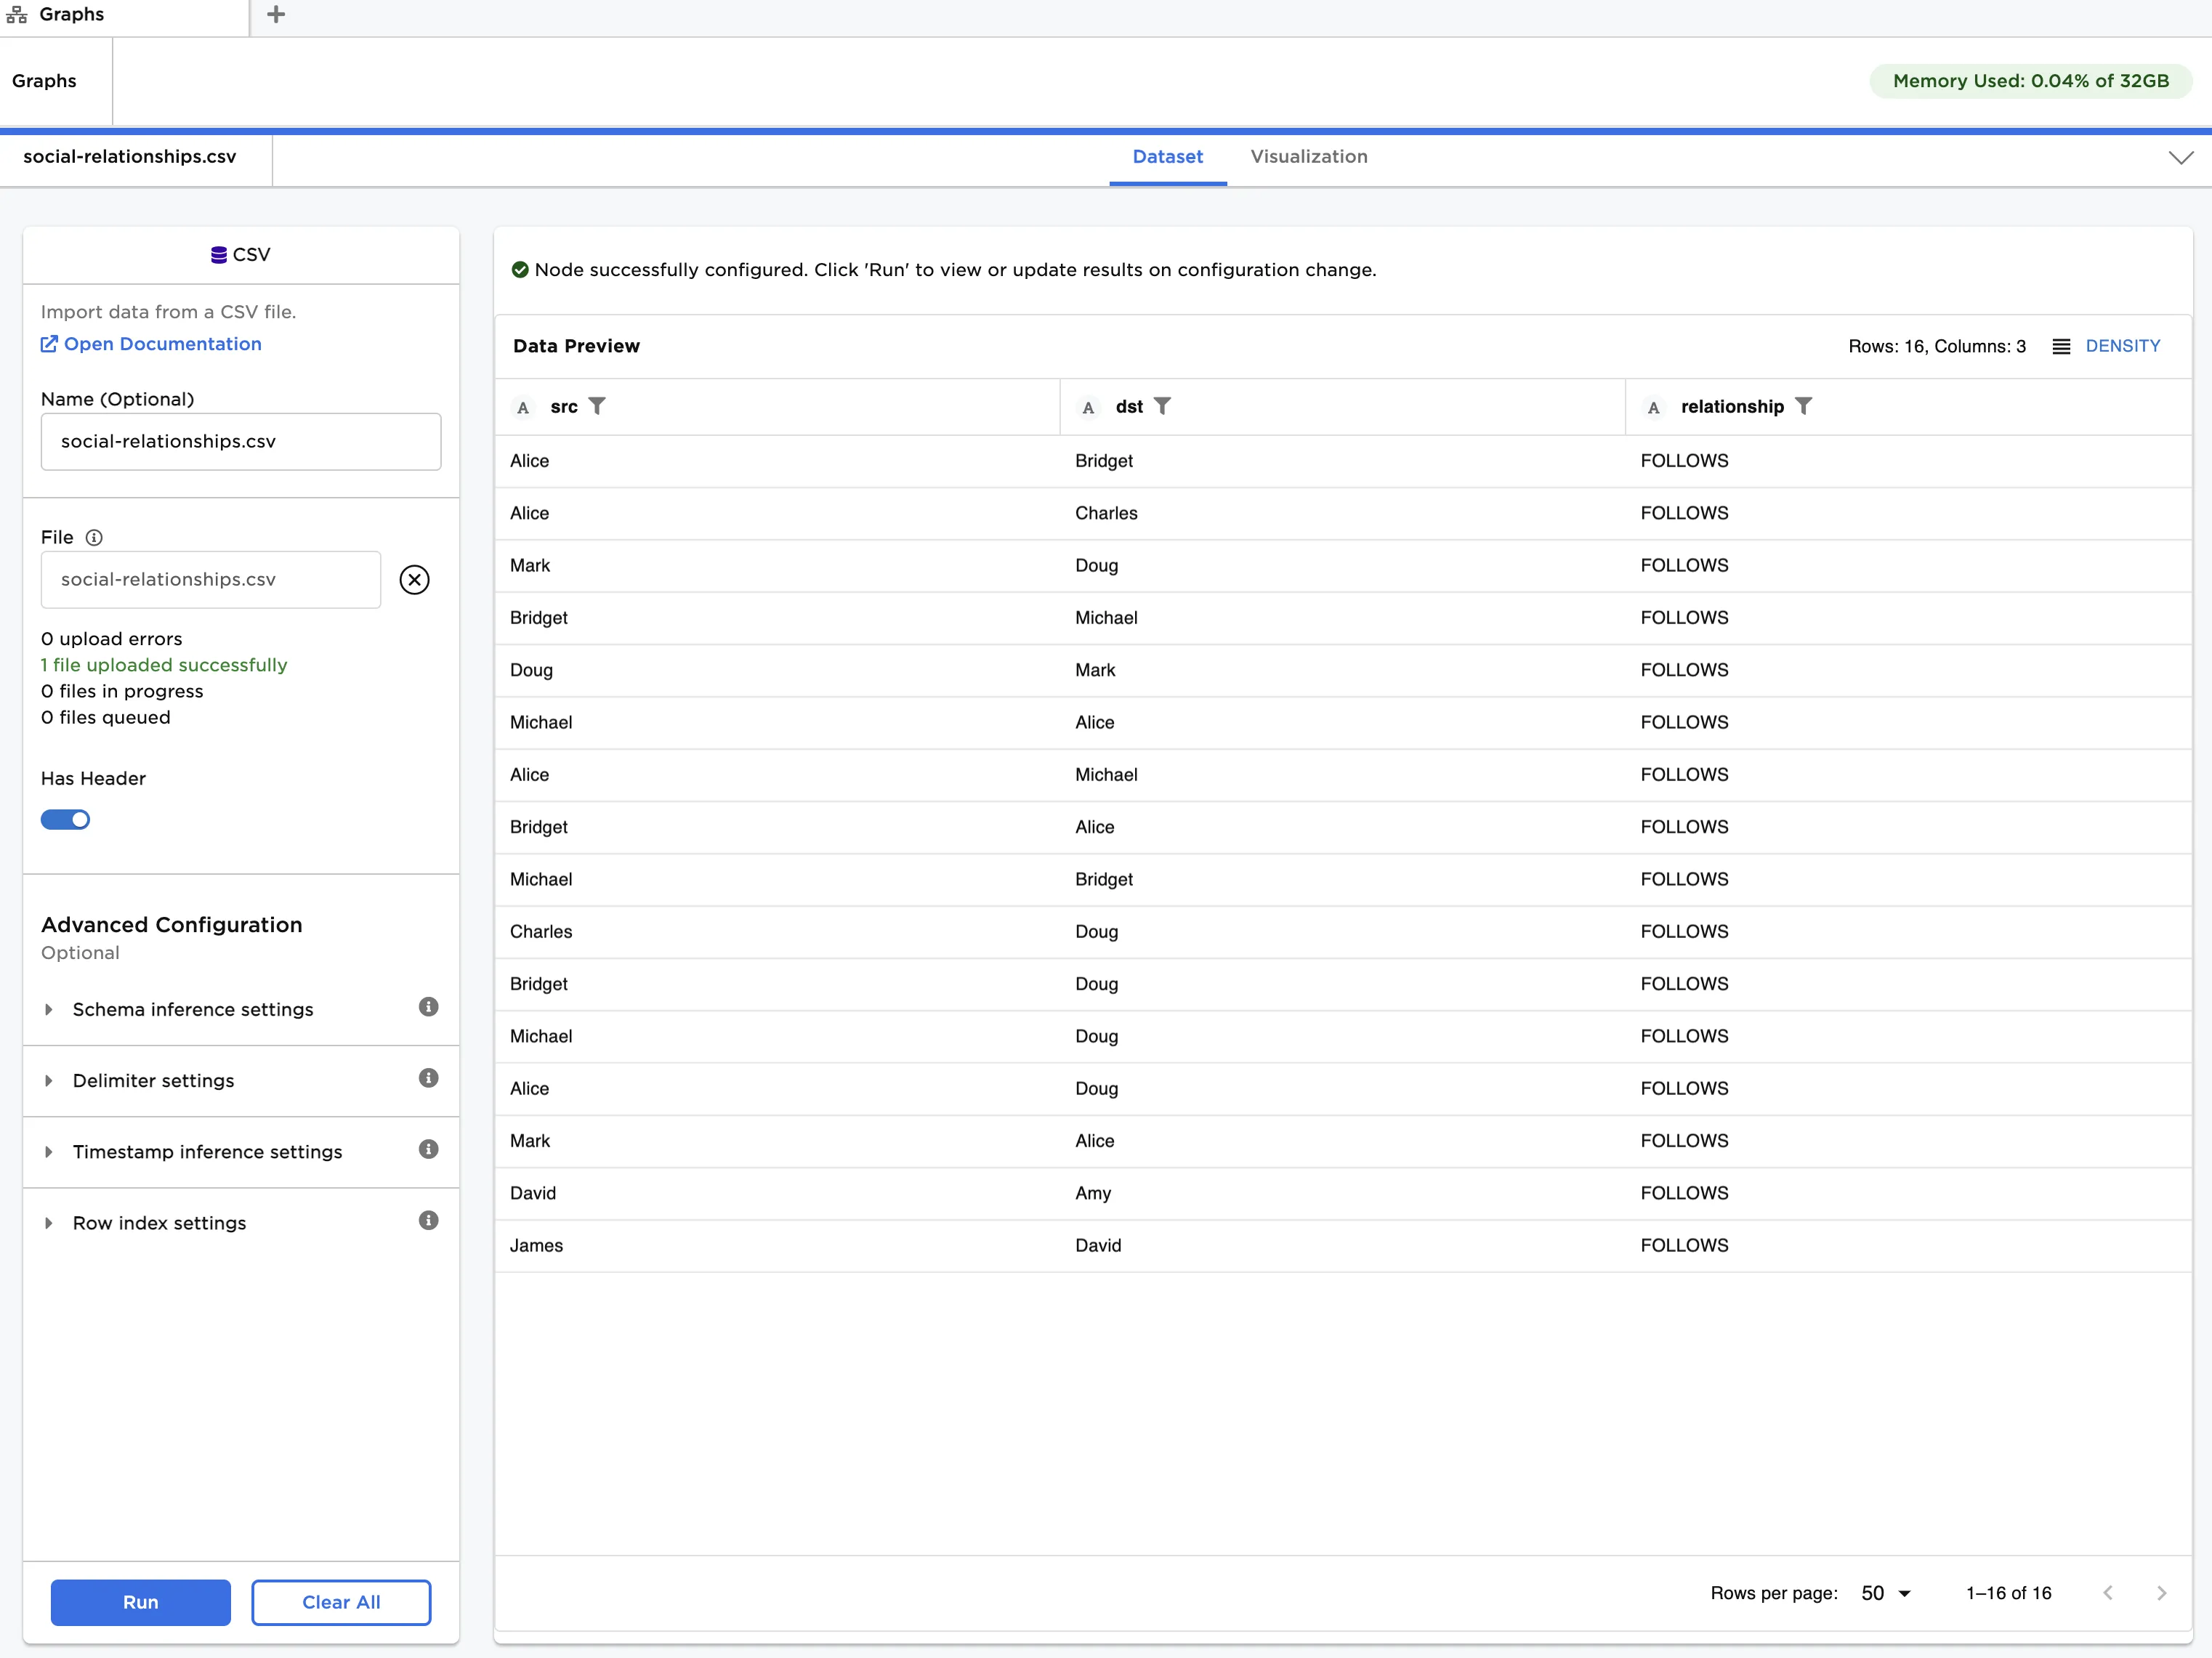
Figure 2: Example input data
The "degree_centrality_nodes.csv" file contains a list of students, their age and the school they attend. This data is used as vertices. The "degree_centrality_relationships.csv" file contains a list of connections between the students. Note that social media connections, where one person follows another, can be unidirectional or bidirectional. This data is used as edges.
First, create a graph from the input data:
- Load each dataset into a CSV node, and connect the nodes to an Assemble Graph node. Enusre the dataset with vertices is linked to the "Vertices" port, and the dataset with edges is linked to the "Edges" port.
- Select id (String) for Select Column with Vertex ids, src (String) for Select Source Columns and dst (String) for Select Destination Column.
- Click Run.
Next, apply degree centrality:
- Connect a Degree Centrality node to the output of the Assemble Graph node.
- Click Run.
The output data is the same as that in Figure 1. You can see that three additional columns showing the number of incoming, outgoing and total connections are appended to the dataframe in the Vertices tab. The Edges tab remains unchanged.