Connected Components
Apply the Connected Components algorithm to a C3 Al Visual Notebooks graph. The algorithm looks for groups of connected vertices such that each vertex in a group can be reached from any other vertex in the same group.
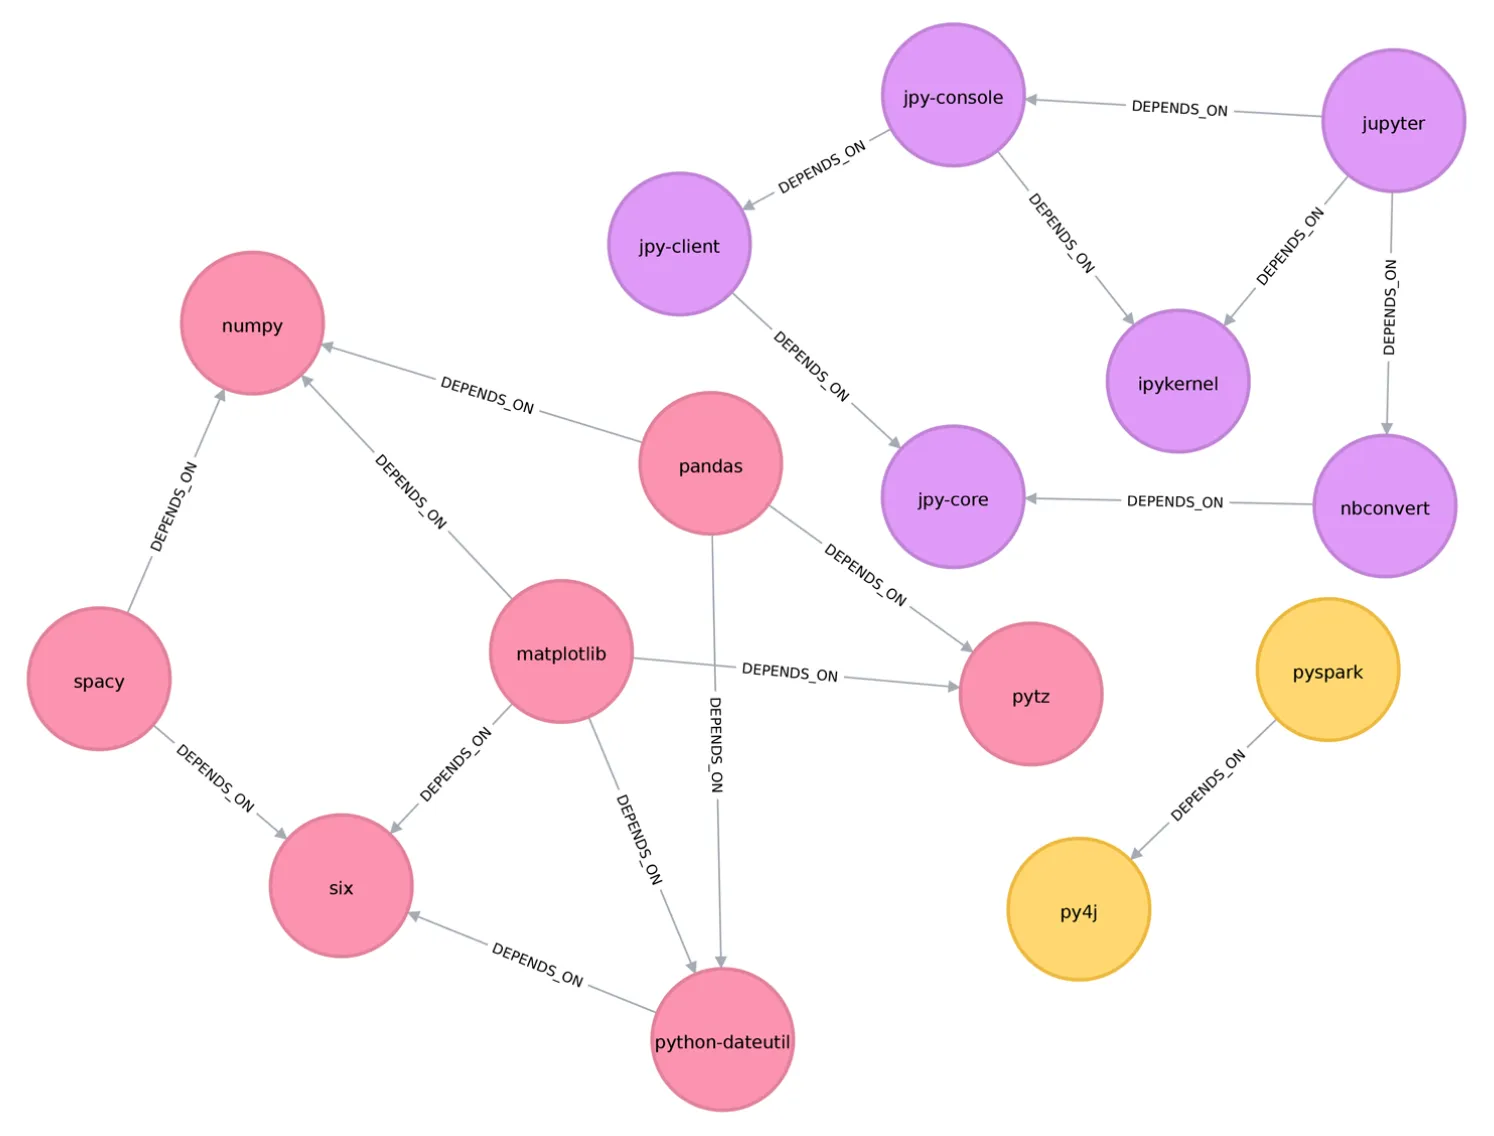
Figure 1: Example graph with three connected components¹
Configuration
| Field | Description |
|---|---|
| Name default=none | Field to name the node |
| A user-specified node name, displayed in the canvas and in the dataframe as a tab. | |
Connected Component ID default=component_id | Name of column for connected component ID |
| Specify a custom name, if desired, for the column containing connected component IDs. |
Node Inputs/Outputs
| Input | A Visual Notebooks graph, output from an Assemble Graph node |
|---|---|
| Output | Vertices and edges that can be used with a Graph node |
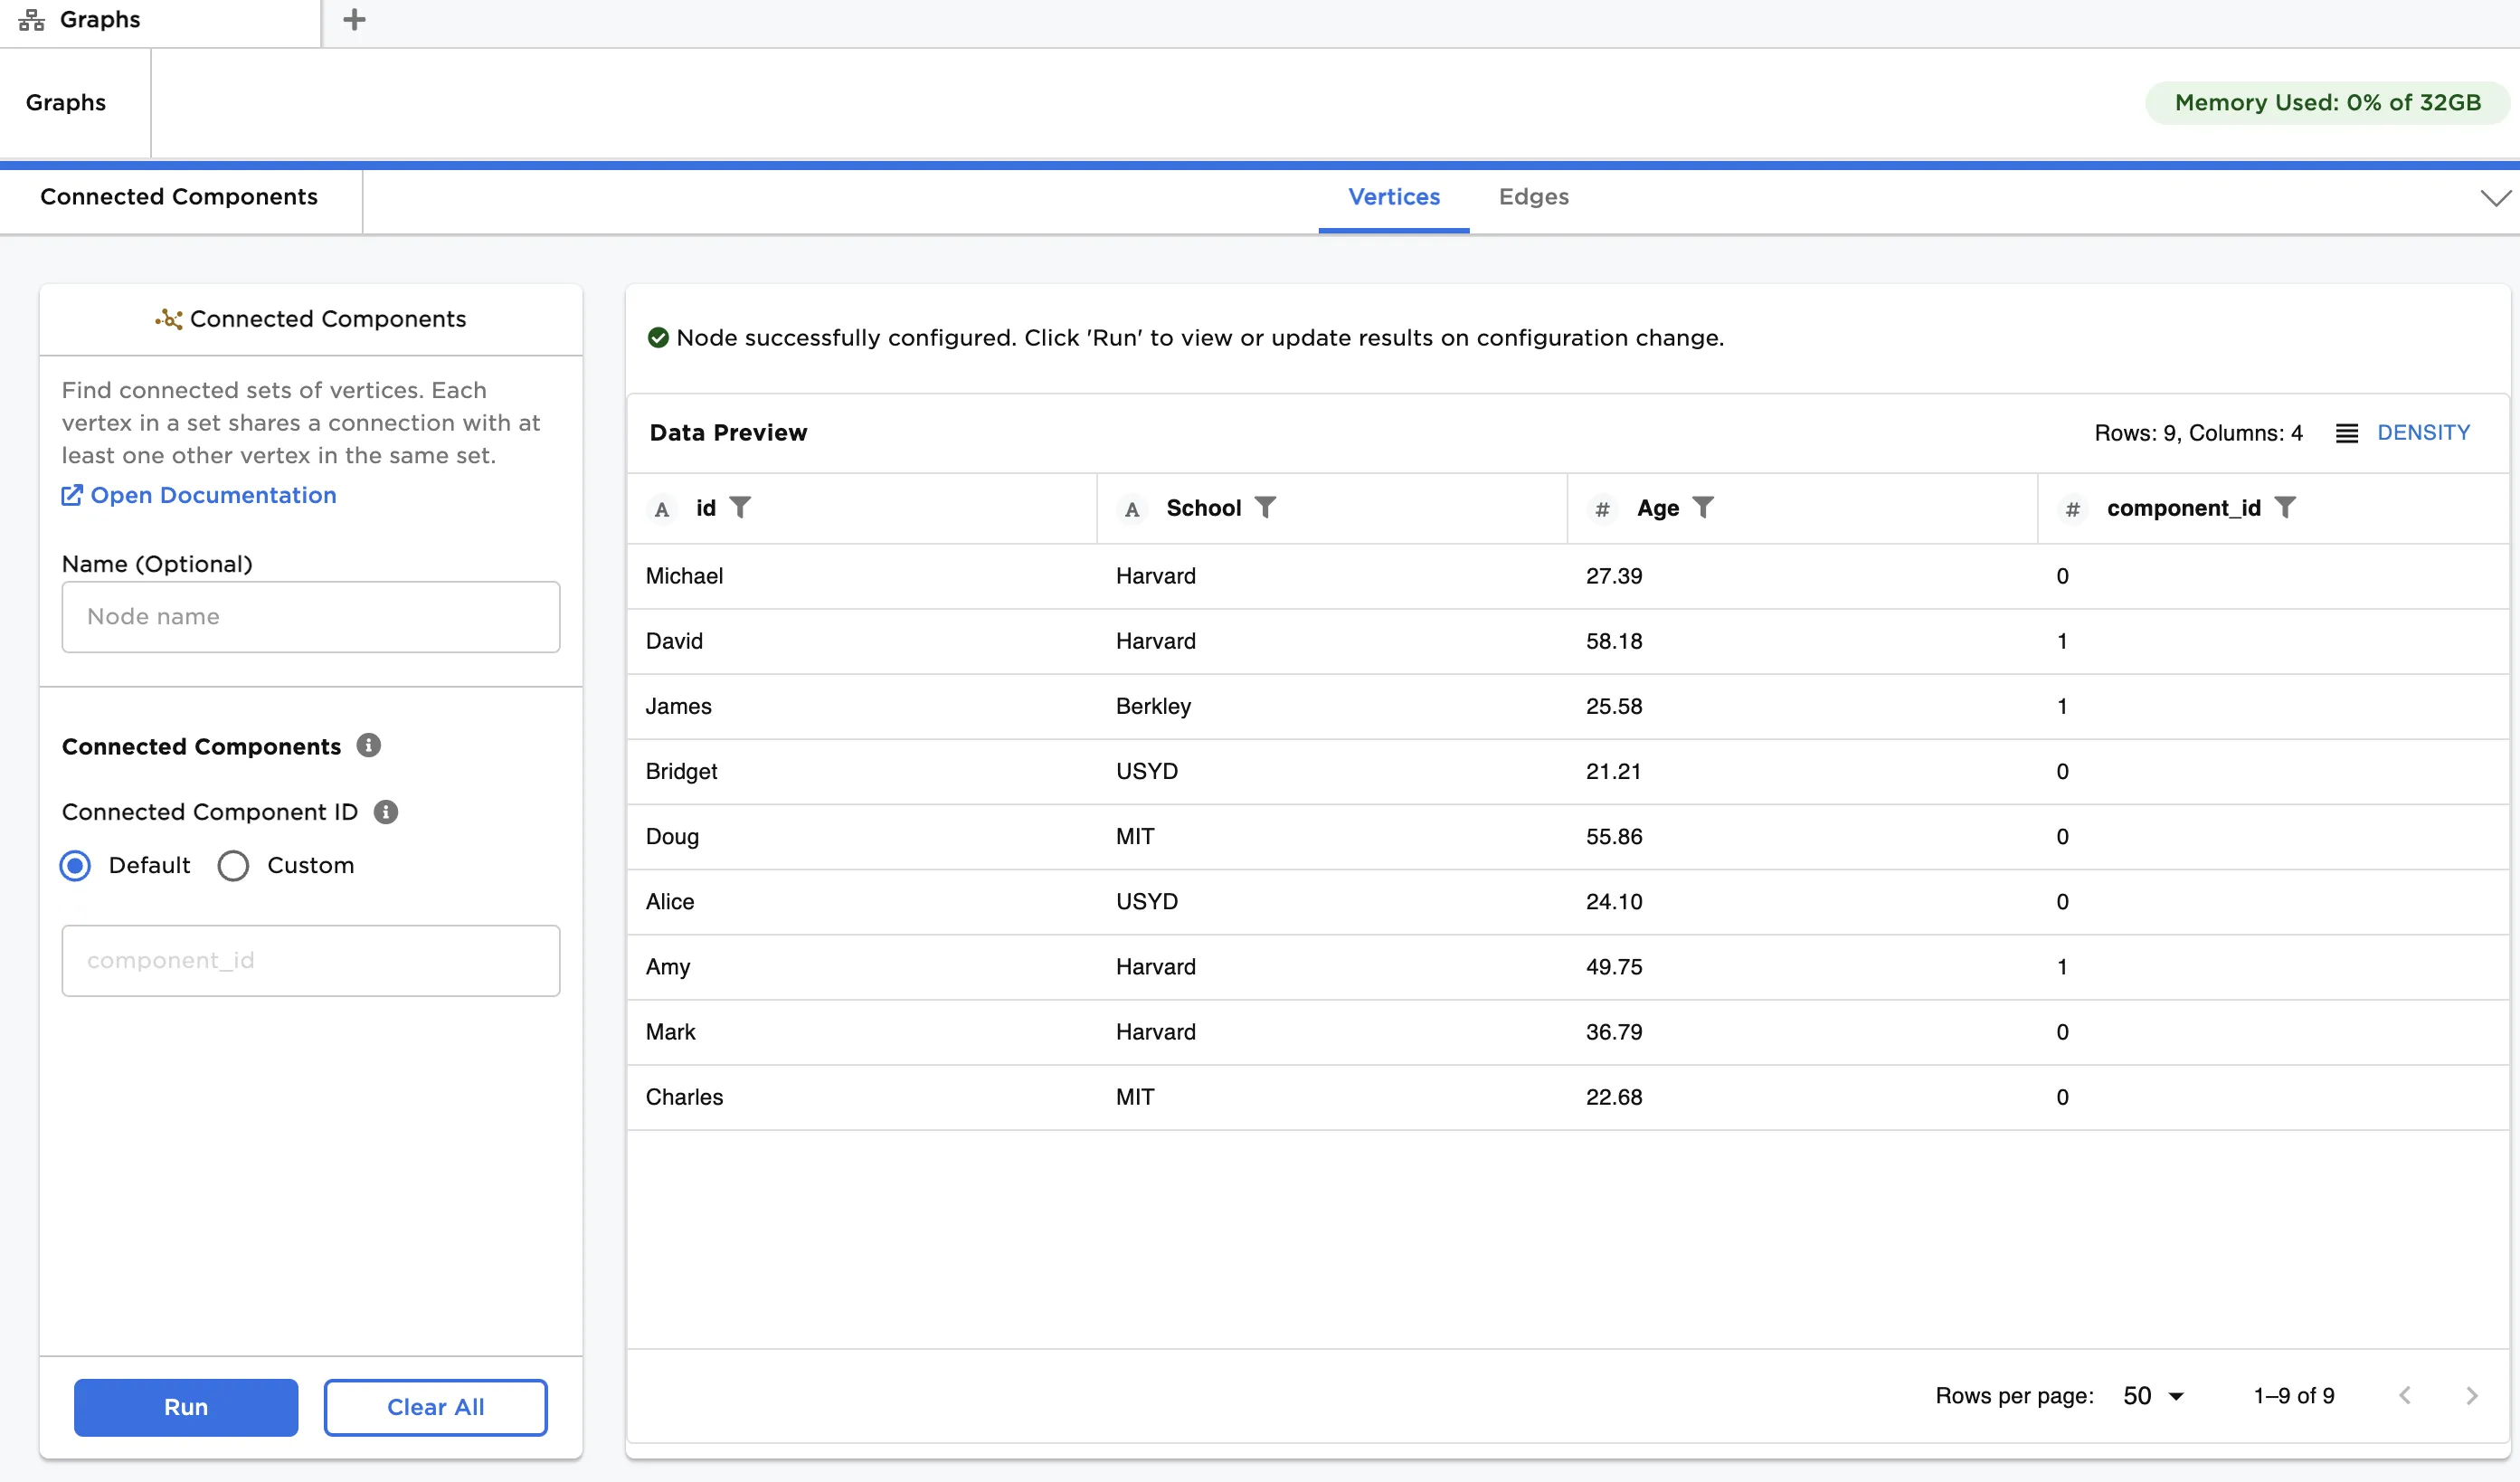
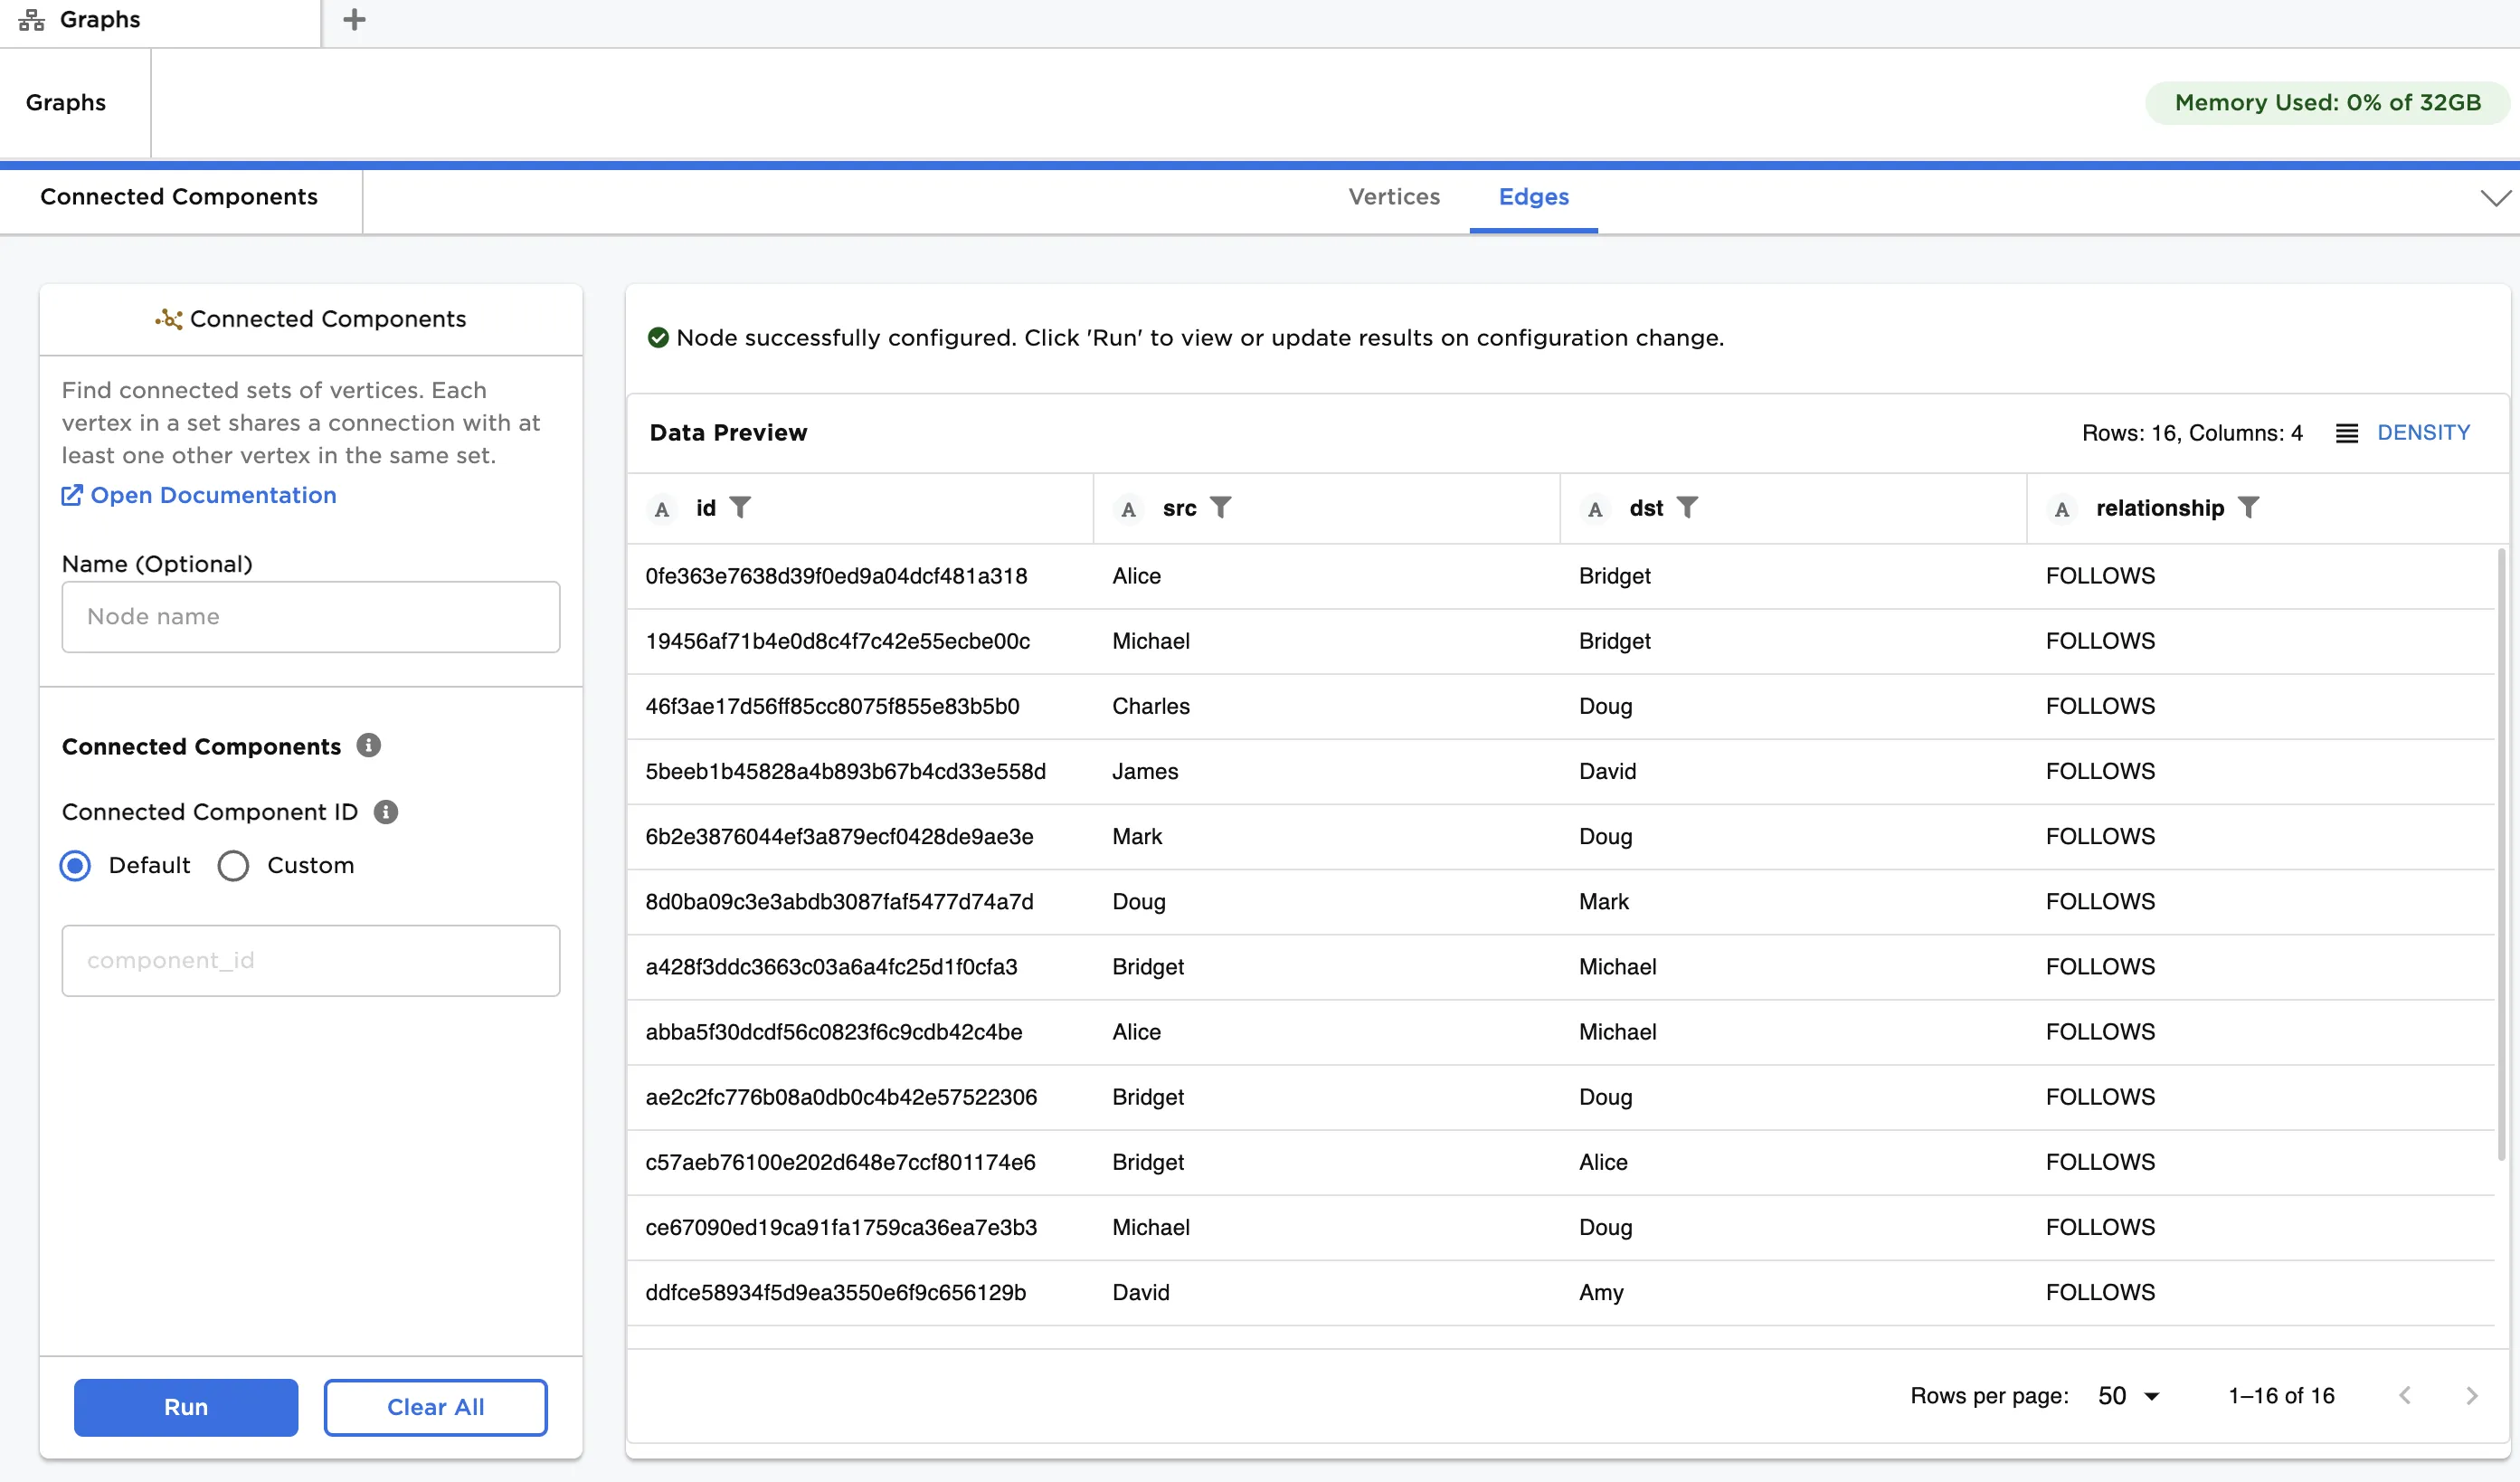
Figure 2: Example output
Examples
The data shown in Figure 3 is used in this example. It contains information about a group of students, and their connections within a social network. We create a graph from the data and then apply connected components to provide insight into the network structure.
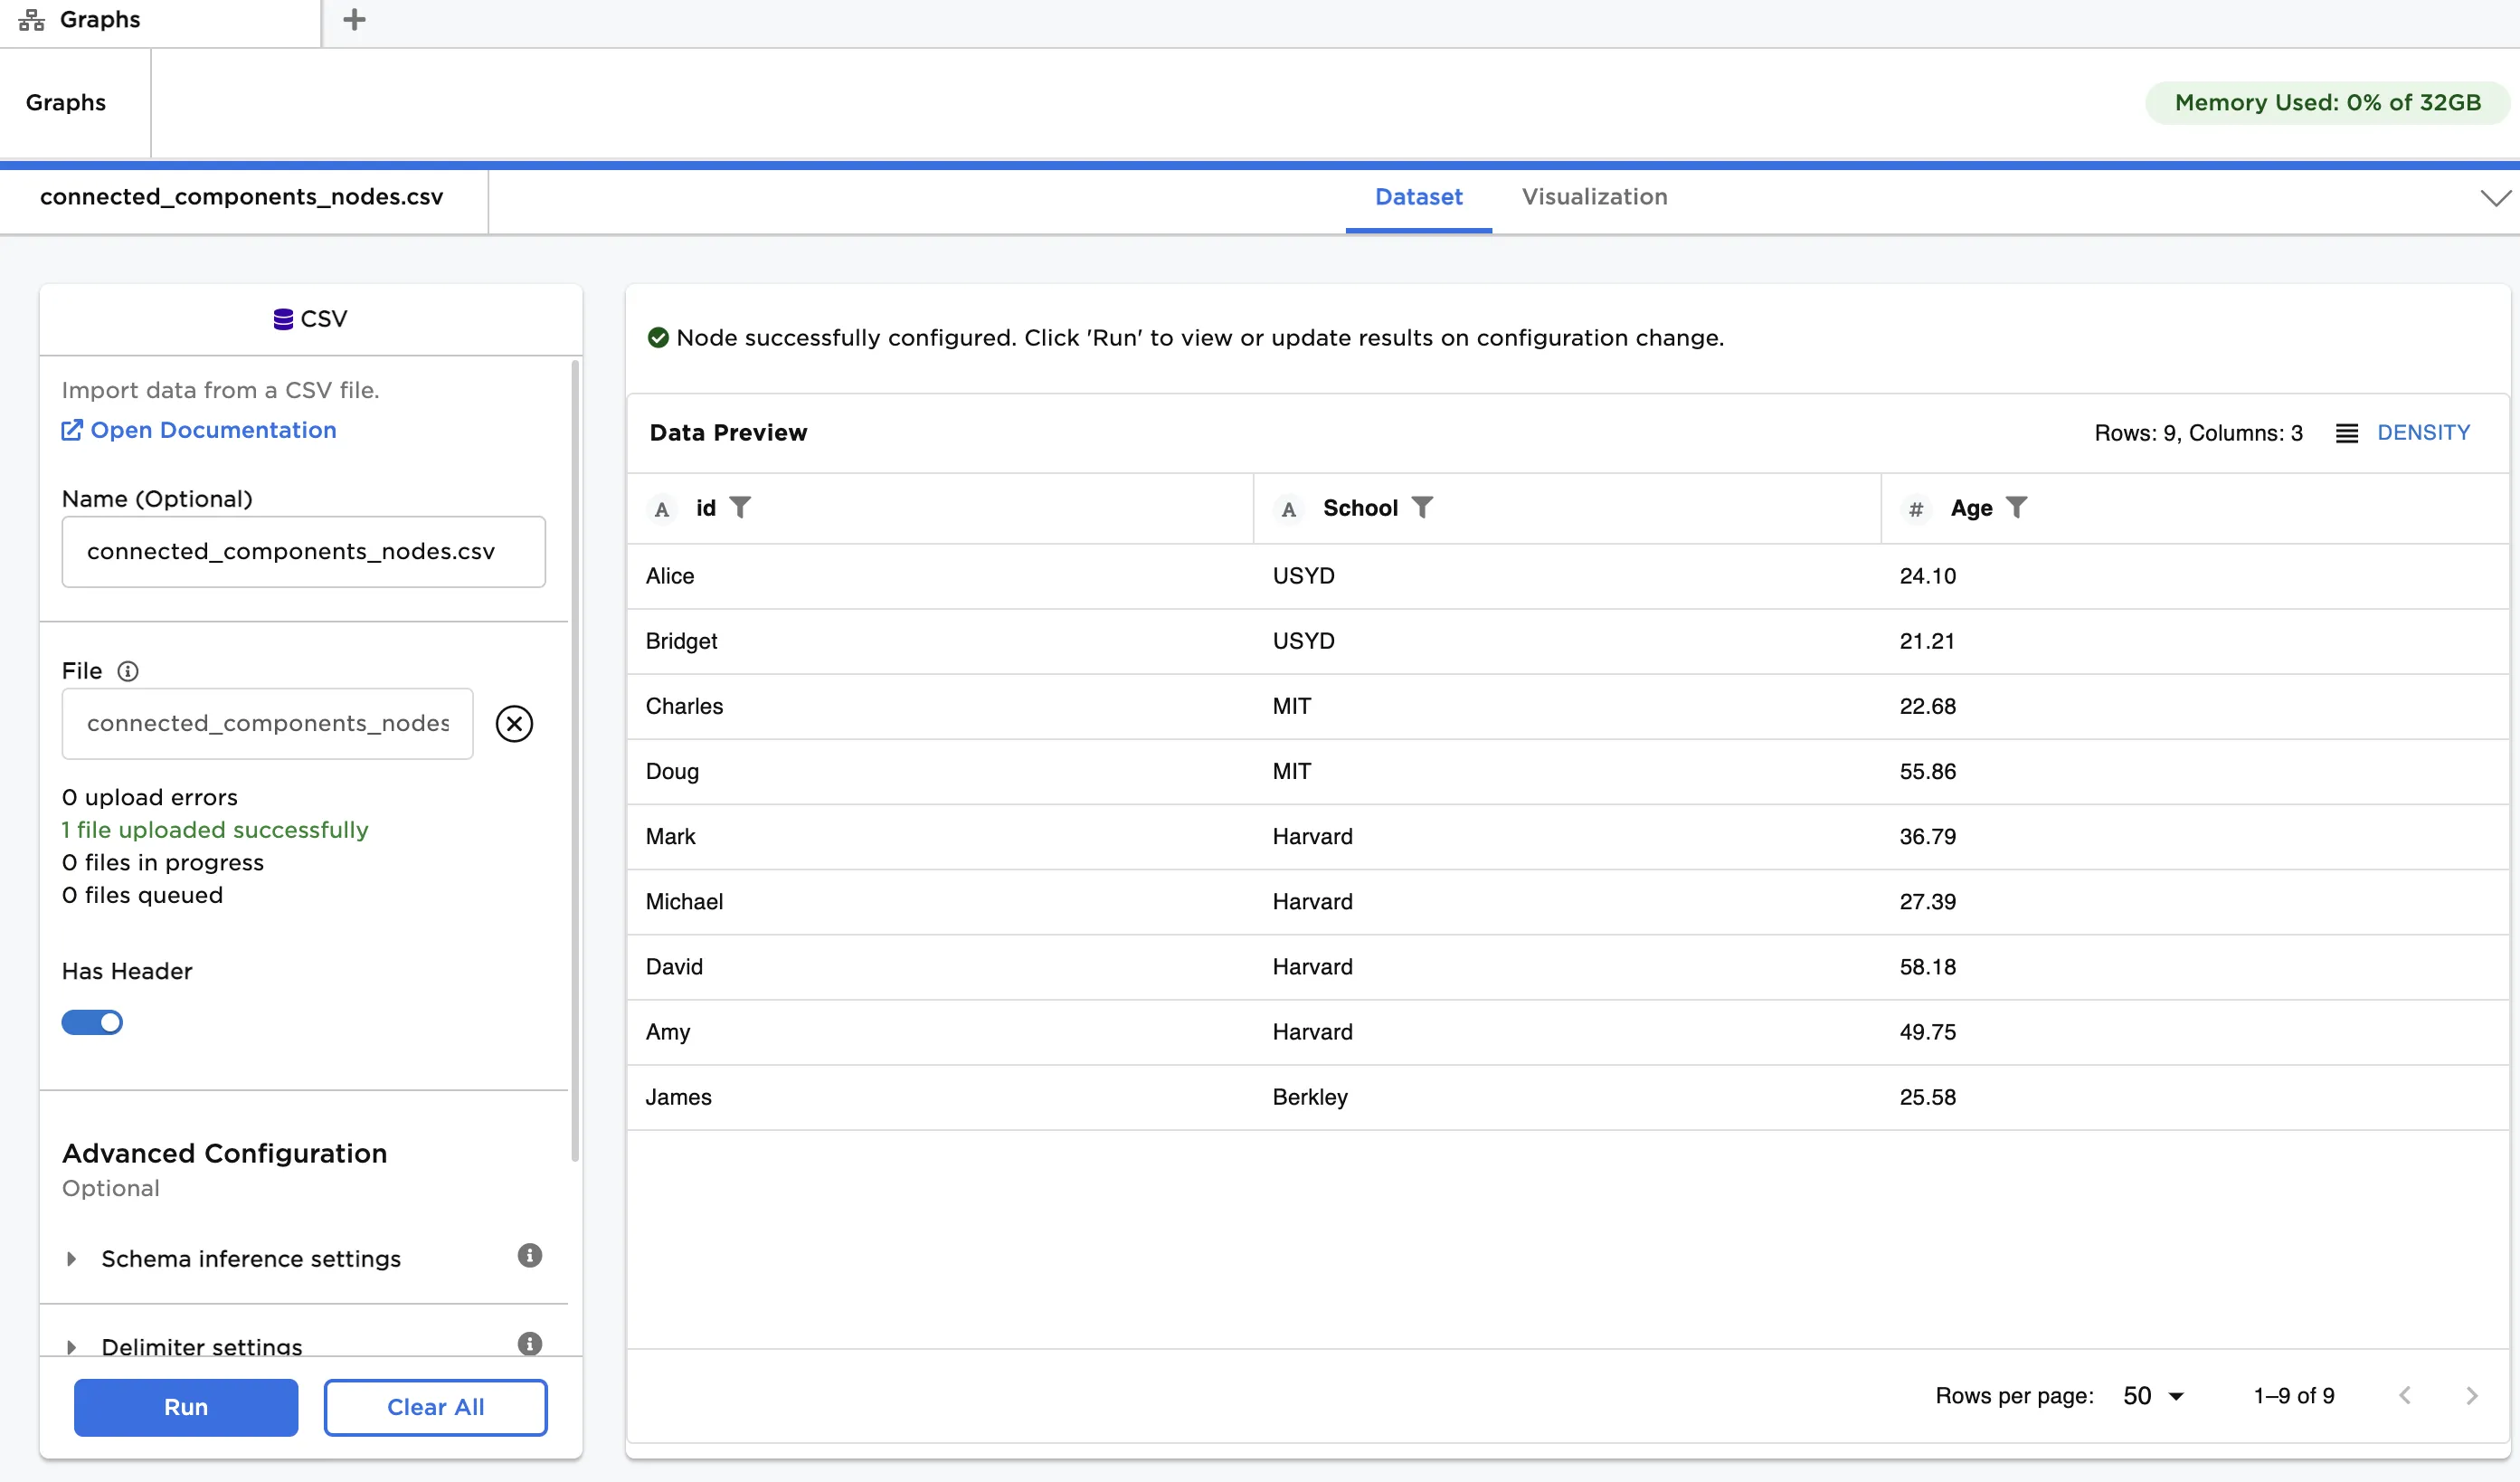
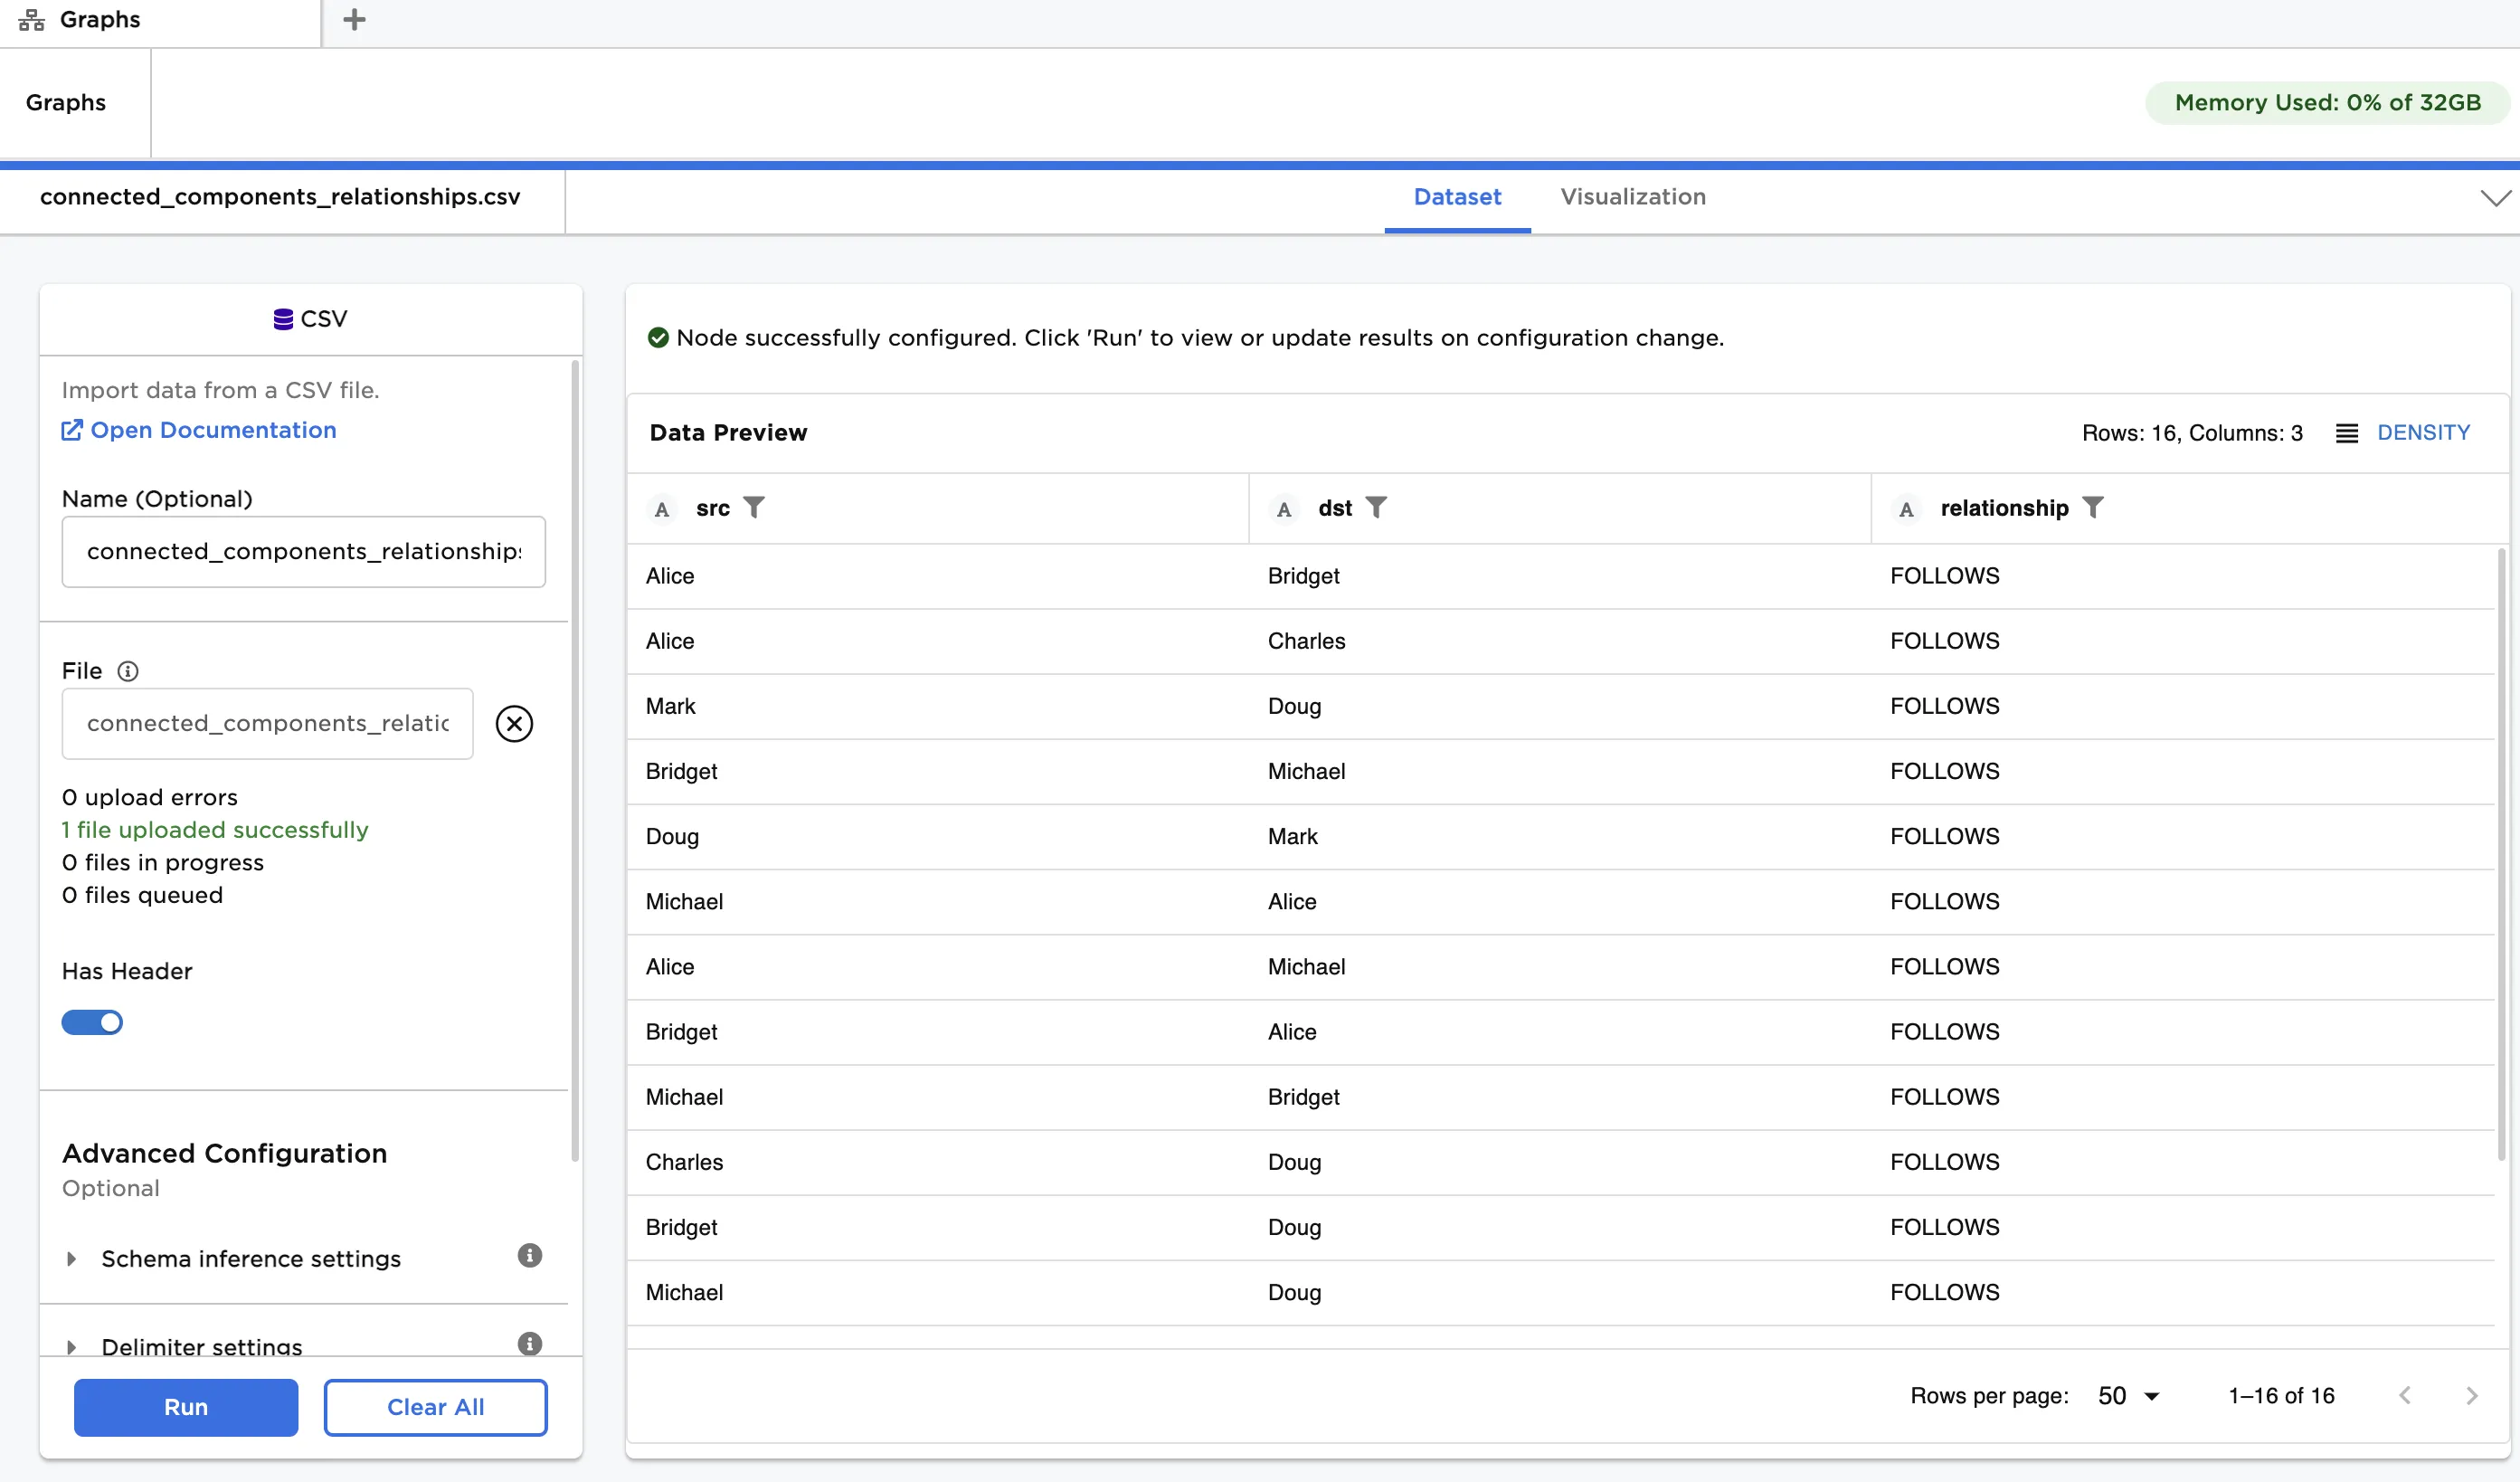
Figure 3: Example input data
The "connected_components_nodes.csv" file contains a list of students, their age and the school they attend. This data is used as vertices. The "connected_components_relationships.csv" file contains a list of connections between the students. Note that social media connections, where one person follows another, can be unidirectional or bidirectional. This data is used as edges.
First, create a graph from the input data:
- Load each dataset into a CSV node, and connect the nodes to an Assemble Graph node. Enusre the dataset with vertices is linked to the "Vertices" port, and the dataset with edges is linked to the "Edges" port.
- Select id (String) for Select Column with Vertex ids, src (String) for Select Source Columns and dst (String) for Select Destination Column.
- Click Run.
Next, apply connected components:
- Connect a Connected Components node to the output of the Assemble Graph node.
- Click Run.
The output data is the same as that in Figure 2. You can see there are two unique IDs ('0' and '1') in the component_id column, meaning there are a total of two connected components. Component ID '0' contains six vertices, whereas ID '1' contains three vertices.
¹Needham, M., & Hodler, A. E. (2021). Graph algorithms: Practical examples in Apache Spark and neo4j. O'Reilly.