Triangle Count & Clustering
Apply the Triangle Count and Clustering Coefficient algorithm to a Visual Notebooks graph. The algorithm determines the number of triangles passing through each vertex in the graph, where a triangle consists of three vertices, each with a relationship to the other two vertices. It also computes the local clustering coefficient for each vertex, which is the likelihood that neighboring vertices are also connected to one another. Clusters are groups of densely connected regions, and the clustering coefficient measures how concentrated these regions are. Applications of this algorithm include detecting communities or clusters in social and information networks, detecting spamming activity, and assessing content quality.
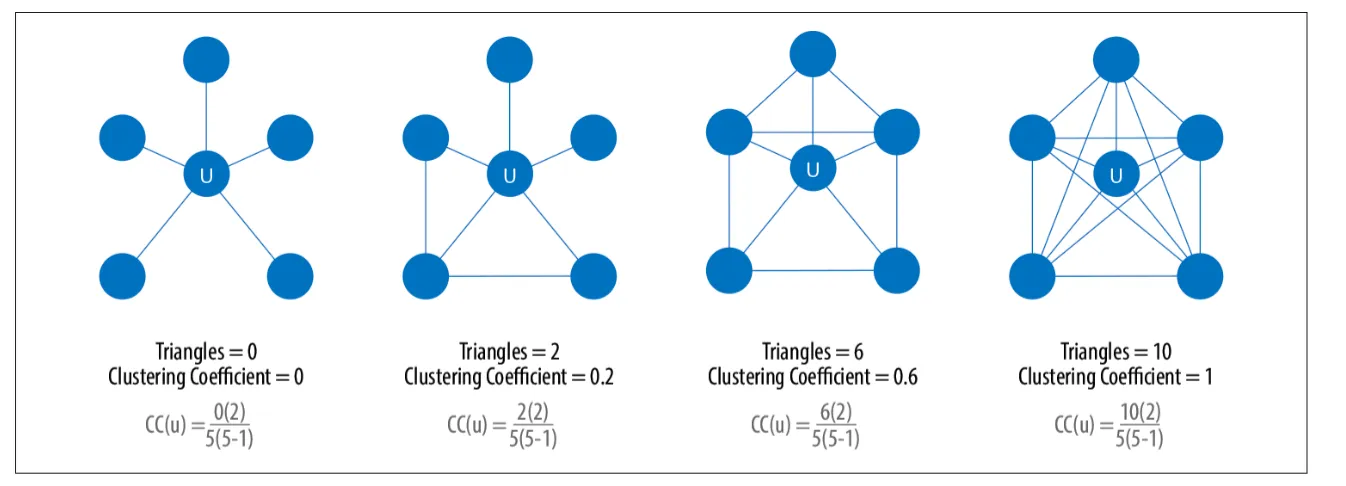
Figure 1: Example graphs with triangle count and clustering coefficient1
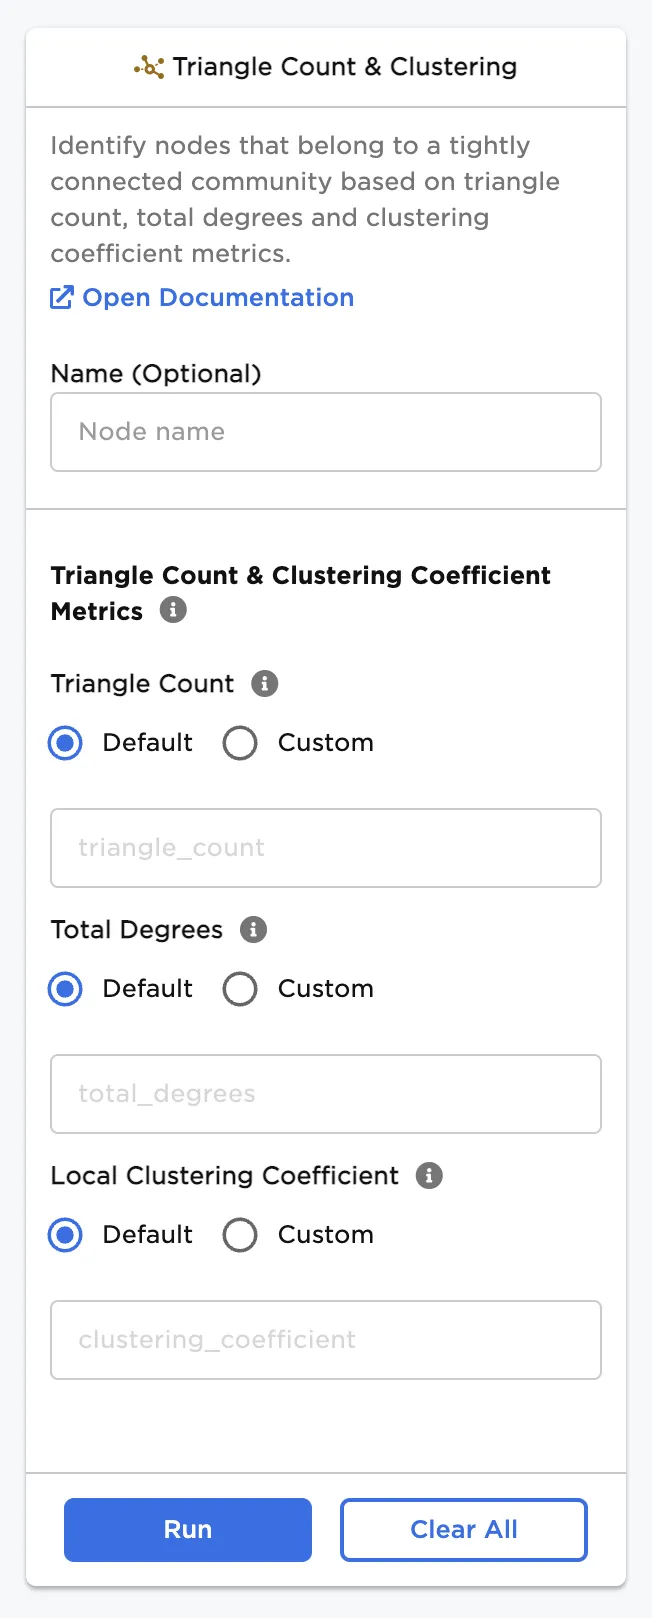
Configuration
| Field | Description |
|---|---|
| Name | Field to name the node A user-specified node name, displayed in the canvas and in the dataframe as a tab. |
| Triangle Count | Name of column for triangle count Specify a custom name, if desired, for the column showing the number of triangles. |
| Total Degrees | Name of column for total connections Specify a custom name, if desired, for the column showing the total number of connections. |
| Local Clustering Coefficient | Name of column for clustering coefficients Specify a custom name, if desired, for the column showing local clustering coefficients. |
Node Inputs/Outputs
| Input | A Visual Notebooks graph, output from an Assemble Graph node |
|---|---|
| Output | Vertices and edges that can be used with a Graph node |
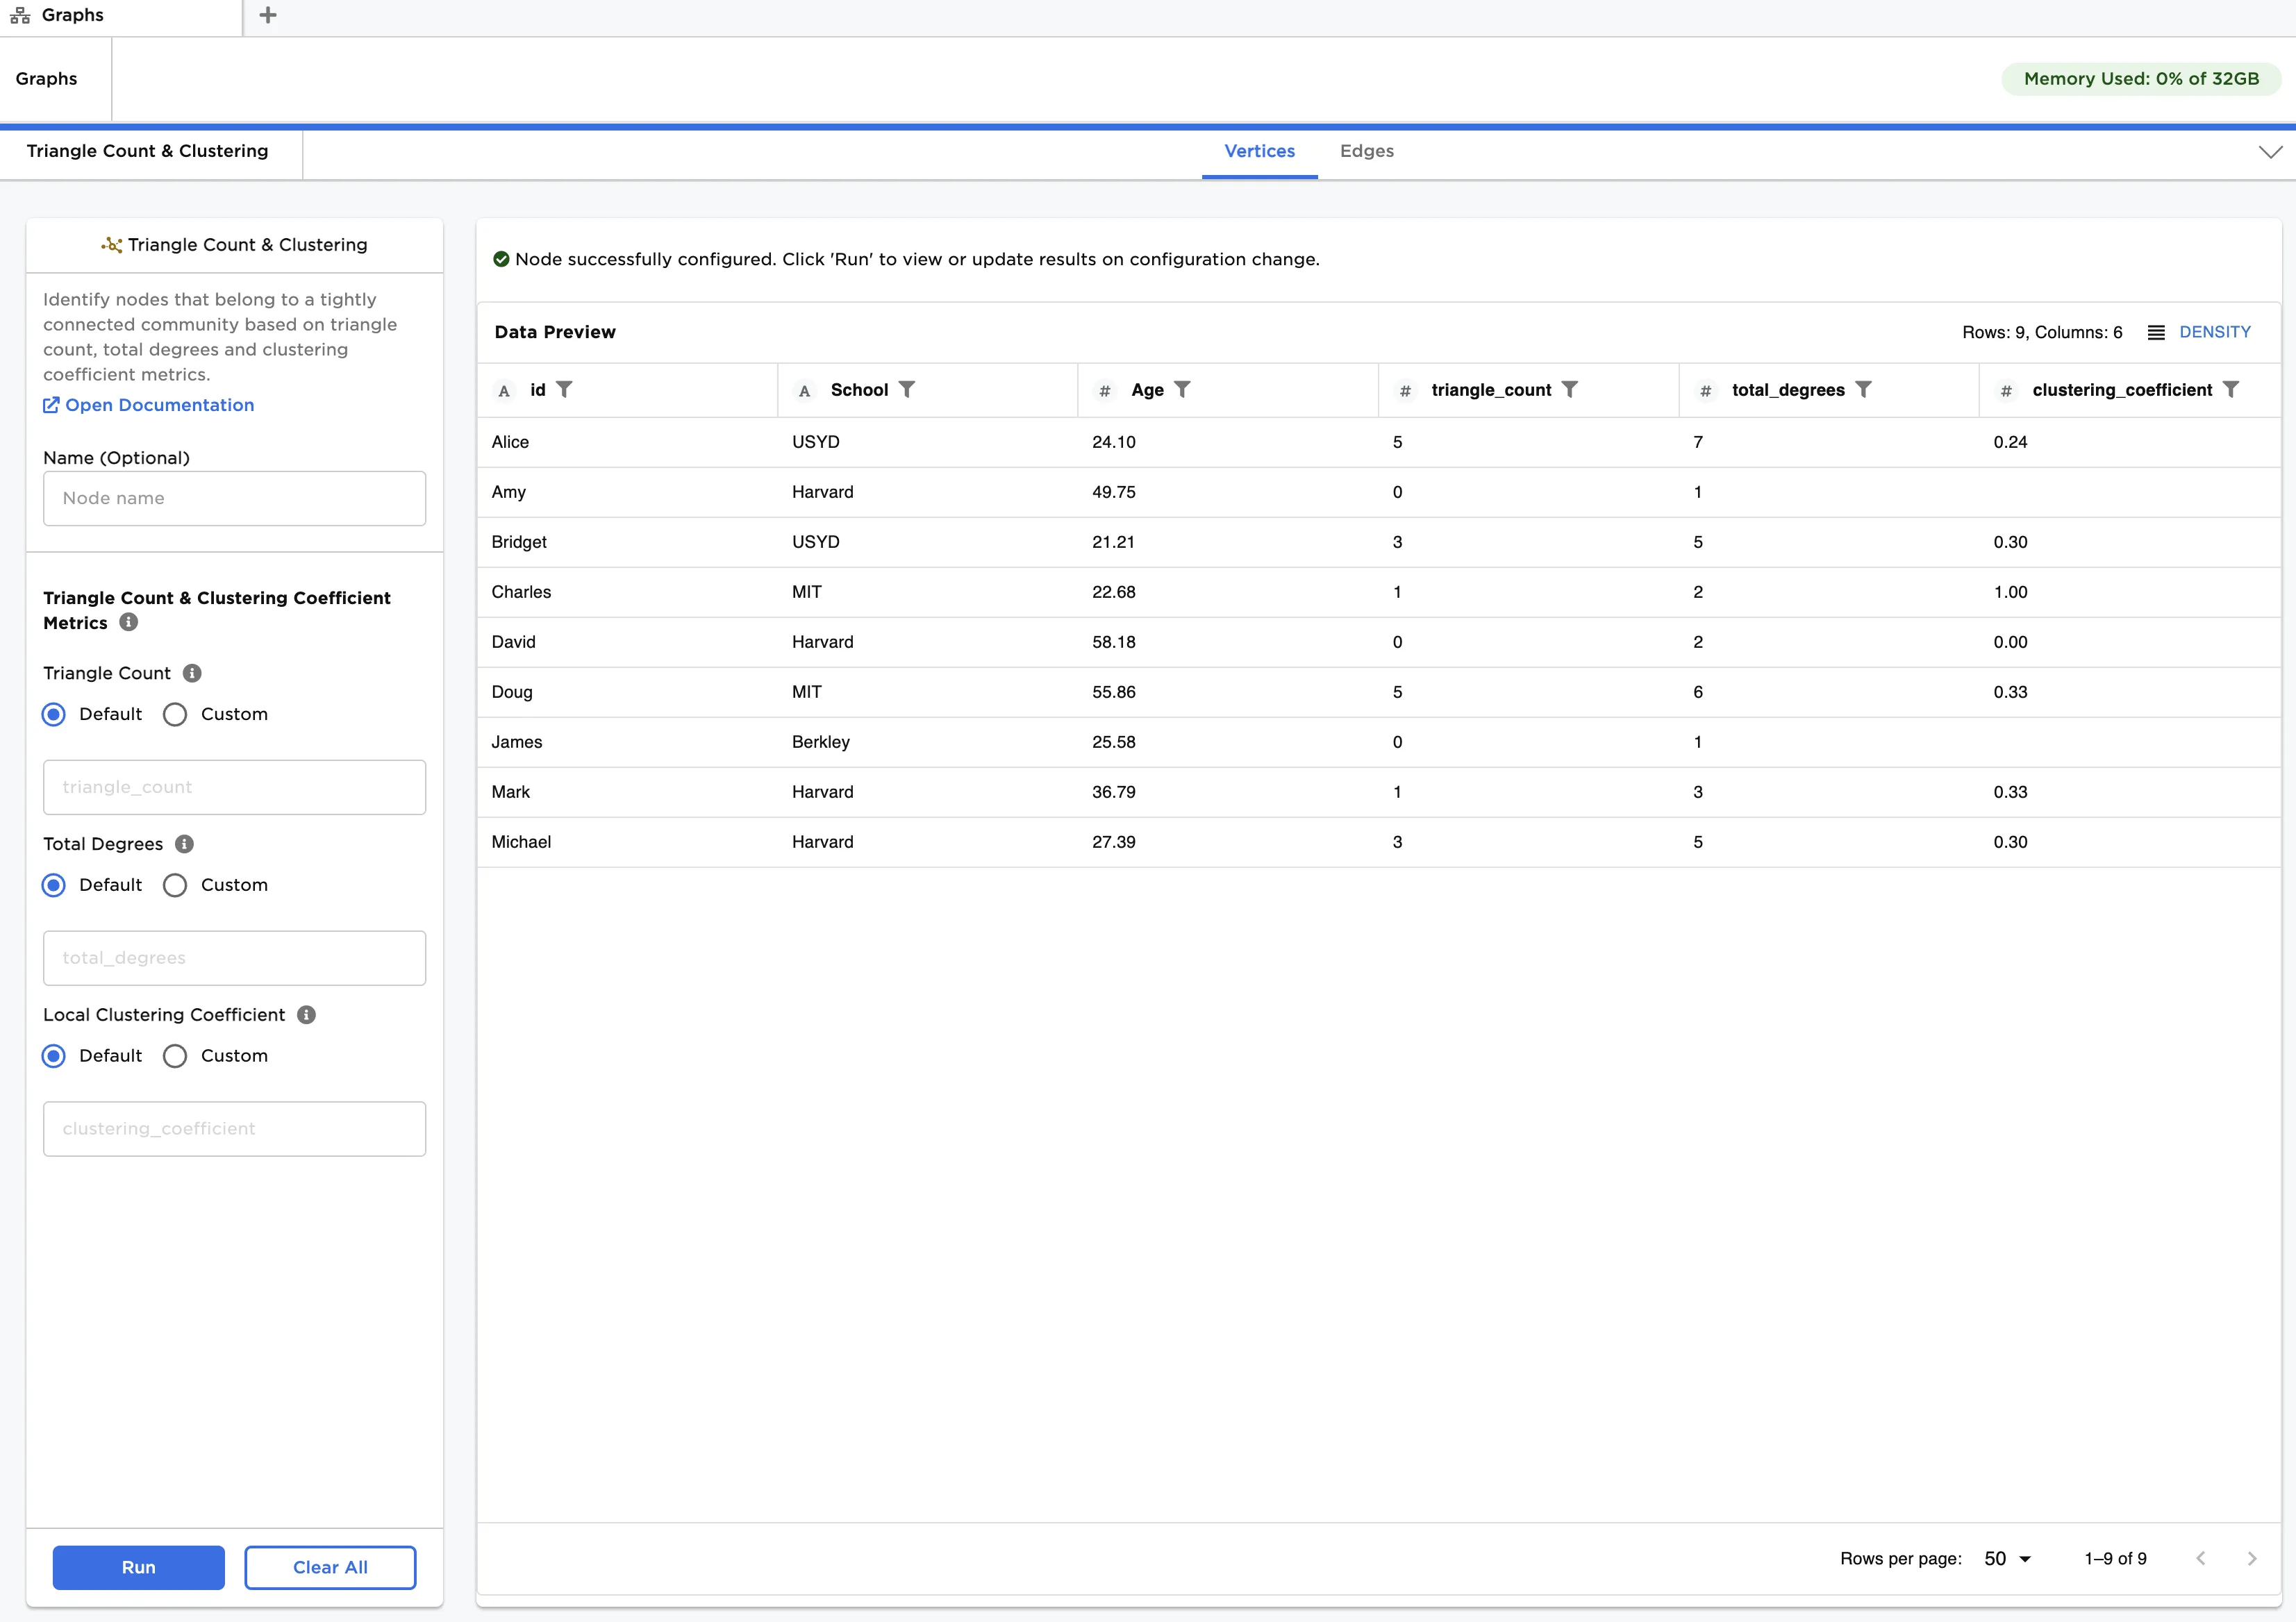
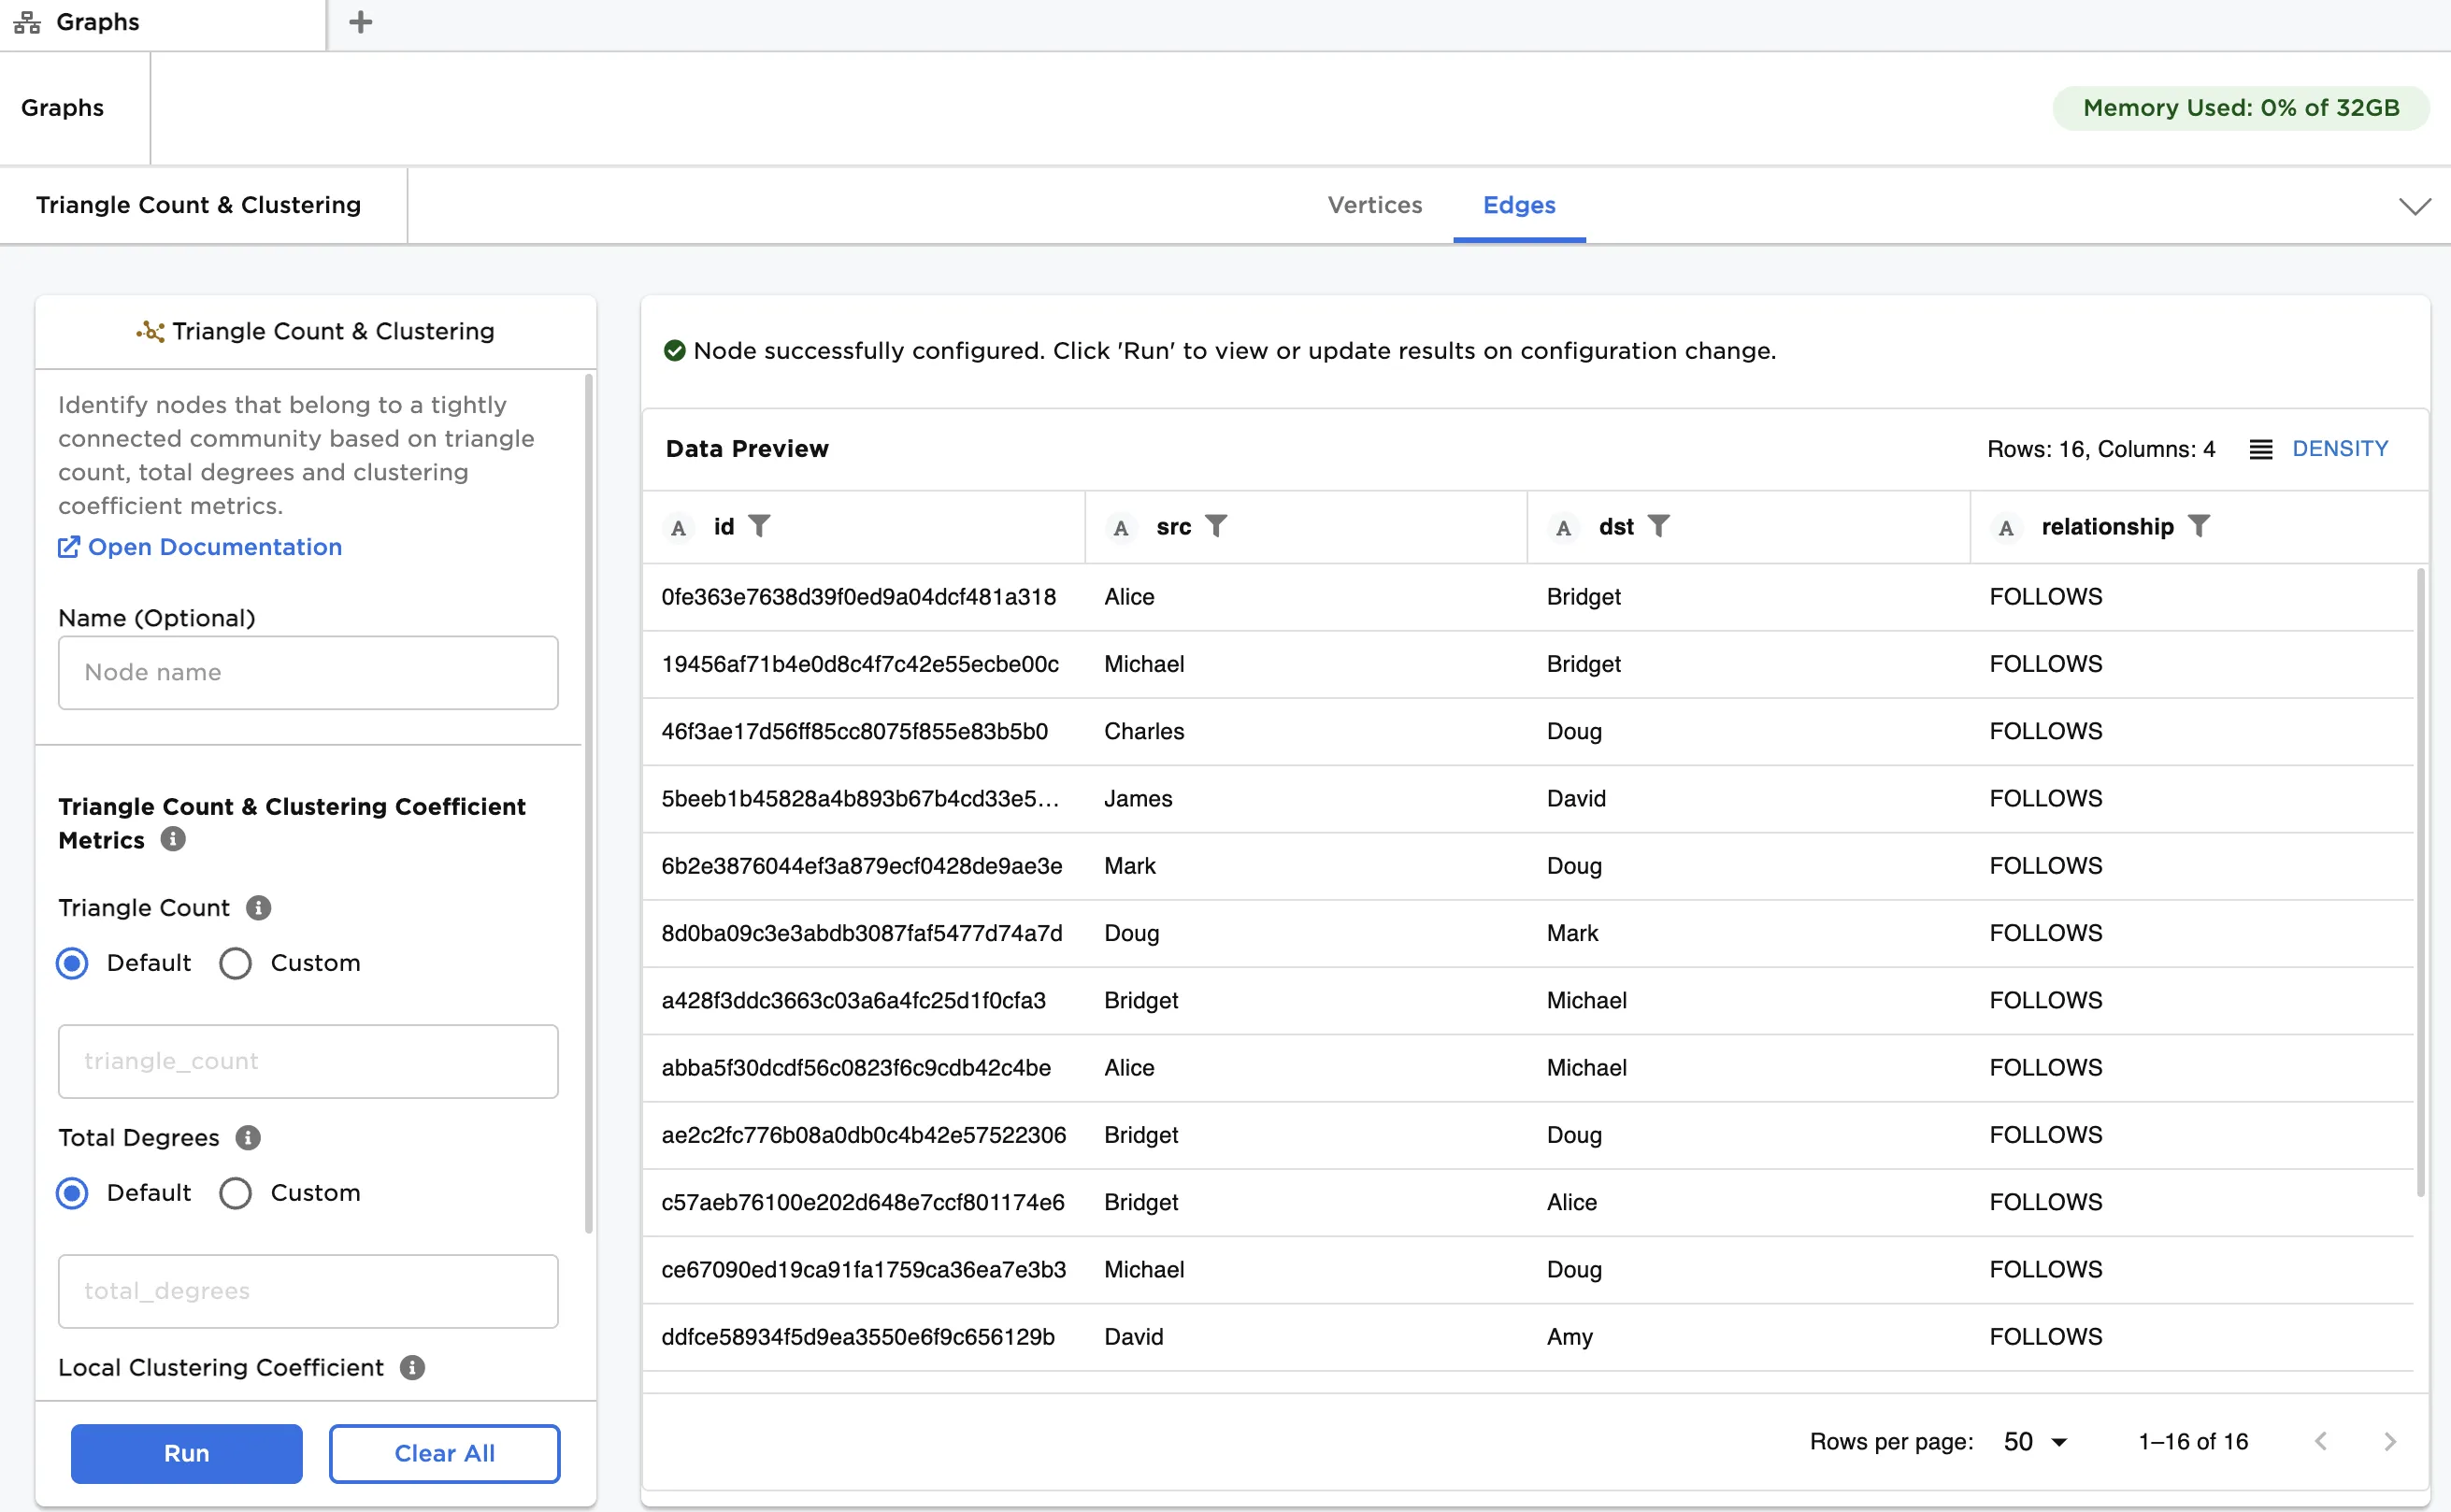
Figure 2: Example output
Examples
The data shown in Figure 3 is used in this example. It contains information about a group of students, and their connections within a social network. We create a graph from the data and then apply triangle count and clustering to provide insight into the network structure.
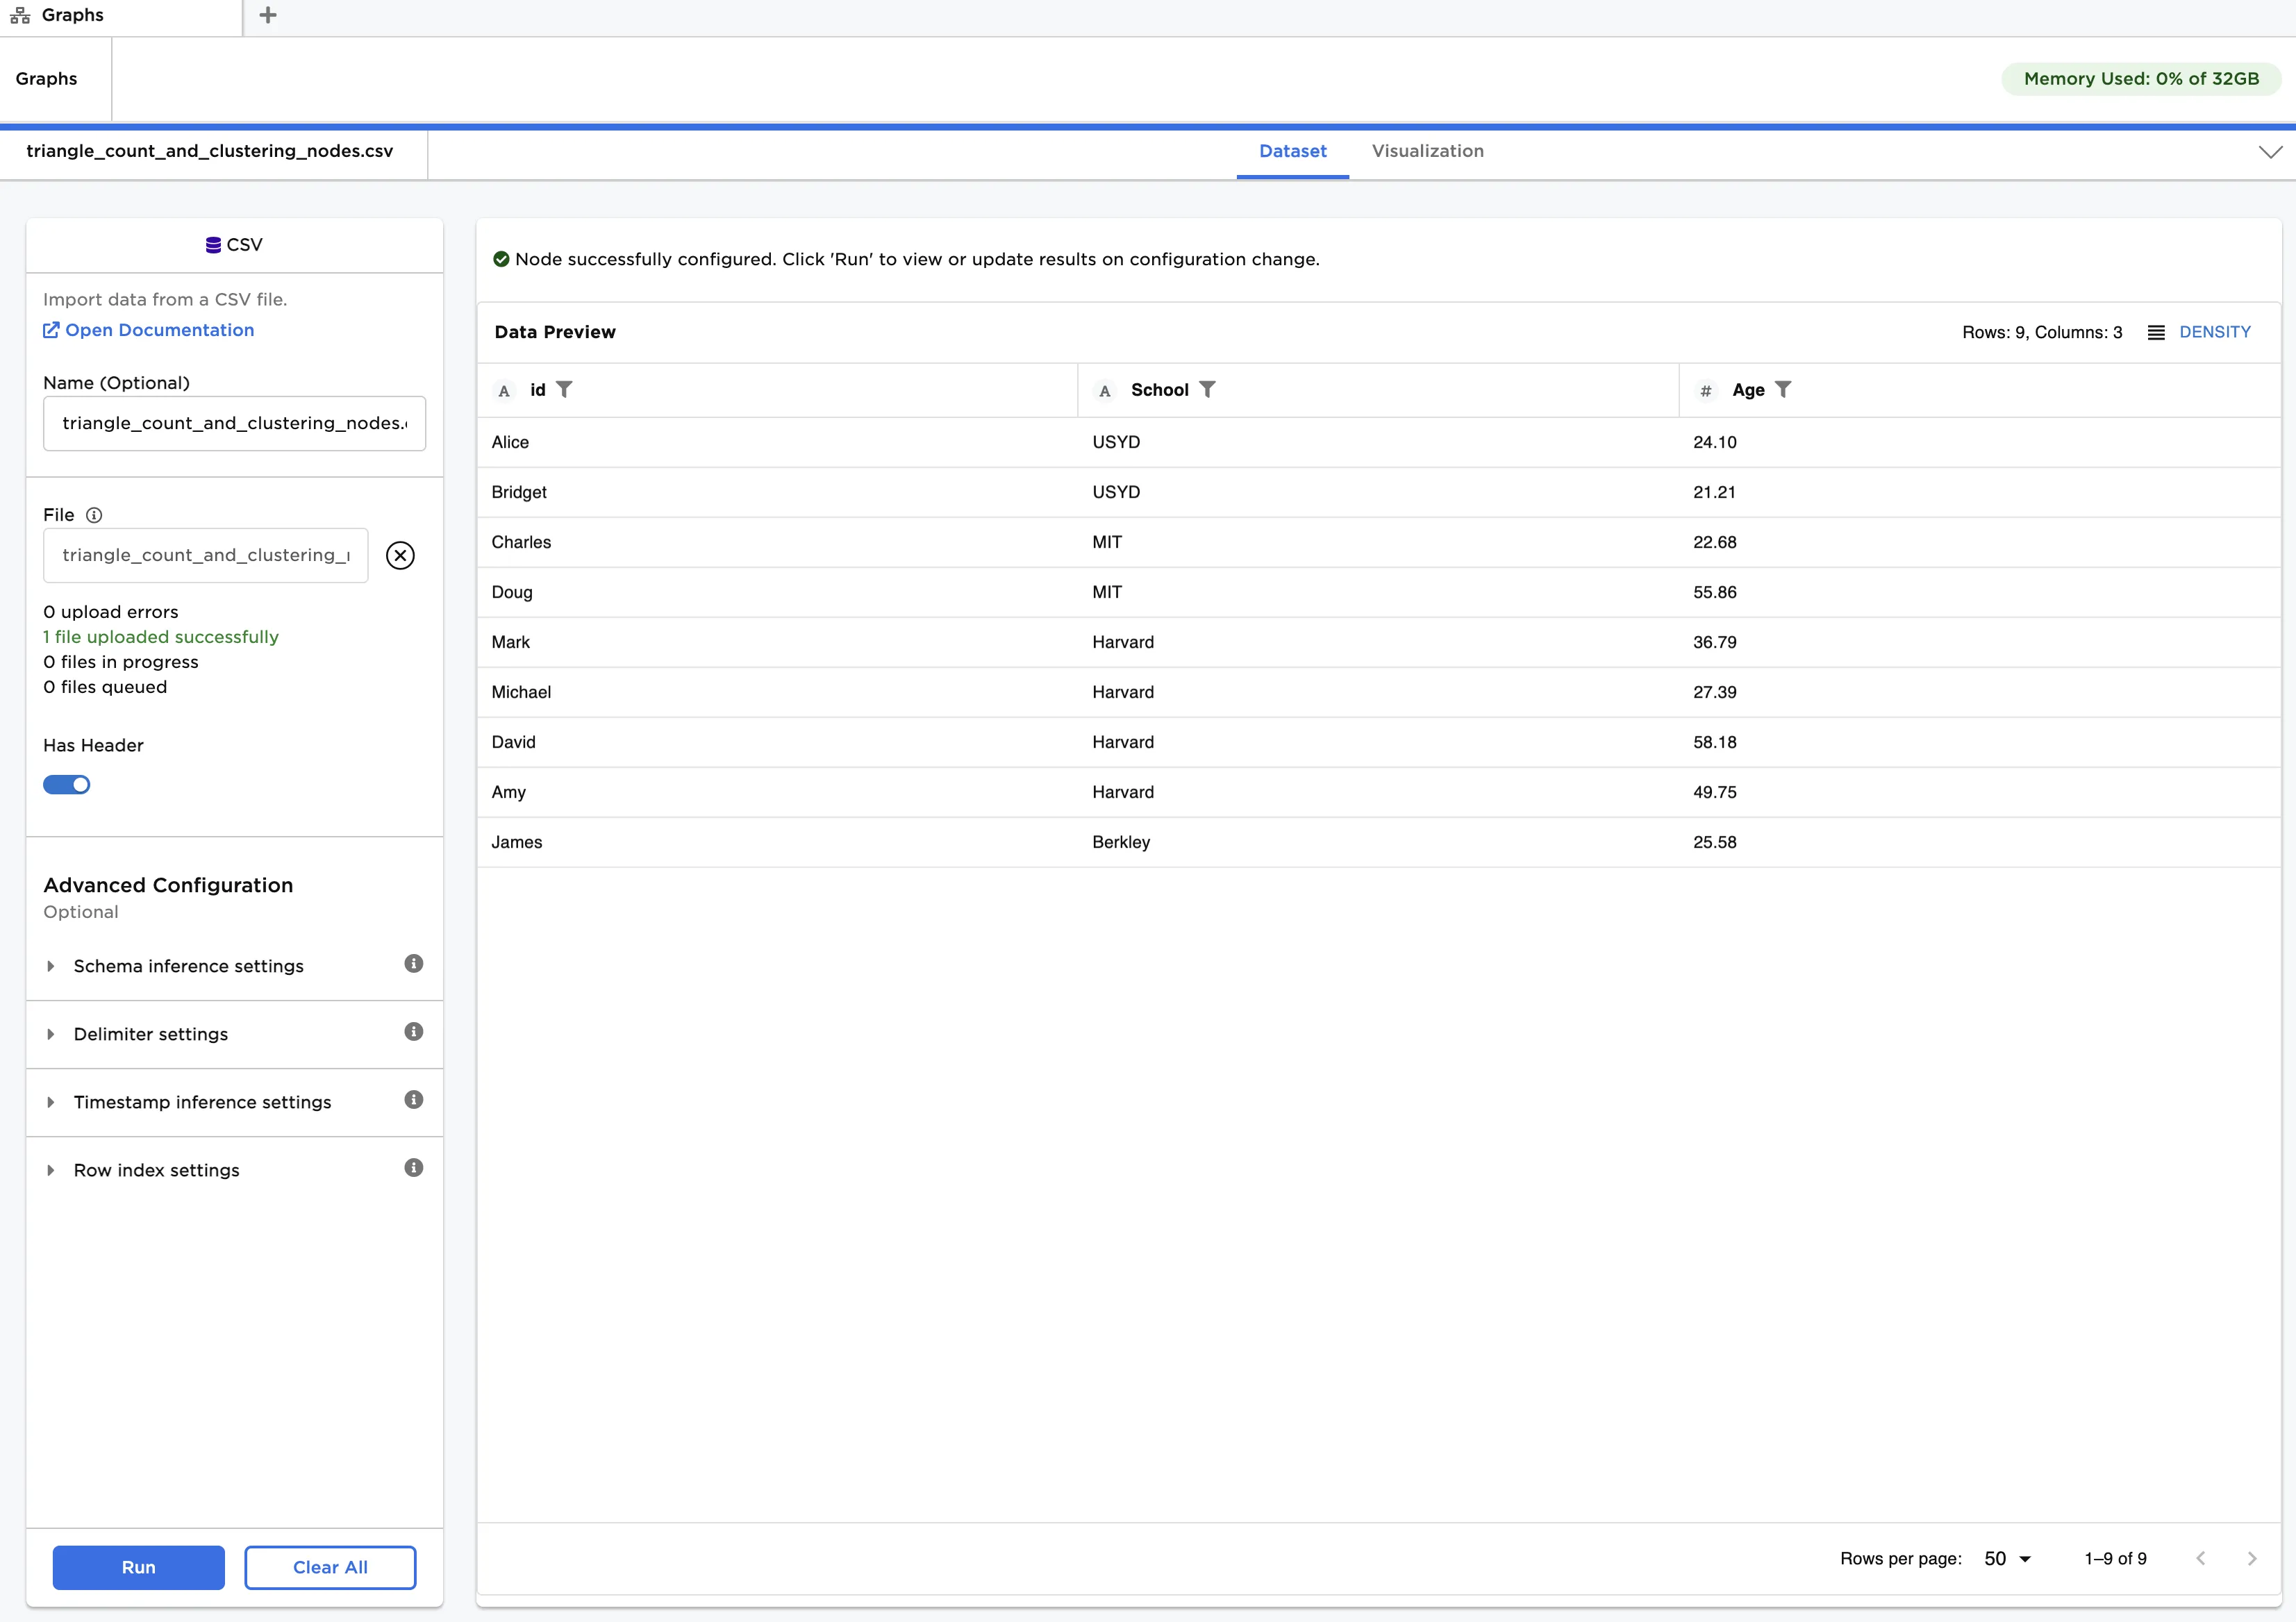
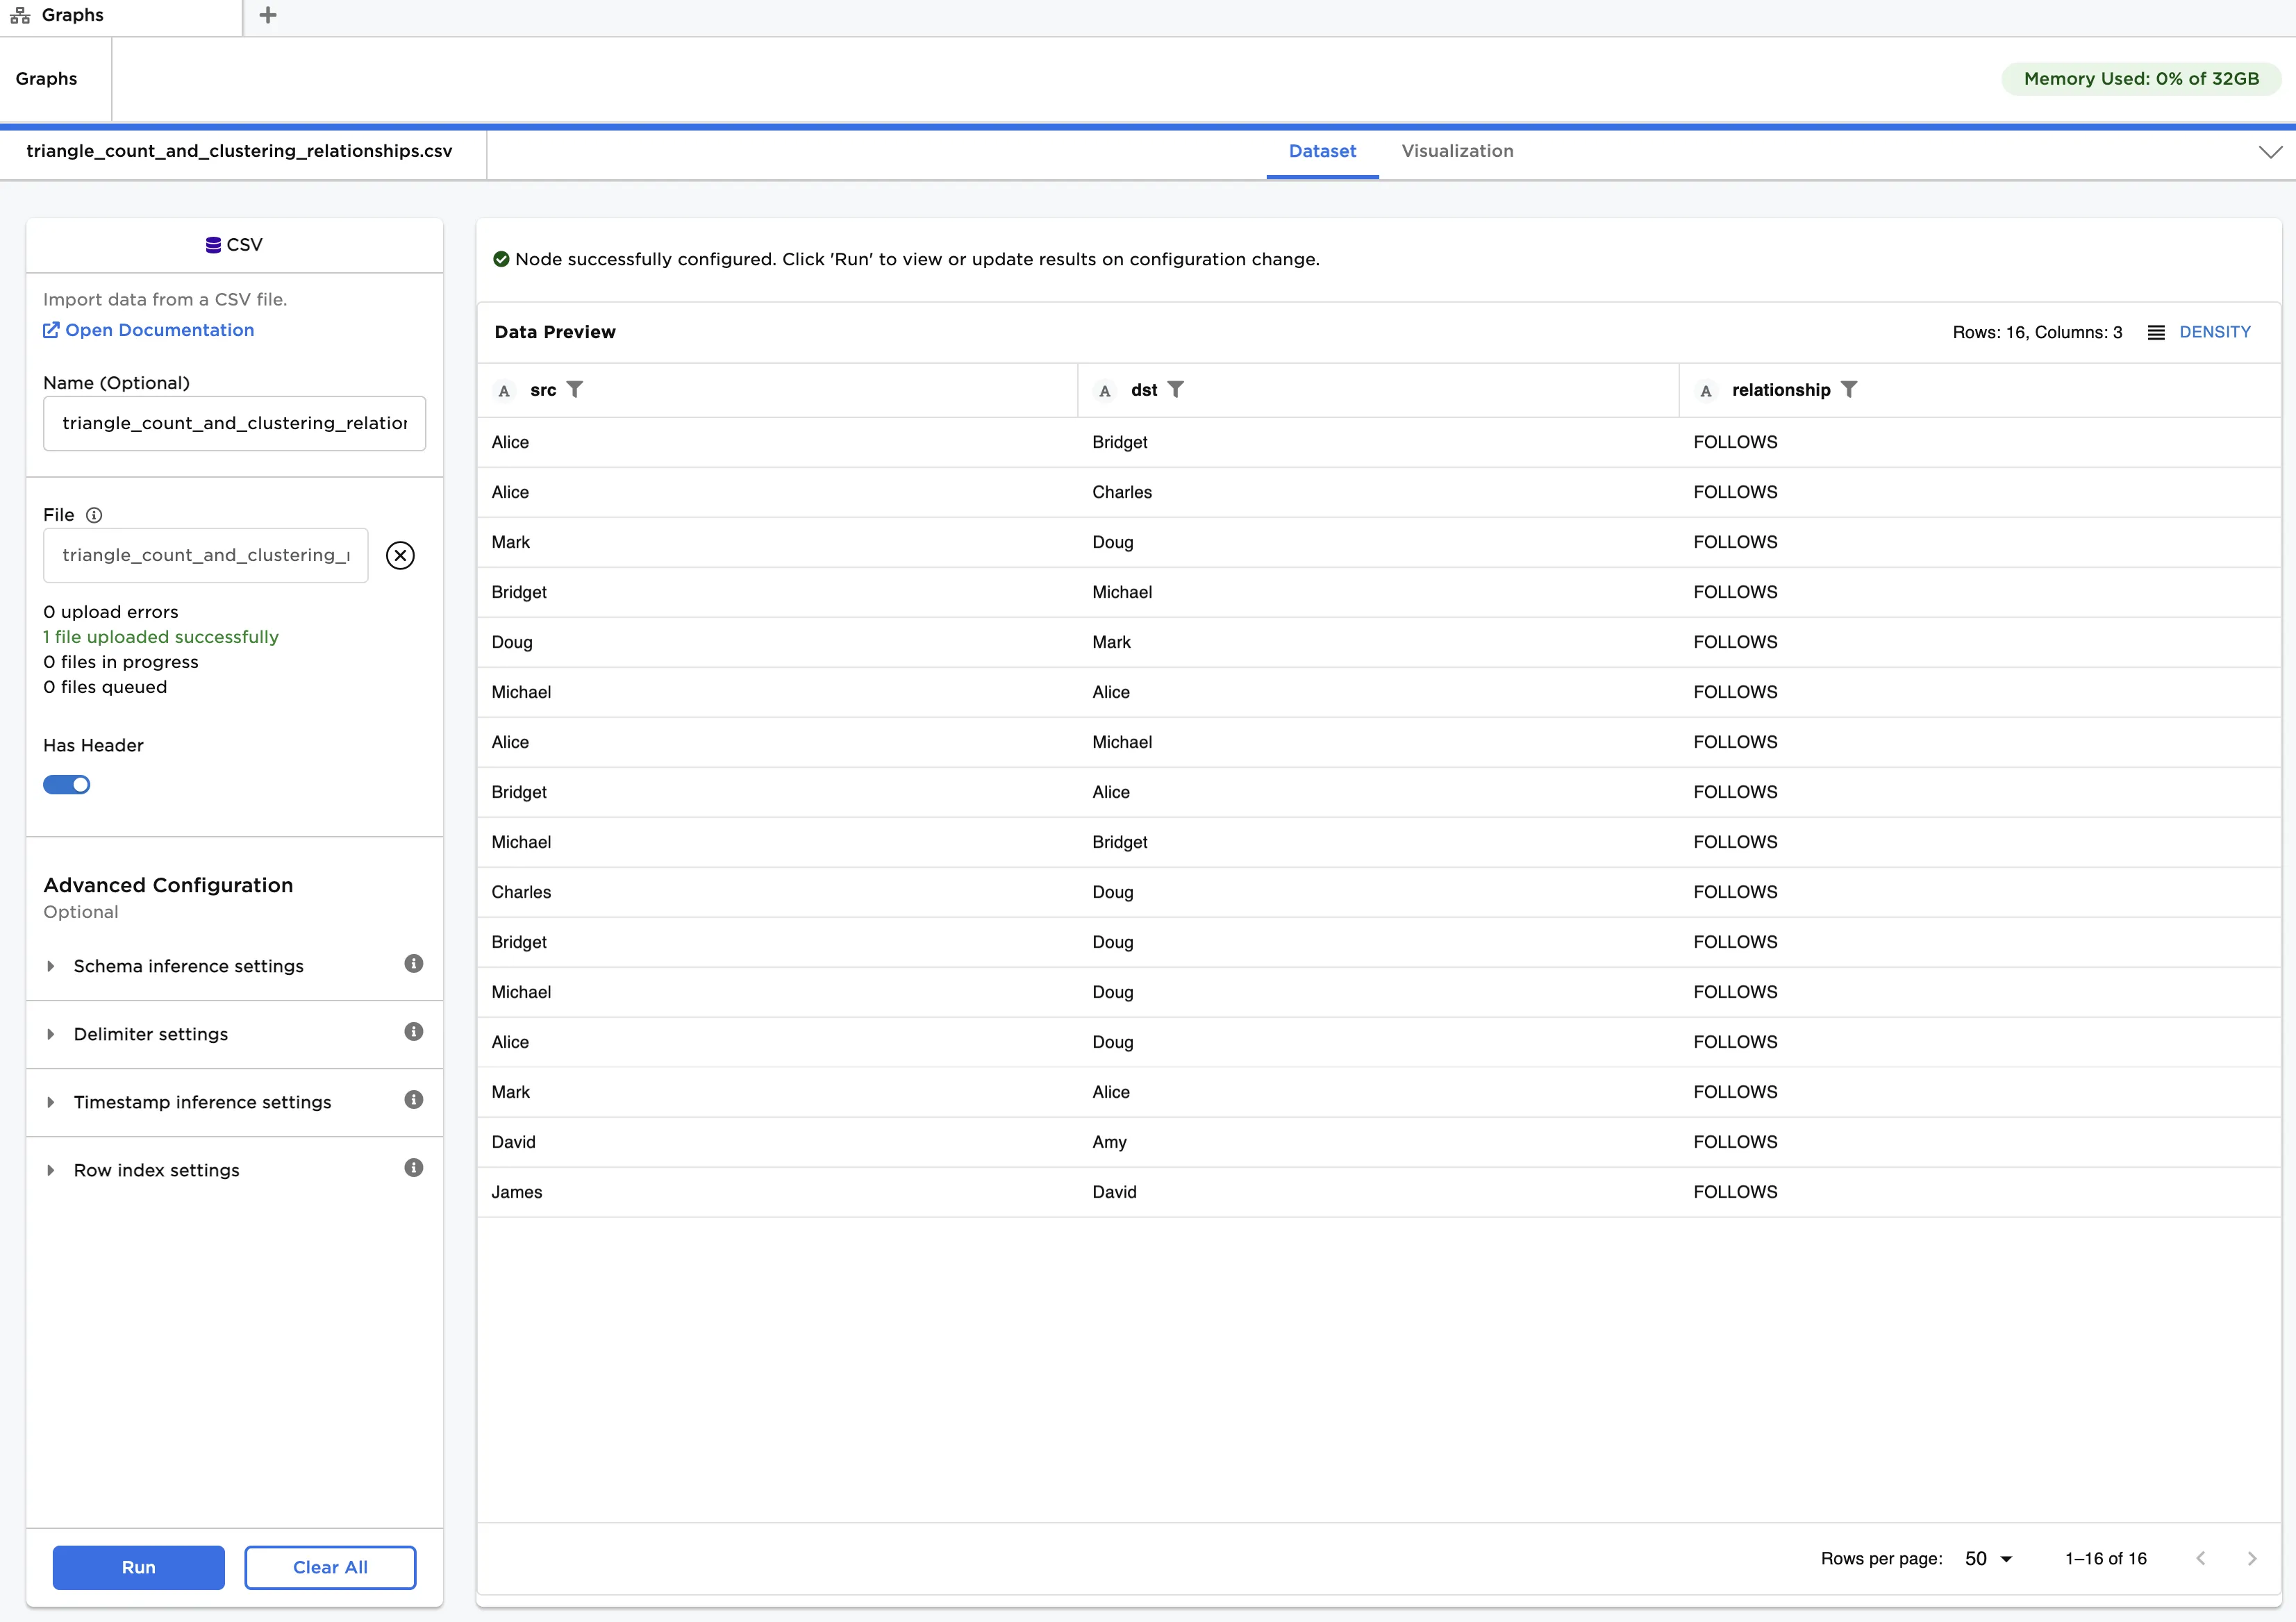
Figure 3: Example input data
The "triangle_count_and_clustering_nodes.csv" file contains a list of students, their age and the school they attend. This data is used as vertices. The "triangle_count_and_clustering_relationships.csv" file contains a list of connections between the students. Note that social media connections, where one person follows another, can be unidirectional or bidirectional. This data is used as edges.
First, create a graph from the input data:
- Load each dataset into a CSV node, and connect the nodes to an Assemble Graph node. Enusre the dataset with vertices is linked to the "Vertices" port, and the dataset with edges is linked to the "Edges" port.
- Select id (String) for Select Column with Vertex ids, src (String) for Select Source Columns and dst (String) for Select Destination Column.
- Click Run.
Next, apply triangle count and clustering:
- Connect a Triangle Count & Clustering node to the output of the Assemble Graph node.
- Click Run.
The output data is the same as that in Figure 2. Observe that triangle counts range from 0 to 7, total connections from 1 to 7 and clustering coefficients from 0 to 1. Clusters appear around Alice and Doug, who have the highest triangle counts and highest number of connections. Amy, David and James are in relatively isolated groups since they have no triangles and possess few connections. Where triangles exist, clustering coefficients are mostly around 0.3, indicating a fairly low cluster concentration.
1Needham, M., & Hodler, A. E. (2021). Graph algorithms: Practical examples in Apache Spark and neo4j. O'Reilly.