Describe Columns
The Describe Columns node in Visual Notebooks provides summary statistics for columns in your dataset. This node analyzes columns in your dataset, providing insight to help you better leverage your dataset for machine learning.
Configuration
| Field | Description |
|---|---|
| Name default=none | Field to name the node |
| An optional user-specified node name displayed in the workspace, both on the node and in the dataframe as a tab. | |
Select Columns to Profile default=Profile entire dataset | Select which columns to analyze |
Choose from Profile entire dataset (default), Profile all numeric and timeseries columns, and Select columns to profile. |
Select Summary Statistics
| Field | Description |
|---|---|
| Column Type Summaries default=none | Select column type summaries |
An option to select the type of summaries for columns. Options include Column Type, Categorical, and Units if set. | |
Summary counts and statistics default=Count Total Rows | Select analysis the analysis type |
Select the analysis type for the columns. Each selection creates a new section in the Data Profile for the columns that are being analyzed. | |
| Top values default=none | Select whether to include top value analysis |
An option to show the Top 5 Most Frequent Values. | |
| Histogram Plot default=none | Select whether to include a histogram plot |
| An option to show a histogram for numeric columns. |
Node Inputs/Outputs
| Input | A Visual Notebooks dataframe |
|---|---|
| Output | A data profile analyzing select columns |
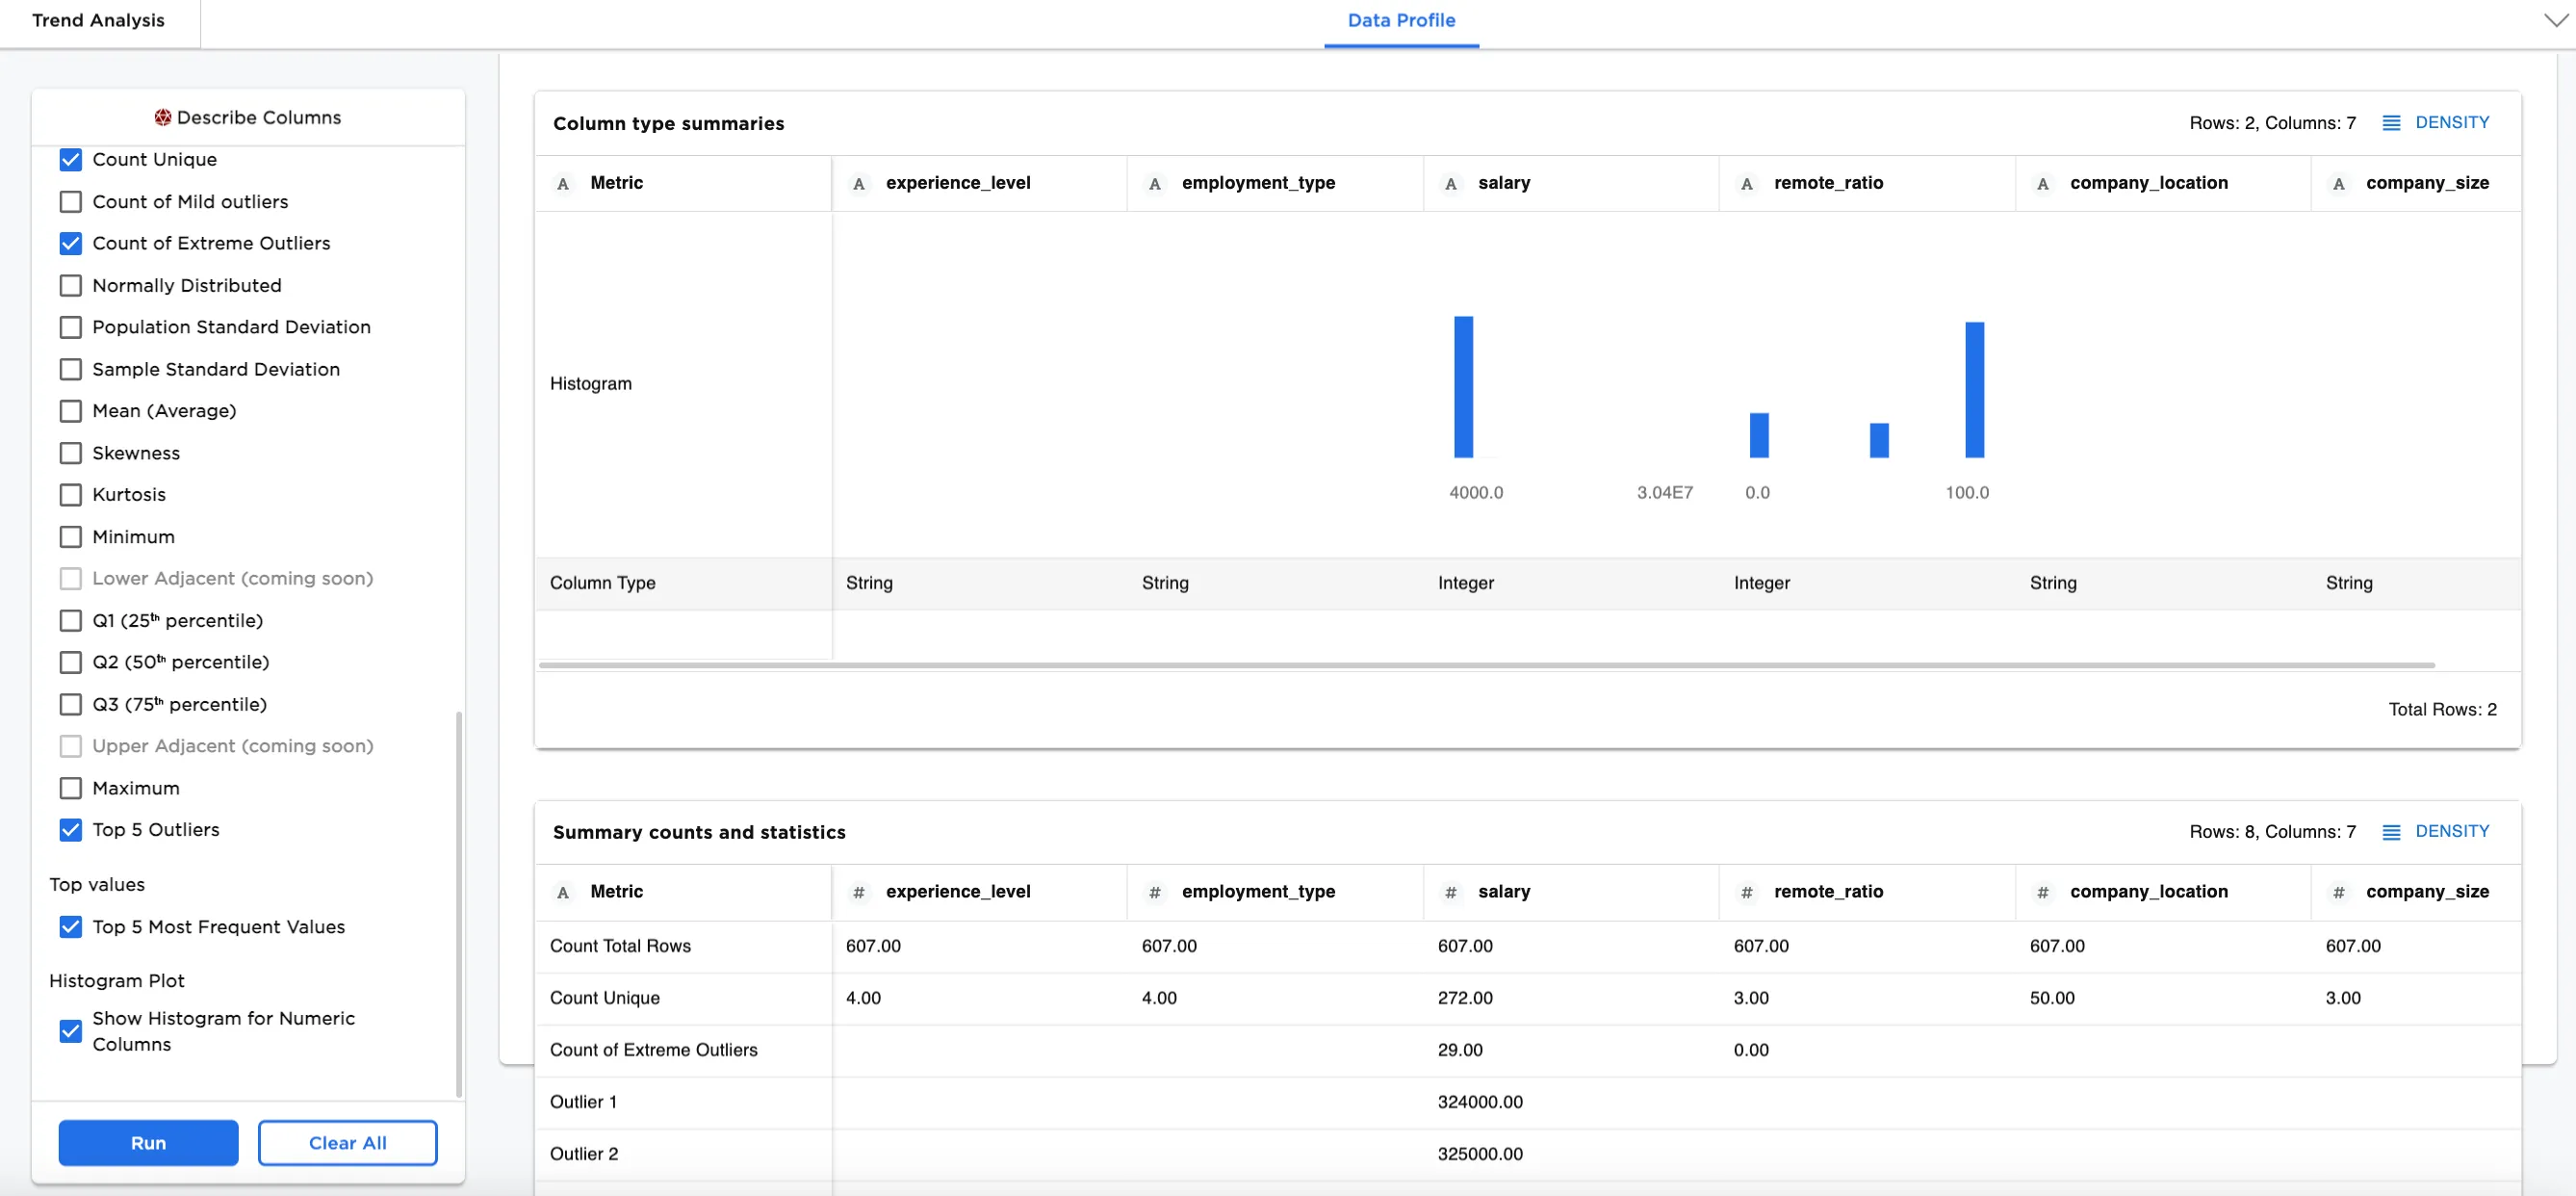
Figure 1: Example dataframe output
Examples
In our examples, we use information about compensation for data scientists. This data includes job titles, locations, salaries, currencies, work years, employment type, and company information.
Here are some important definitions to know when making some Summary counts and statistics selections:
- Count NaN: Count of entires that are not a number (NaN).
- Population Standard Deviation: The measure of the spread of values in a dataset. Use population standard deviation to determine the standard deviation of the larger population.
- Sample Standard Deviation: The measure of the spread of values in a dataset. Use sample standard deviation to determine the standard deviation of the sample of interest.
- Skewness: The measure of how distorted a data sample is from the normal distribution.
- Kurtosis: The measure of the tails of distribution. A large kurtosis value means that the tails of the distribution are more extreme than the tails of the normal distribution.
- Connect the CSV node with the sample data,
ds_salaries.csv, to the Describe Columns node - Optionally, add a name to the nodes for clarity. In this case, the CSV node is named
Comp Researchand the Describe Columns node is namedTrend Analysis.
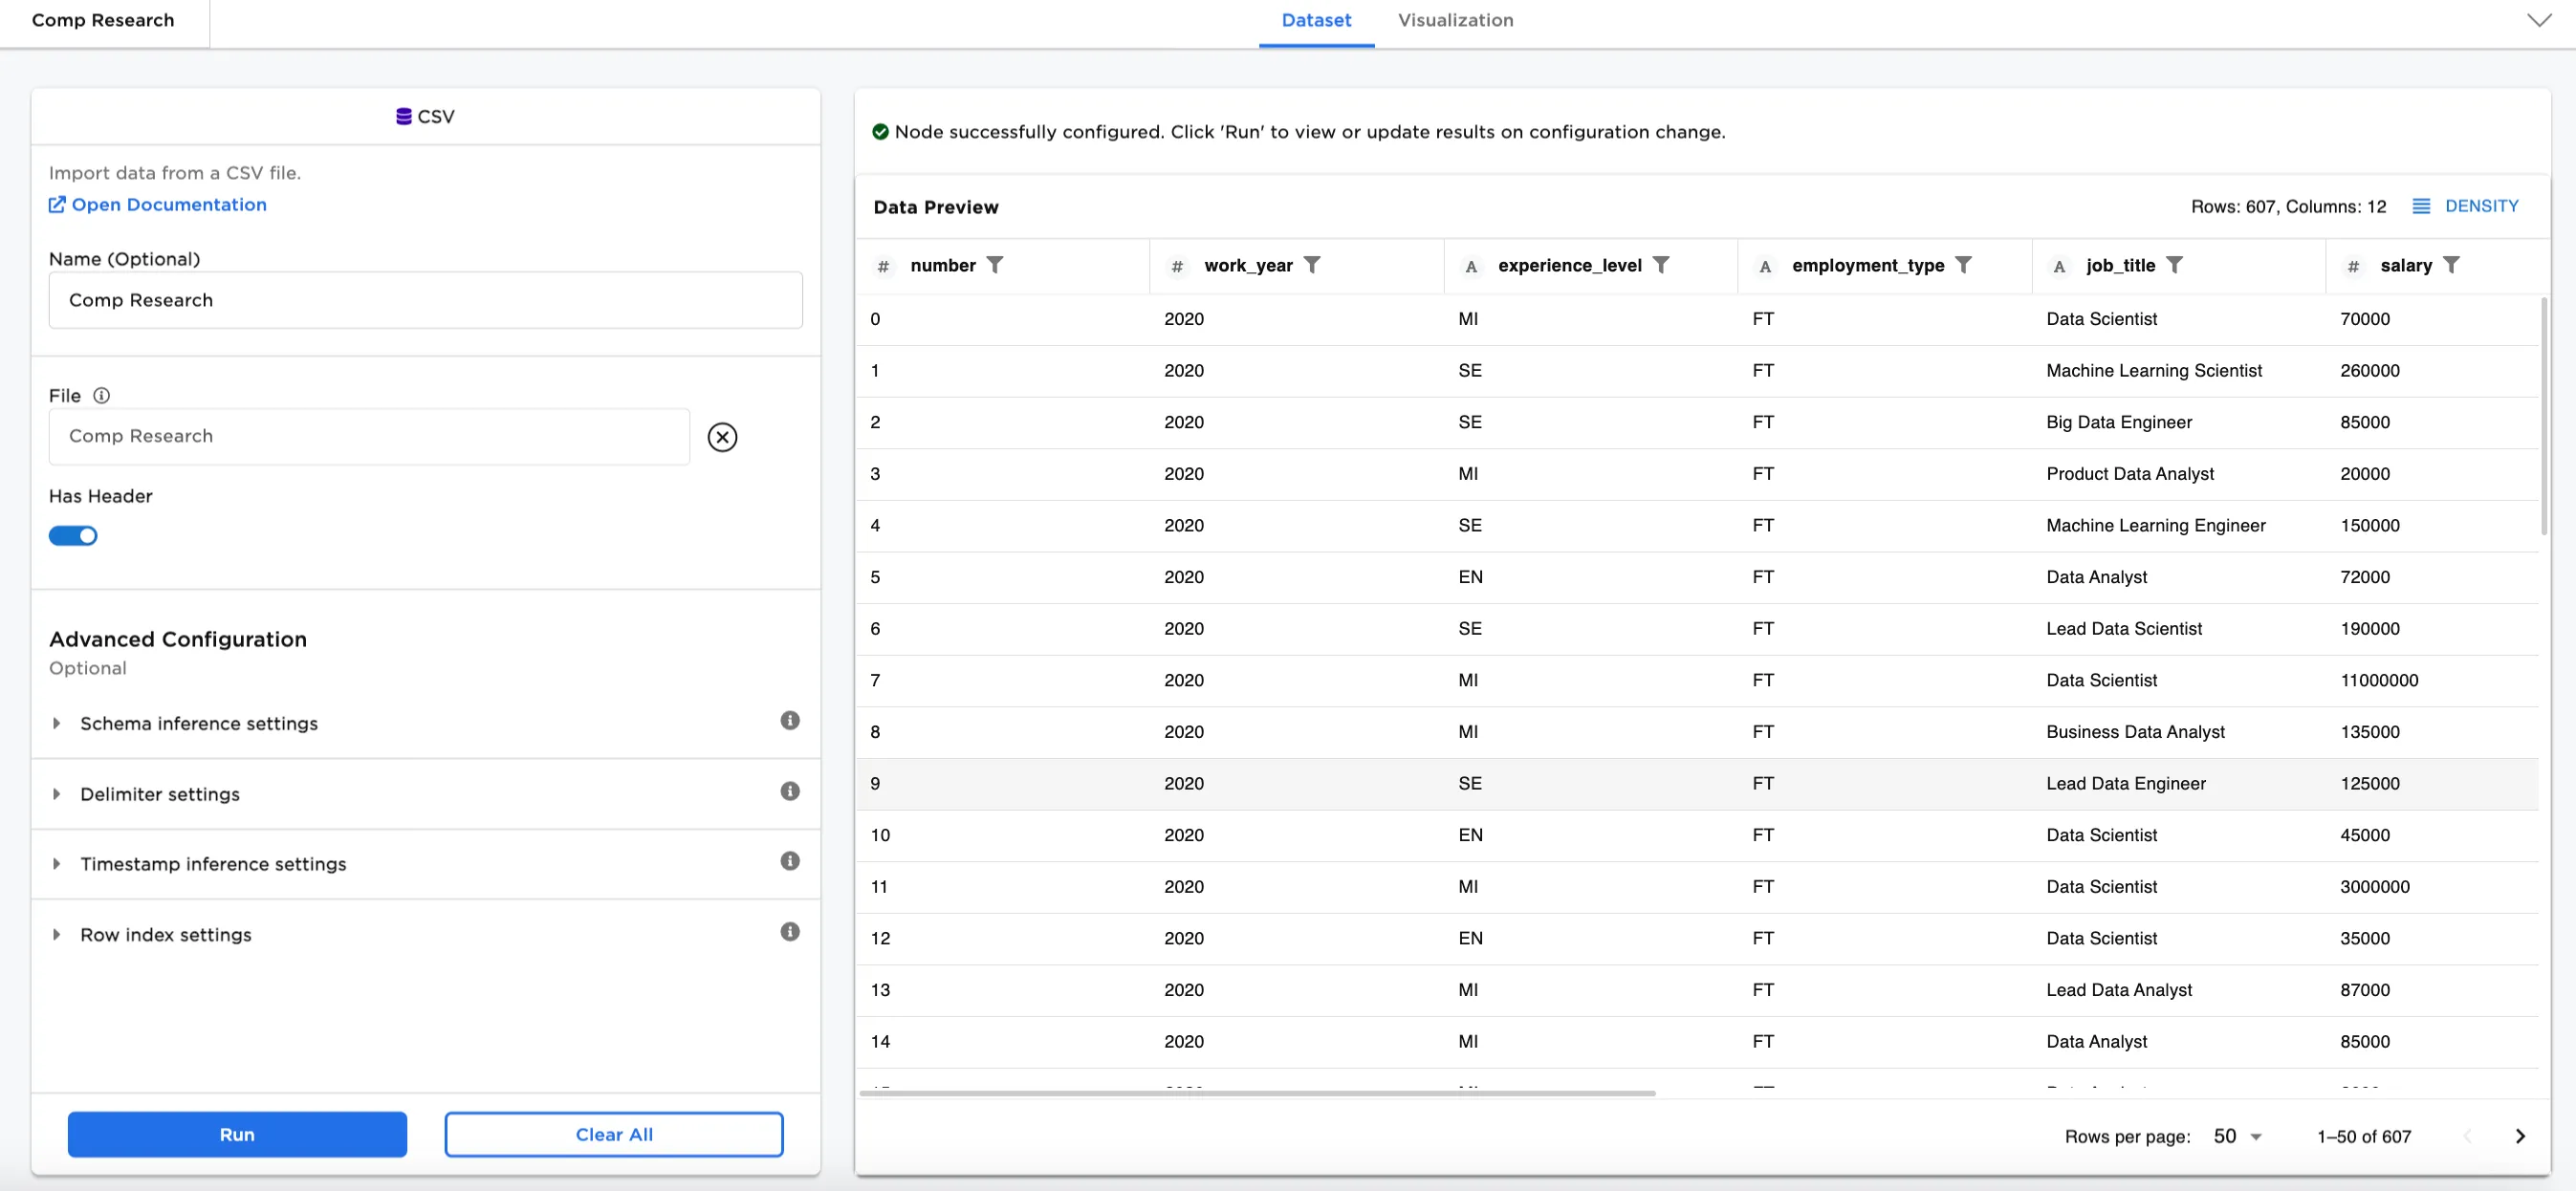
Figure 2: Example dataframe input
- Select which columns to analyze in the
Select Columns to Profilesection. Figure 3a showsSelect columns to profileis selected with several columns included for analysis:
experience_level (String)employment_type (String)salary (Integer)company_size (String)company_location (String)remote_ratio (Integer)
- Select the
Column Type Summaries. Figure 3a shows bothColumn TypeandCategoricalare selected. - Choose the
Summary counts and statisticsthat you'd like to see. Figure 3b shows these selections:
Count Total RowsCount UniqueCount Extreme OutliersNormally DistributedTop 5 OutliersTop 5 Most Frequent ValuesShow Histogram for Numeric Columns
In Figure 3a and Figure 3b, notice that the Data Profile is shown in three different sections, matching the breakdown of Summary counts and statistics selections (Summary counts and statistics, Top values, and Histogram Plot). The top section shows the histogram for numeric columns, the middle section contains all the summary counts and statistics selections, and the bottom section shows the top values broken down. Notice also that only the selected columns are being profiled (see Figure 3a to review the column selections).
Make different selections to see further analysis.
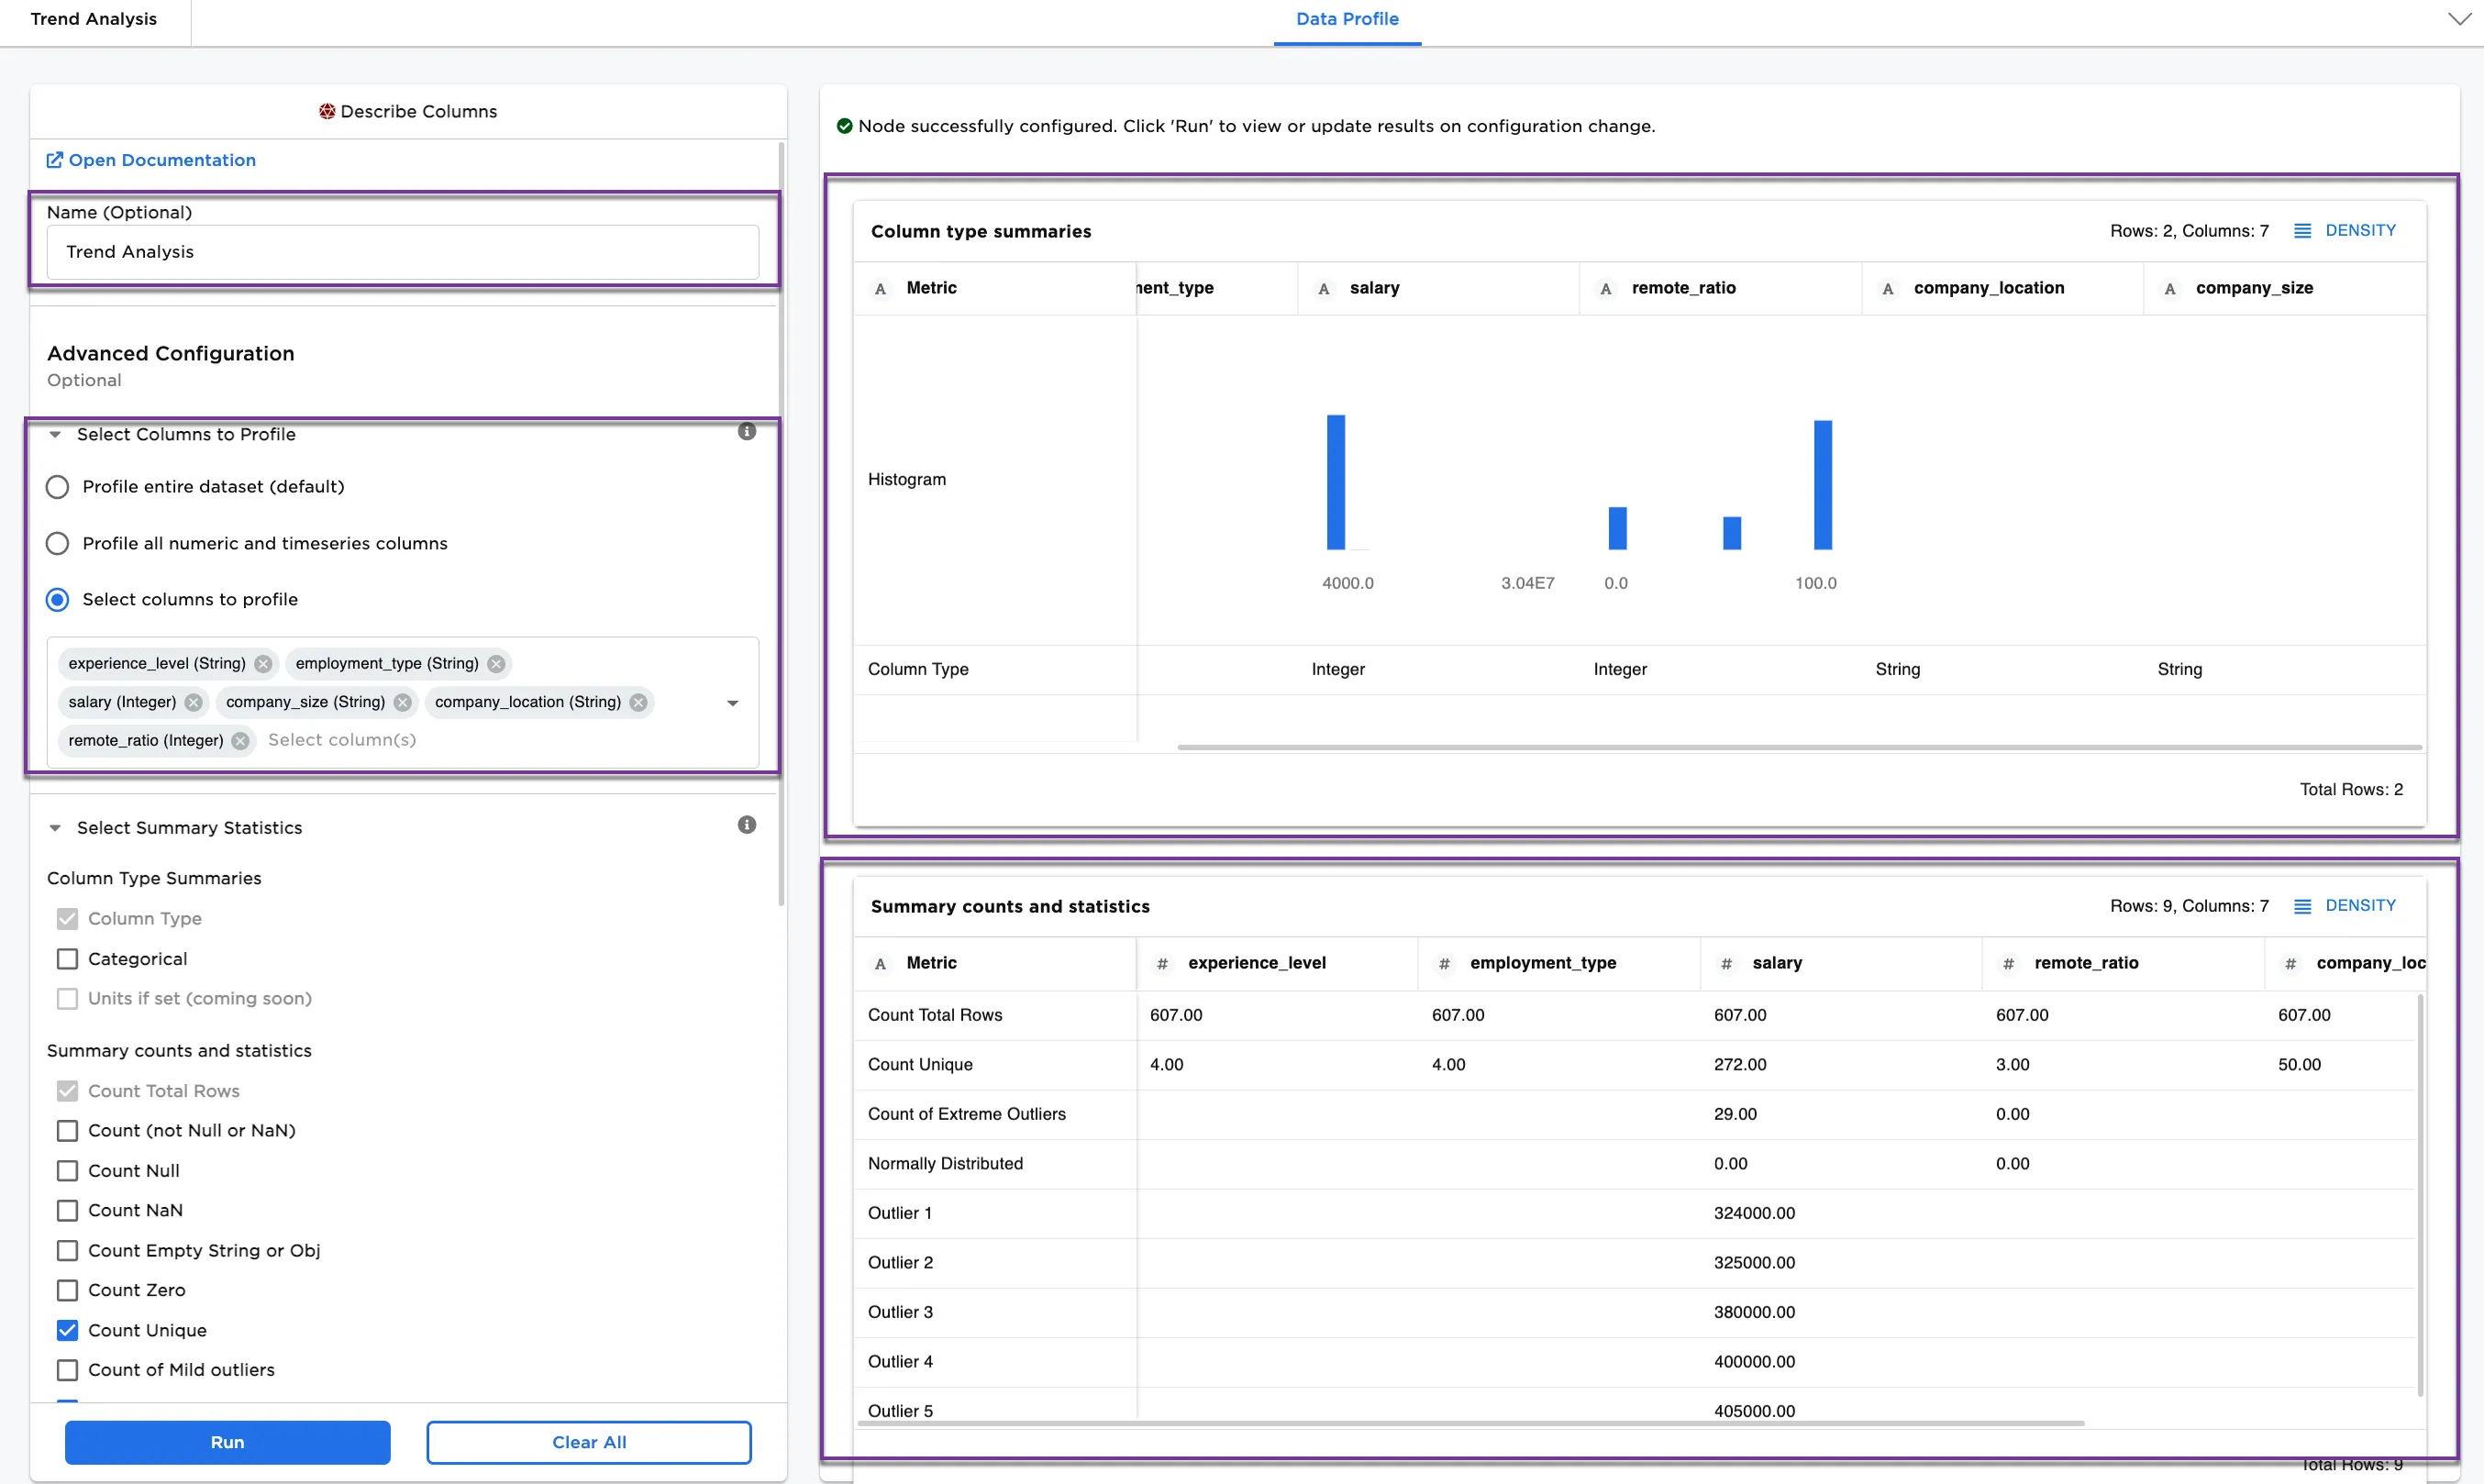
Figure 3a: Example data profile for selections
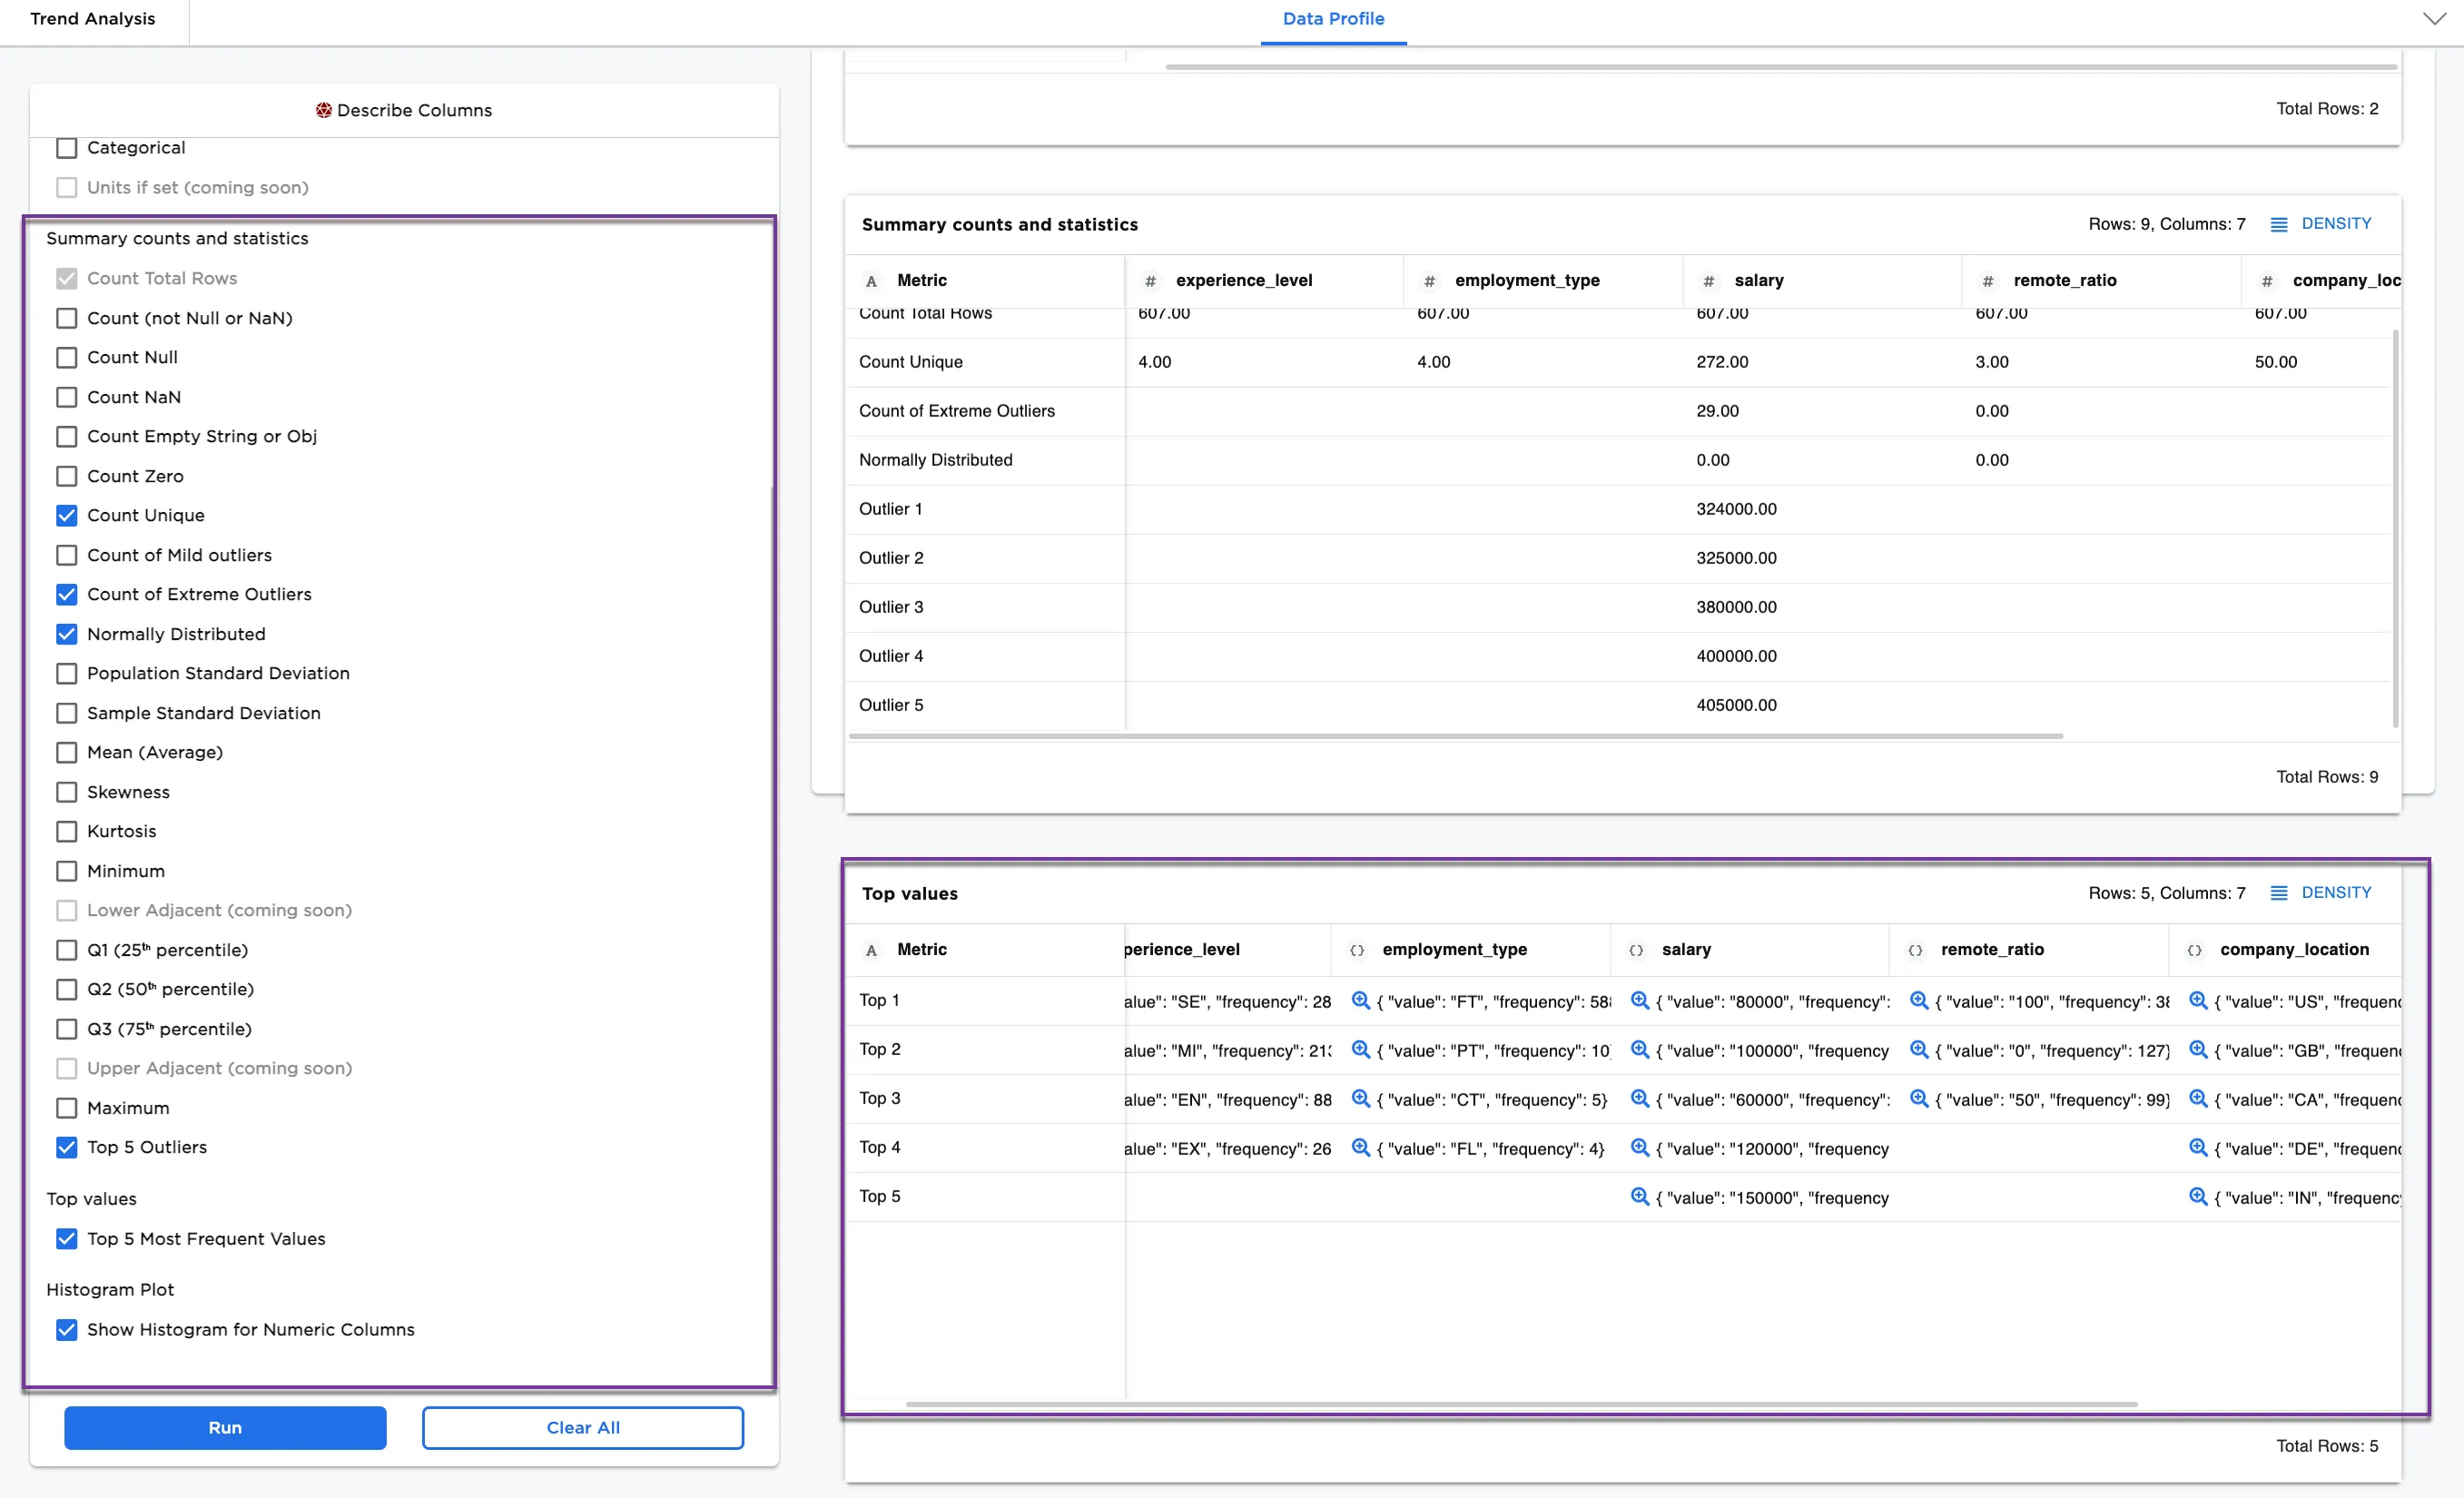
Figure 3b: Example data profile with selections