C3 AI Evaluate
The C3 AI Evaluate node performs a calculation on a set of values and return a single value. This value depends on the set of rows that the filter property of the evaluate() function qualifies.
The values are retrieved from a C3 Type and fields associated with the time. A C3 Type represents underlying data, including tabular data, timeseries data, or more complex data objects and relationships. The source of all C3 AI platform data access operations are done via C3 Types.
Prerequisites
The user must be in the appropriate Admin Group and have the correct roles to be authorized to read data from the selected C3 Type. By default, C3 AI follows the principle of least privilege and users may not have been granted access to retrieve data from C3 Types. Please speak to the C3 AI Support Team to ensure proper setup.
The evaluate call may be computationally intensive depending on the filter applied.
Configuration
| Field | Description |
|---|---|
| Name default=none | A user-specified node name displayed in the canvas |
| Projection default=none | Aggregate function or functions to be evaluated |
| Supported aggregate functions are COUNT, SUM, MIN, MAX, AVG. | |
| Group default=none | Property to be used to group data by some characteristic |
| A comma delimited list of projections to perform grouping on. Each group specification must match a projection specification. | |
| Order default=none | Sort order of the evaluate function output |
| A comma delimited list of results to order the results by. |
Node Inputs/Outputs
| Input | A C3 AI Type Node |
|---|---|
| Output | Visual Notebooks returns a table, called a dataframe, from the C3 AI Application Data Model that contains the specified calculation. |
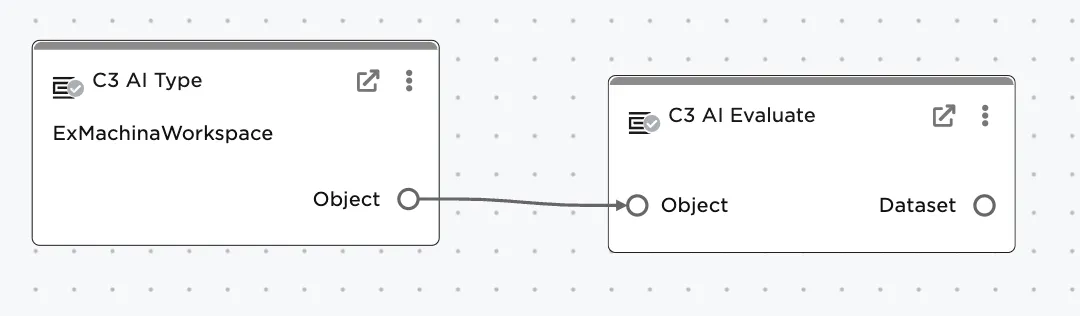
Figure 1: Resulting dataframe with calculated projection ordered.
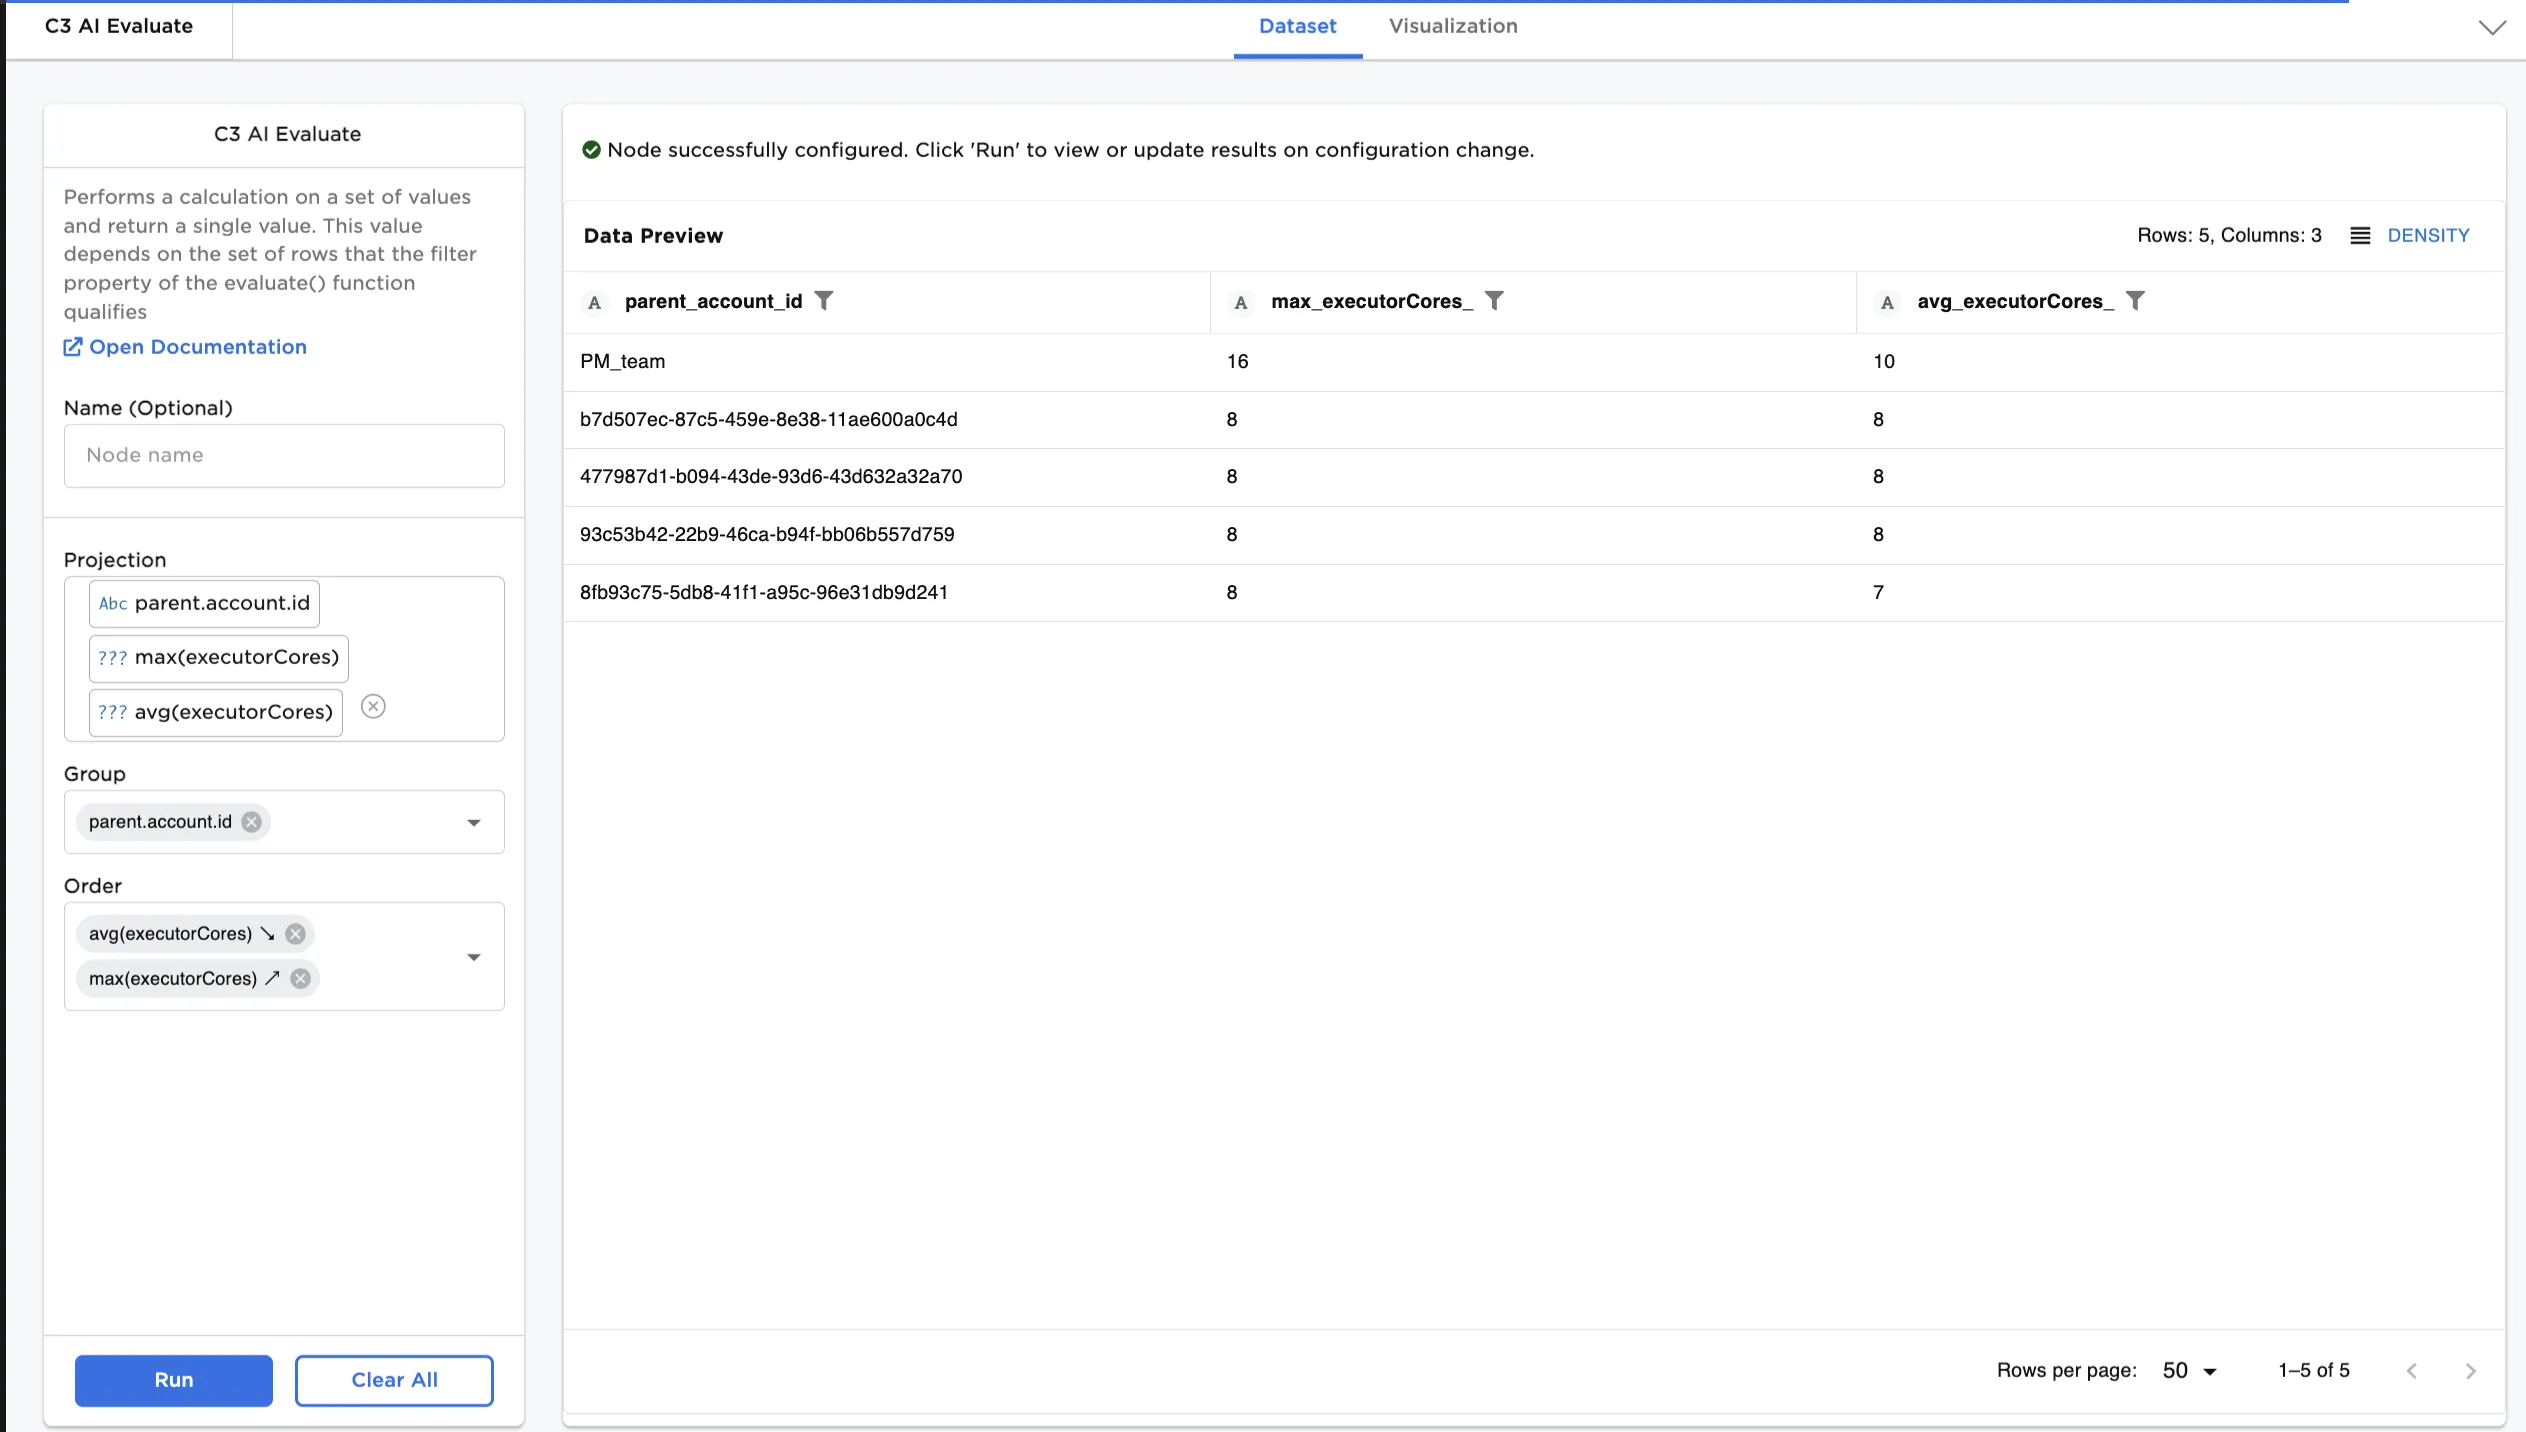
Figure 2: Resulting dataframe with calculated projection ordered.
Examples
Calculate the average and max number of CPU's used in an ExMachinaWorkspace across a set of accounts. The C3 Type contains the information in a numeric field called "executorCores". Each workspace is associated with an account by the relation to its parent account, accessed in dot notation via "parent.account.id".
Type the "projection" function(s) and column(s) to apply the projection to. Also include the column to be used in grouping. The example below calculates the average number of CPUs used by each member in an account, the max number used across all members in an account, and the account IDs.
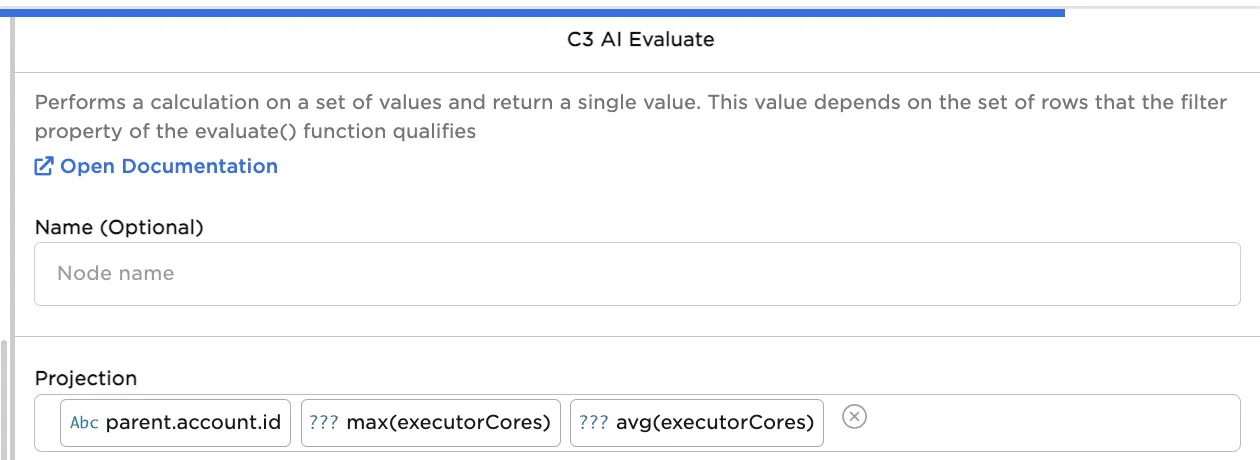
Figure 3: Projection configuration. Be sure to include the grouping column as well.
Select the group by column--in this case the "parent.account.id". This groups the data prior to calculation.
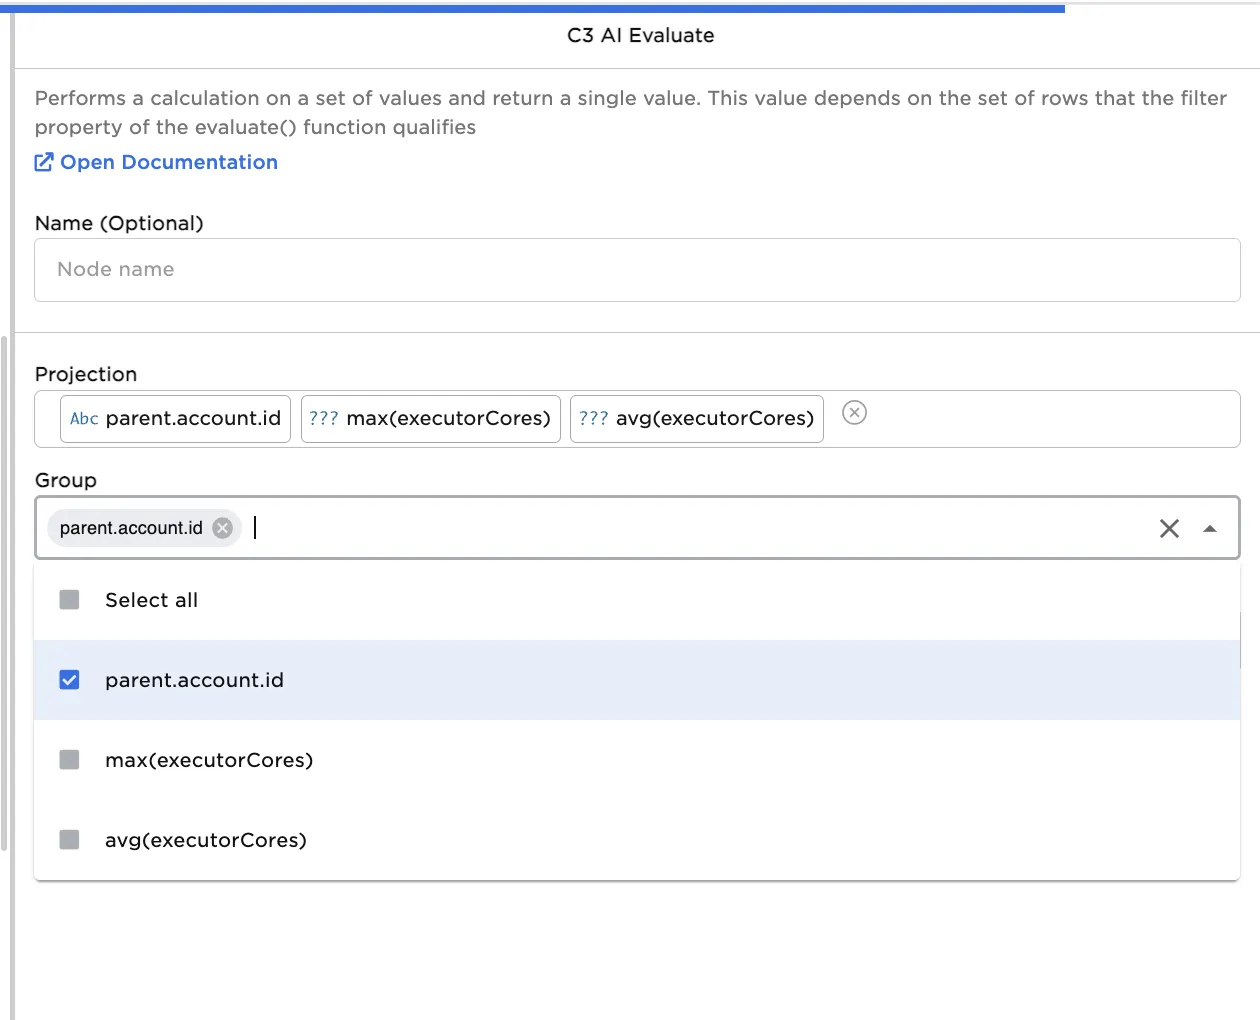
Figure 4: Group by configuration. Select the column to be used to group the data prior to calculation.
Order the resulting data in the desired fashion. You can choose multiple things to order by--in this case order in descending order of average number of CPUs then in ascending order of max number of CPUs used in each account
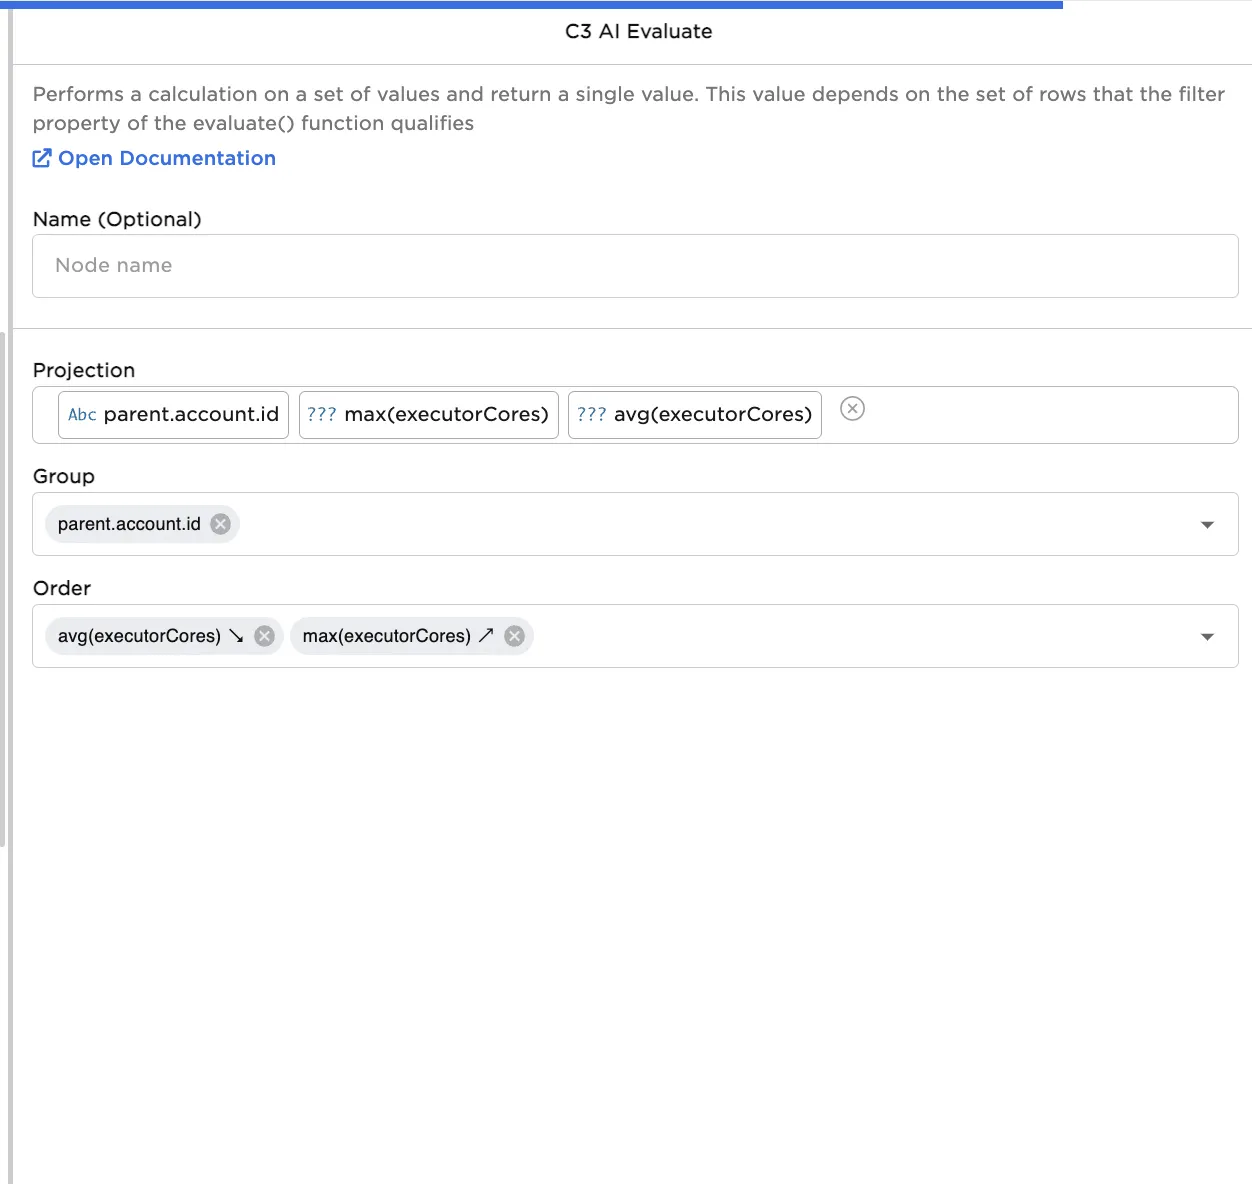
Figure 5: Order the resulting data.
View the resulting calculated data and statistics.
Figure 6: Resulting ordered calculated data frame.