Feature Engineering
Feature engineering is the process of using domain knowledge to extract features from raw data to help predict outcomes.
In our tutorial, we'll do some feature engineering using the telemetry data to help us predict when the turbine fails.
Timeseries Features
The predictive maintenance problem has data that takes the form of a timeseries--each data point or row represents a specific measurement taken at a specified time.
Timeseries features frequently take the form of windows, like an expanding window or a rolling window.
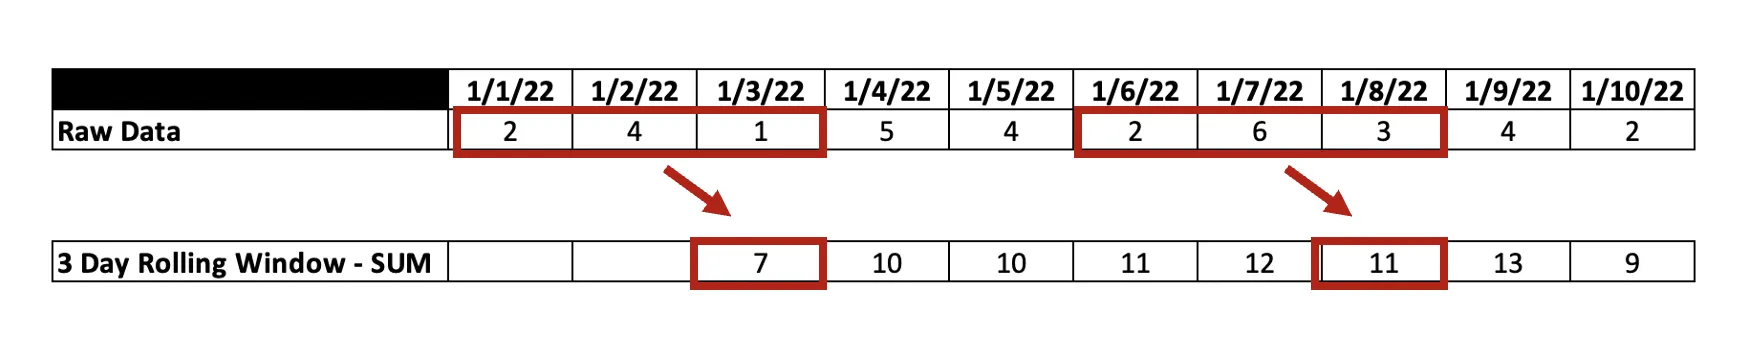
A rolling window, also called a simple moving average, applies a function (e.g., average, max, min, or standard deviation) to data points that fall in a specified window--effectively a subset of the data. Use a rolling window when asking a question like "What's the sum of the past n values at this point in time?"
There are many other possible ways to create features with timeseries data. These include resampling and interpolation, expanding windows, differencing, exponential smoothing, and many more! This tutorial only uses a rolling window.
Features for turbine failure
As an expert on turbine failure, let's assume our domain expertise leads us to believe that turbines become more likely to fail when the power being generated becomes less consistent and has increasing fluctuation. We also think the average gear oil temperature and generator rotator speed over the trailing 6 hours of data are possibly useful. There of course may be other useful features beyond these few we hypothesize are most important.
We'll create the following features in this tutorial:
- 6 and 12 hour averages of the Gear Oil Temperature, Active Power, and Generator Rotator Speed
- 6 and 12 hour standard deviations of the Gear Oil Temperature, Active Power, and Generator Rotator Speed measurements
That's a total of 12 features we'll use to predict turbine failure.
The power of AutoML This may seem like a lot of features, but as you'll see in the next section, AutoML identifies the critical features that are most useful.
Creating a leading indicator
We don't just want to predict a failure. We want to predict the failure with enough time to prevent it!
To do so, we can create a leading indicator that indicates a failure at least 12 hours in advance of the actual failure event. That way our technician can get out to the turbine and fix it!
Create features and labels in Visual Notebooks
Many nodes are available to support feature engineering as described above from the node palette. These are found in the Timeseries and Sequences section, the Prepare section, and the Transform section.
The Transform section contains 40+ nodes across a number of categories. Some are particularly useful for data preparation and clean up, while others are useful for feature creation. There are even options to code custom logic in Python, Spark SQL, or Scala!
Creating our 12 features and our label is easy with Visual Notebooks. It takes a SINGLE NODE to do so.
Start by navigating to the category for timeseries capabilities under Timeseries and Sequences --> Transformation and Feature Engineering
Drag and drop the Rolling Window node from the node palette into the Canvas and connect the output port from the CSV node to the input port of the Rolling Window node.
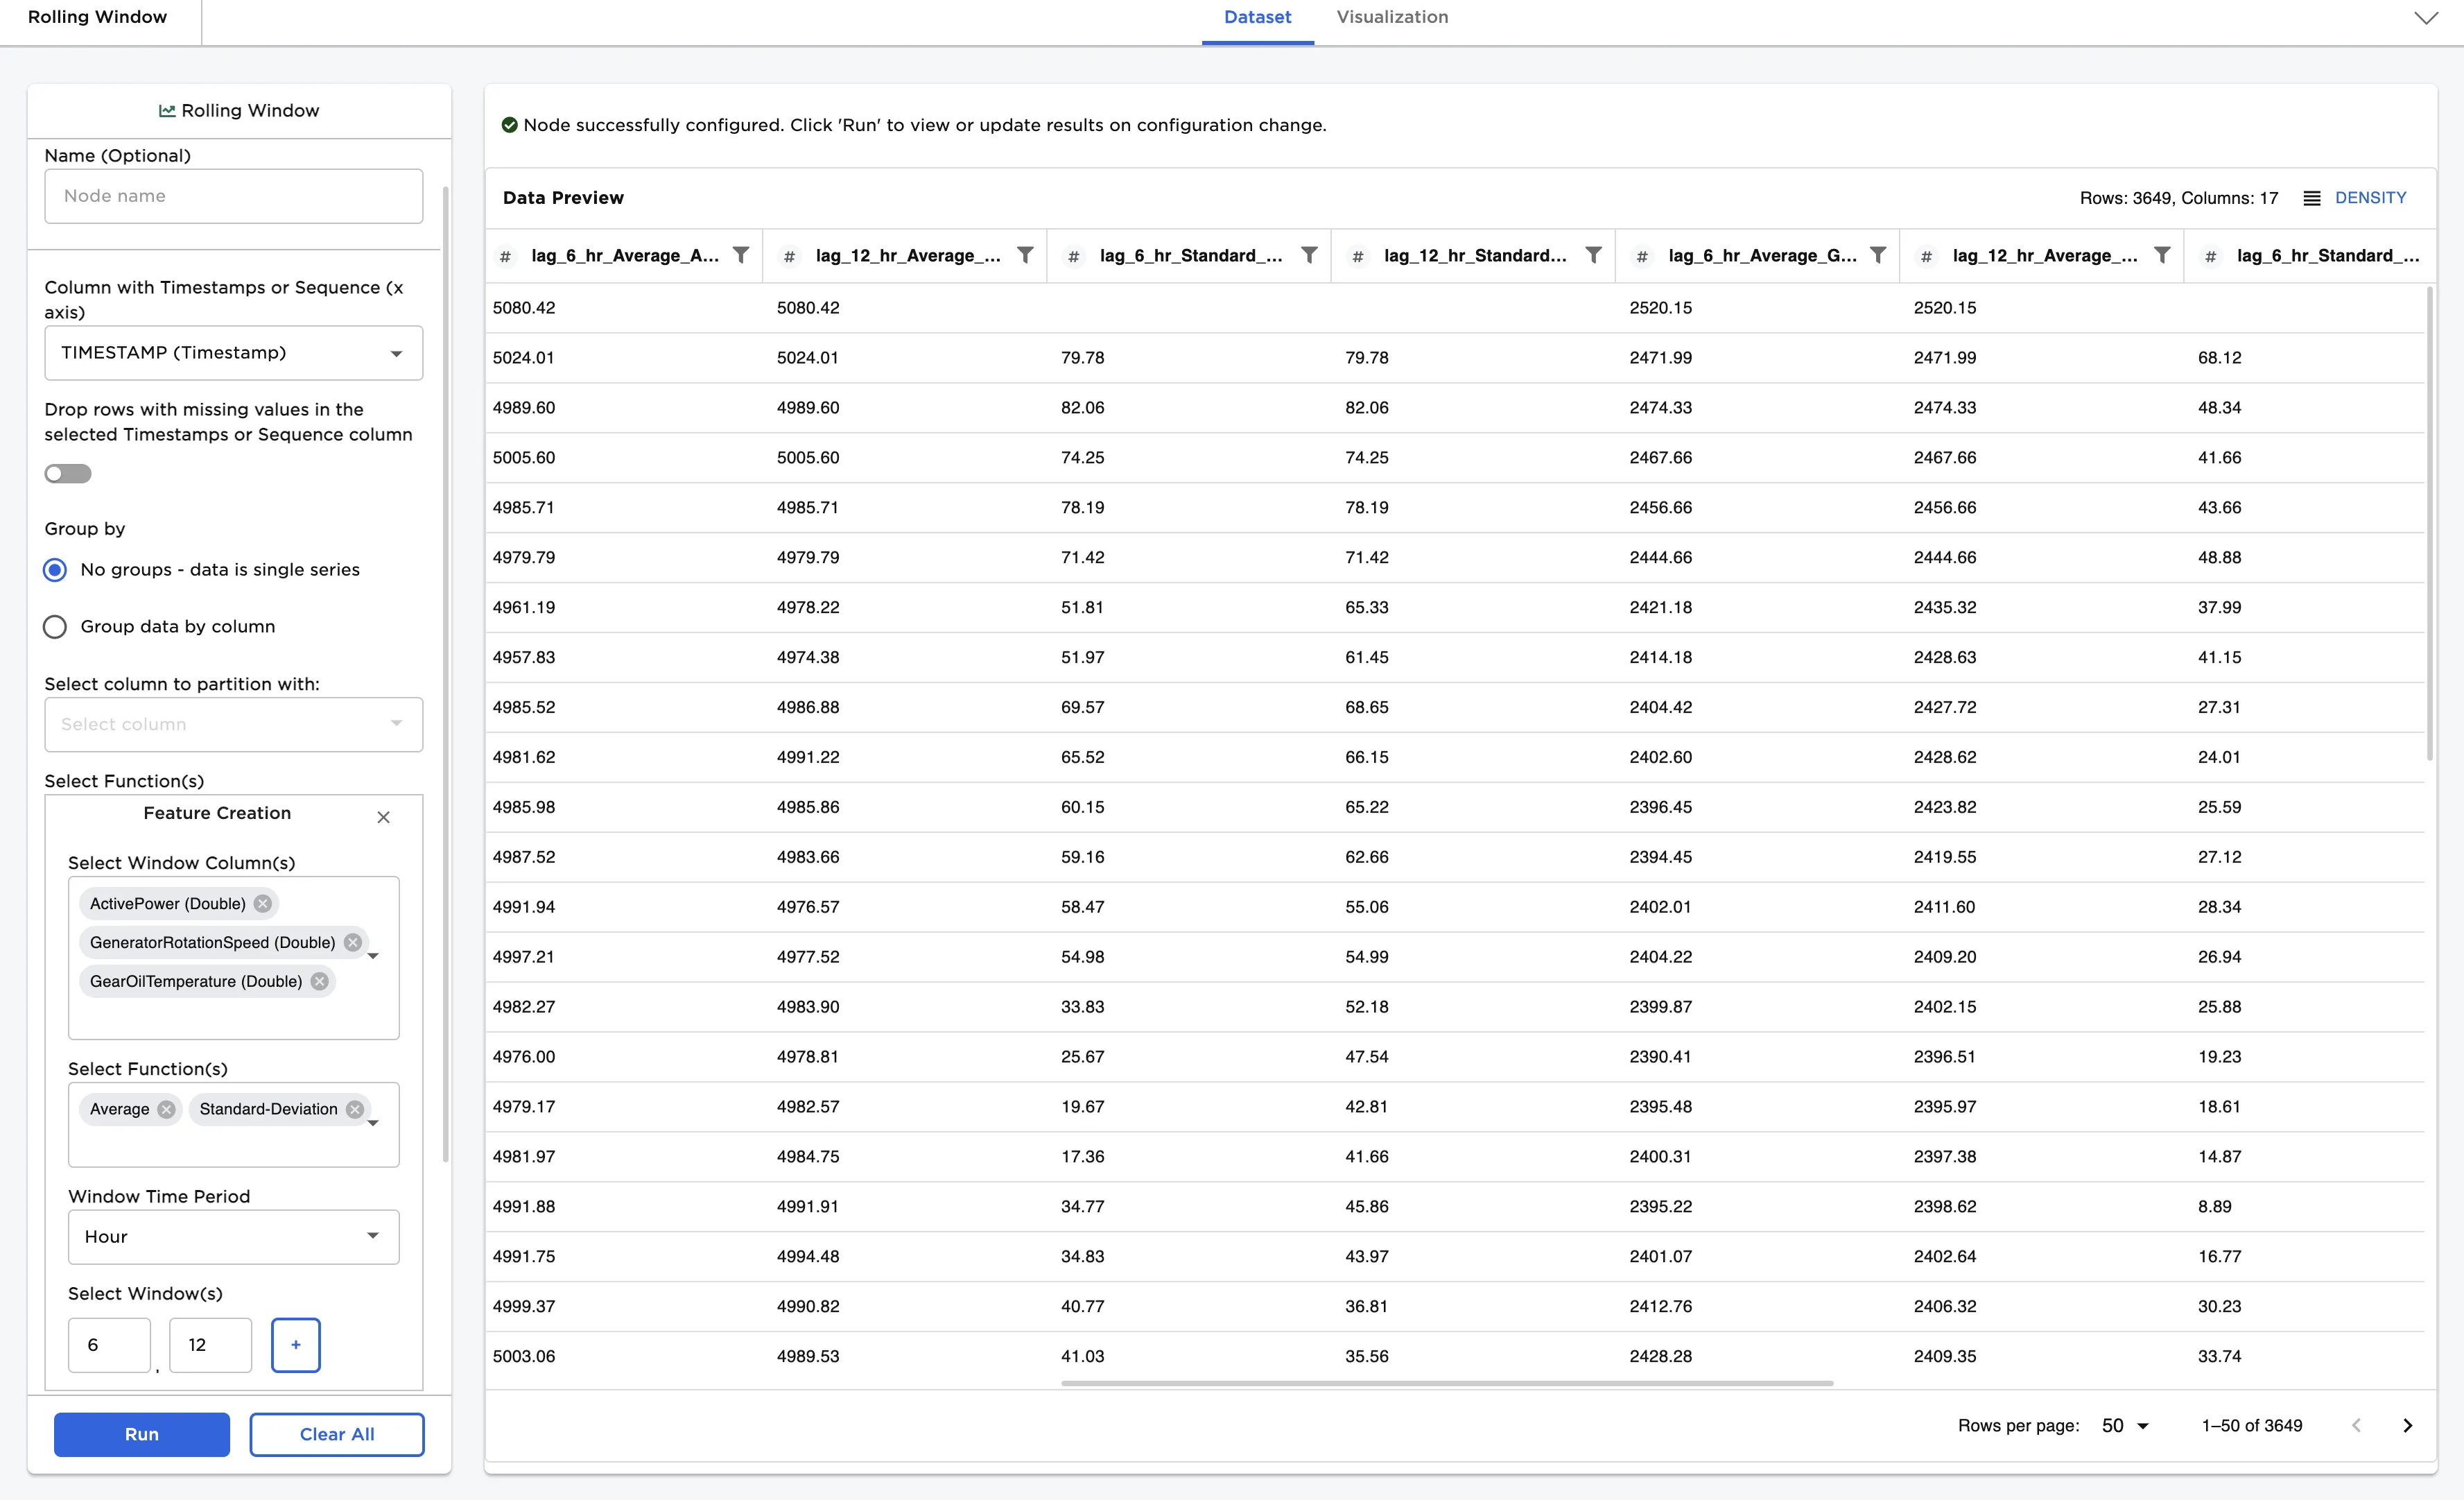
Configure the properties panel:
- Select the timestamp column (TIMESTAMP) from the dropdown menu
- Select the columns to be used to create your features. We want to create rolling windows from the ActivePower, GearOilTemperature, and GeneratorRotationSpeed columns so we'll select all of those at once using the multi-select option
- Choose the window of time to be used--in this case 6 and 12 and the interval Hour. Click the + sign to add the window size. Note we need to type 6 and 12
- Choose the functions to be applied - in our case Average and Standard-deviation
Run and View
Run the node to view the new features that have been created. Just like that you've created 12 new machine learning features.
Your Rolling Window node should look like the image below.
Now you try!
We'll show the answer at the start of the next section!
See if you can adapt what we did above to create the leading indicator mentioned above.
Think about what we should choose for the window. Previously, we used the positive numbers 6 and 12 to create a feature so at each point in time for all of our data points we created a new column that showed the mean / standard deviation of the ActivePower / GearOilTemperature / GeneratorRotationSpeed data over the past 6 and 12 hours up to that datapoint.
Instead of looking at the past 6 or 12 hours, we want to look at the upcoming 12 hours.
The FailureEvent lets us know at a specific point in time if the Turbine has failed with the value 1. What function should we apply to make a list of 1s for all 12 datapoints (representing 12 hours) prior to the actual failure event? Would it be the sum? What happens if the turbine failed twice over a period of 12 hours? In this example we just want to know whether it failed at all, not how many times. What about max?
Take a look at the + Add additional feature button in the node properties panel. Since we are applying a different function with a different window, and we DON'T want to apply that to the features we already created, we'll use this selection.