Machine Learning in Visual Notebooks
Machine learning is all about finding patterns in data. Machine learning models use patterns to make rules that inform future predictions. Visual Notebooks makes it easy to train and deploy machine learning models--whether you've been coding since you were ten or are just beginning your data science journey.
Checkpoint
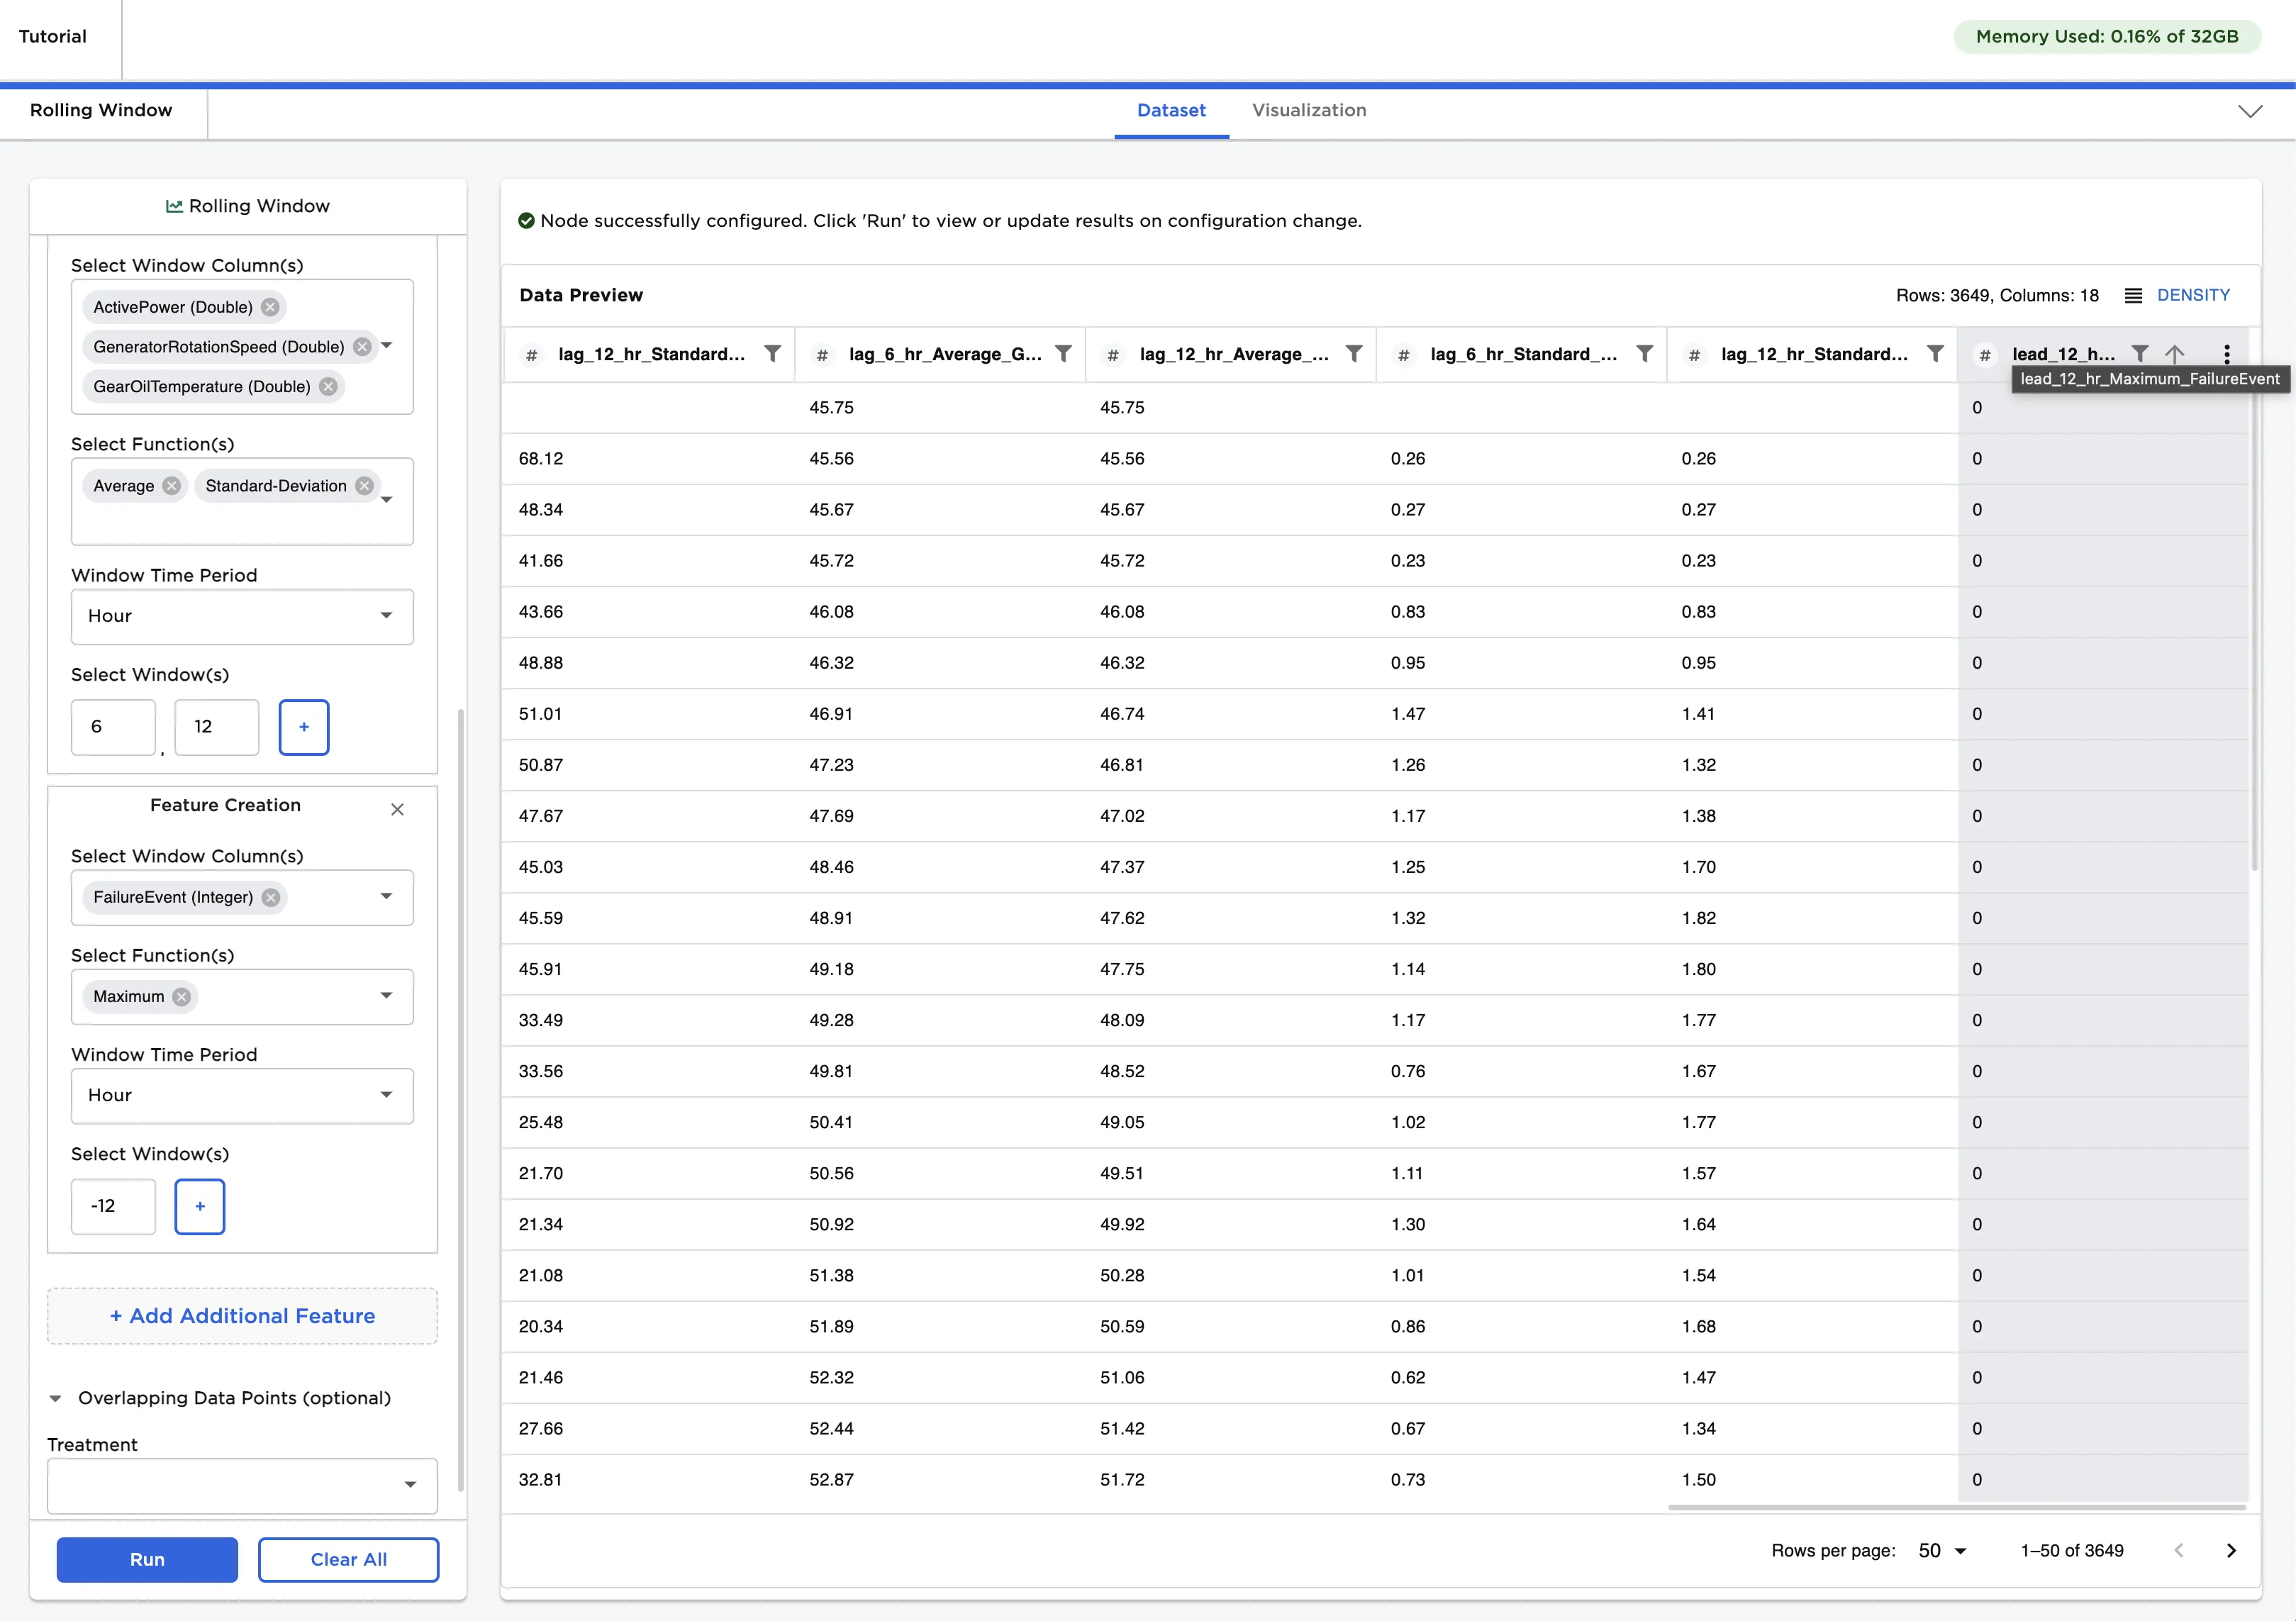
In the last section, we worked on feature engineering with a Rolling Window node. You can also use the Rolling Window node to create the leading indicator--this will become the label we want a machine learning model to predict later in the tutorial.
To make the leading indicator, follow the steps below:
- Select + Add additional feature
- Select FailureEvent for the Select window column(s) field
- Select Maximum for the function
- Select Hour for the Window time period
- Enter "-12" for the window. Since we want to predict failure 12 hours before failure occurs, we use a leading window. This is accomplished by entering a negative number.
Now that we have the value we want to predict and some new features, we can explore machine learning with Visual Notebooks!
Machine Learning Basics
There are two general categories of machine learning: unsupervised and supervised.
Types of Machine Learning:
- Unsupervised learning is used when we have a lot of data but aren't quite sure what to make of it. Maybe we have a bunch of information about customers, but don't necessarily know what to look for in that data. We don't have a specific answer we want the computer to find. Instead, we just want to see if there are any patterns in the data that may be useful.
- Supervised learning is used when we have something specific that we want the computer to be able to predict. Maybe we want the computer to be able to tell us the expected price of an item, or we want it to decide whether a transaction is fraudulent. In both of these cases, we have historical data we can give the computer that has a "right answer." As the computer learns, we hope it can find the right answer without our input.
Let's dig into supervised learning a bit more. There are two main types of supervised learning: classification and regression. In both cases we know the answer we want the computer to predict--the difference is the type of answer we are expecting.
Types of Supervised Learning:
- Classification is used when we want to sort data into distinct groups. Is a transaction fraudulent or safe? Is this email spam or important? Is this animal a dog, a cat, or a fish? In all of these cases, there are a small number of groups that the data falls in. The computer tries to classify each data point into one of the given groups.
- Regression is used when we want to predict a value, not a category. What will the price of this item be? What will the temperature be today? How much of a raise should I expect this year? For each of these questions, there is a range of expected values. The computer makes a prediction within the expected range.
Let's go back to our turbine problem. We want to predict whether a turbine will fail. What kind of machine learning problem is this?
Answer: If you guessed, classification, you're right! We know the answer that we want the computer to predict, which makes this a supervised learning problem. Since our data falls into two distinct groups (times that turbines failed and times that turbines didn't fail), this is a classification problem.
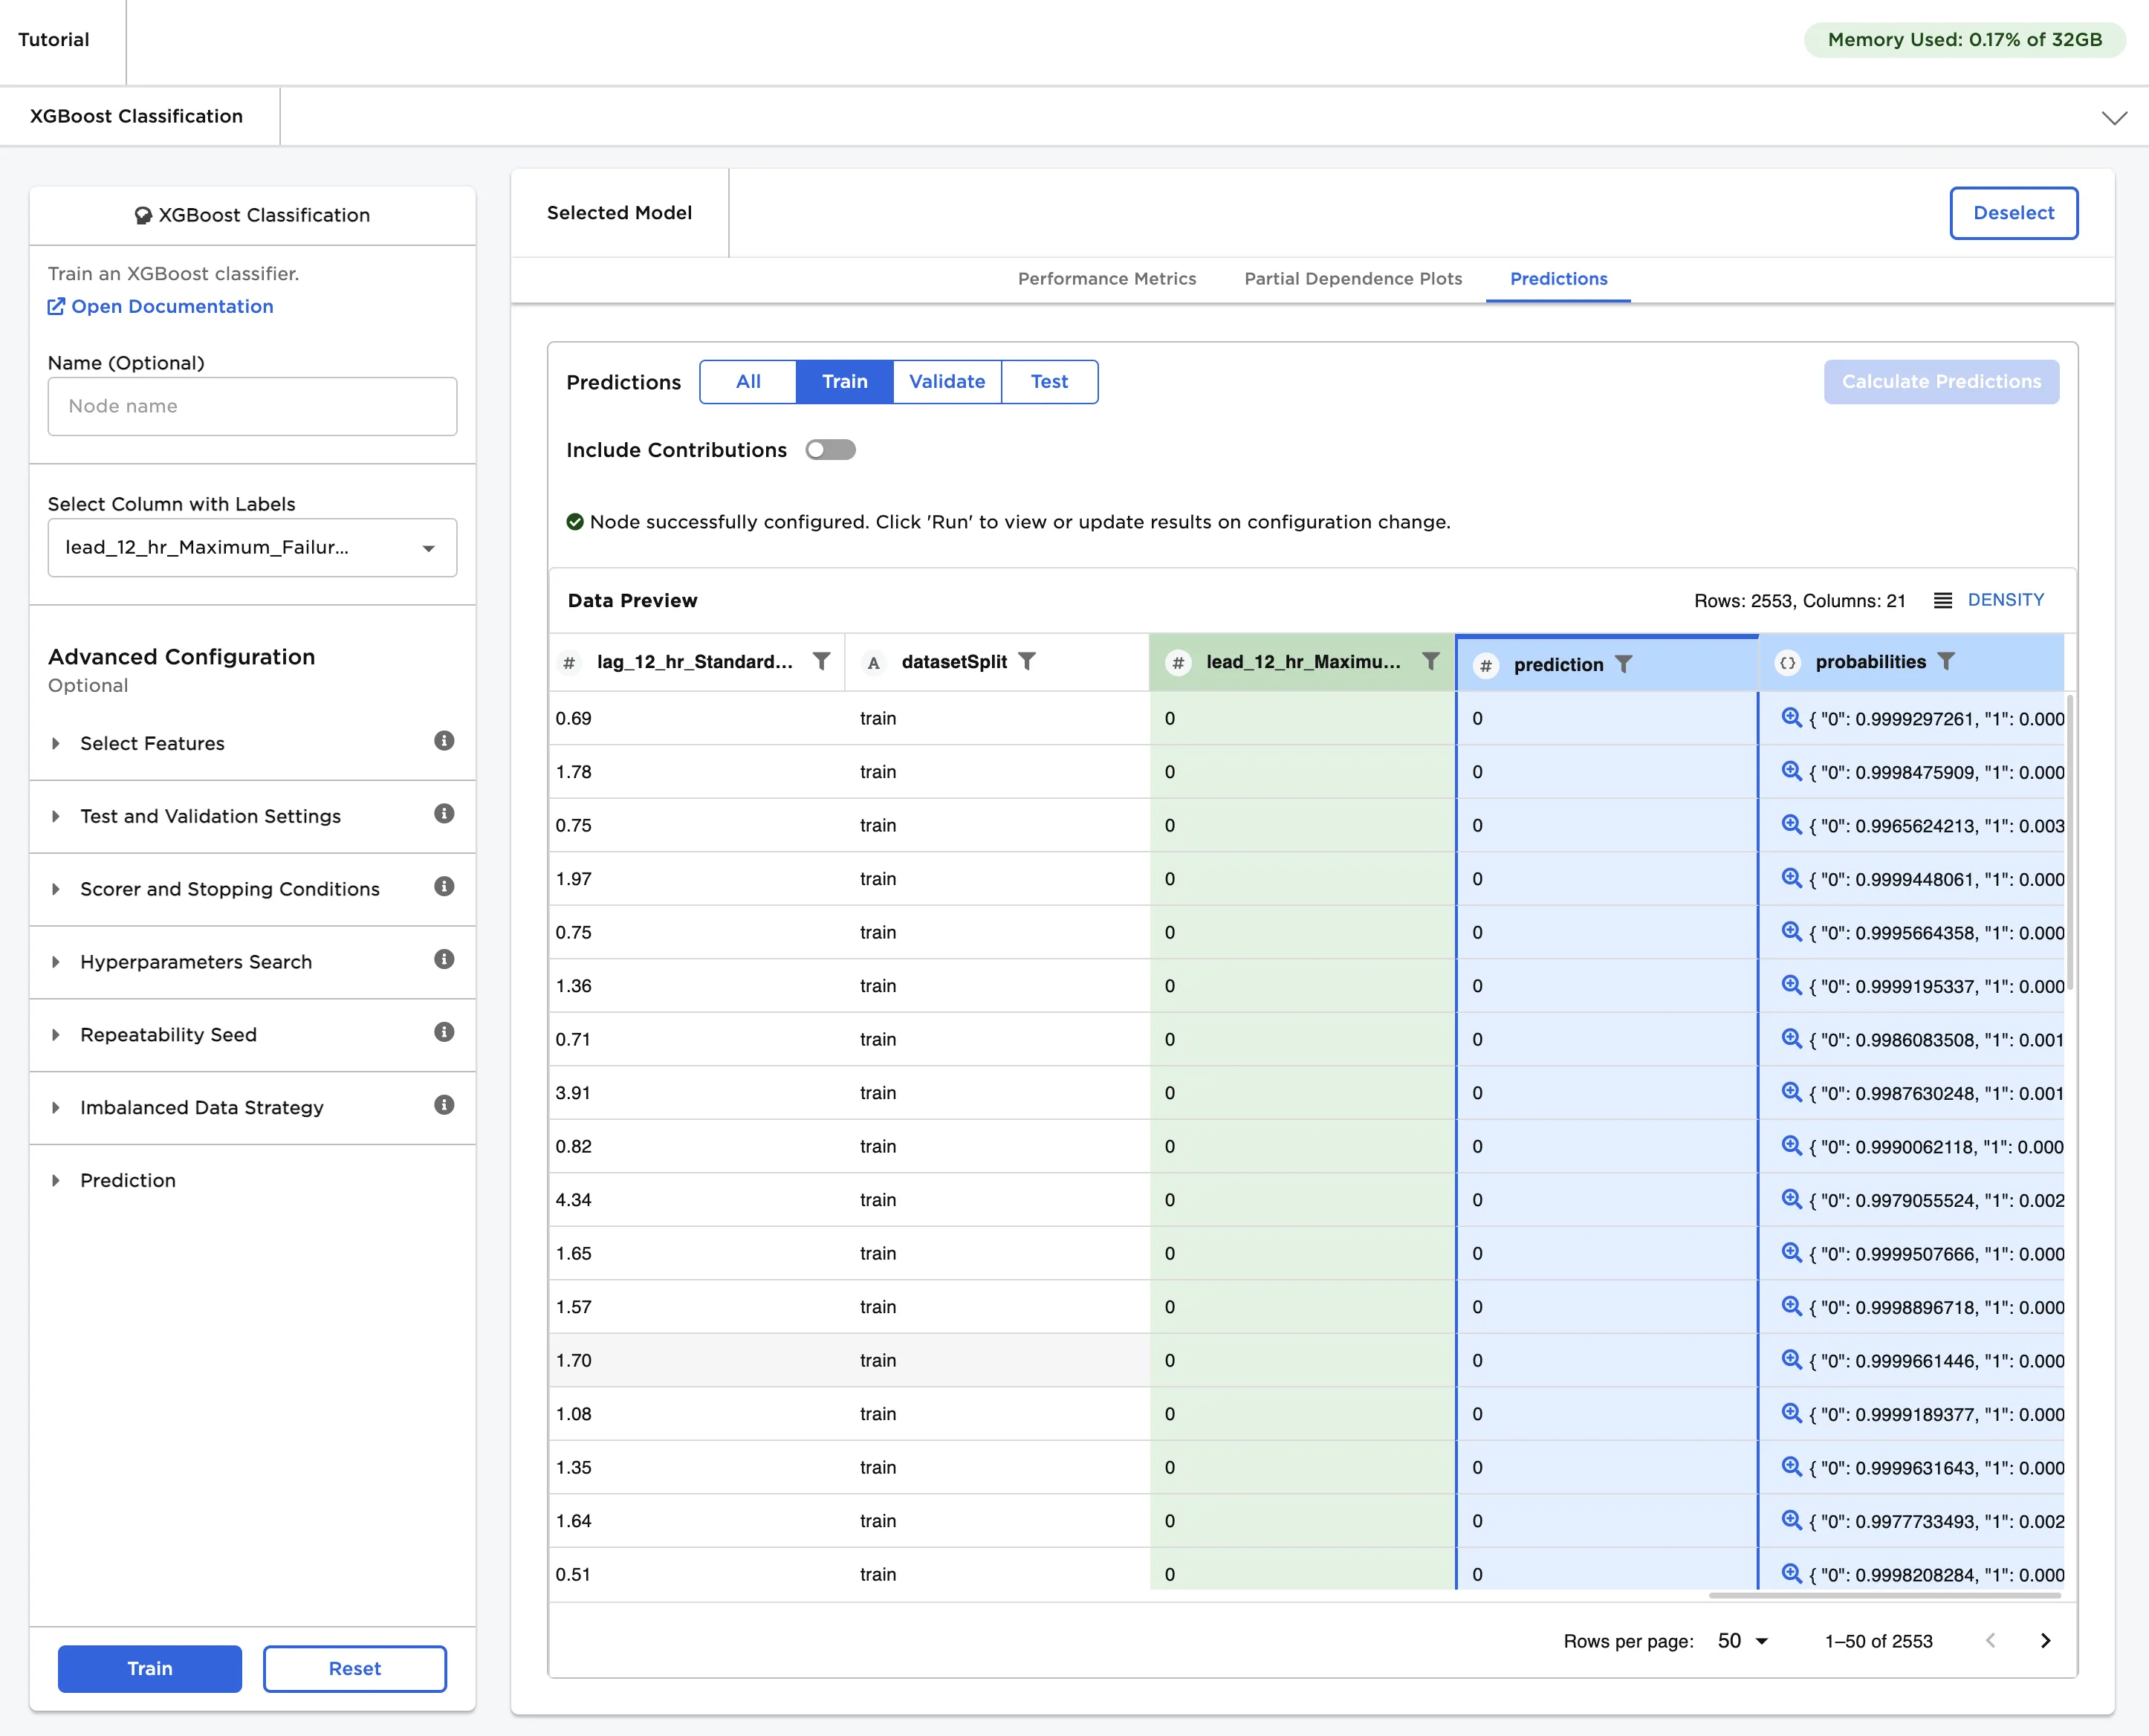
Training a Model
Let's train a classification model. In your project, drag an XGBoost Classification node onto the canvas and connect it to the Rolling Window node.
Double click on the node to configure it.
Select the column we made earlier, "lead_12_hr_Maximum_FailureEvent", for the Select column with labels field. This is the value that we want the computer to predict. Once you've filled in that field, click Train.
That's it! Visual Notebooks automatically trains ten different models, all with slightly different configurations and hyperparameters. Select any one of the models to see more information about it. Switch to the Predictions tab and select Calculate predictions to see the model's predictions on the training data. You've successfully trained a machine learning model!
Important: Training models in a visual notebook is great for ad hoc data science exploration! If you want to save and deploy trained models or do ongoing analytics, however, use an Visual Notebooks ML Pipeline. For more information about ML Pipelines, see the Visual Notebooks capabilities document.