Loading and Profiling Data in Visual Notebooks
Loading Data
Data loading options are under the Input Data category of the node palette.
- Start by navigating to the node palette. In this tutorial, we use the CSV node, which can be found under Input Data --> File Upload
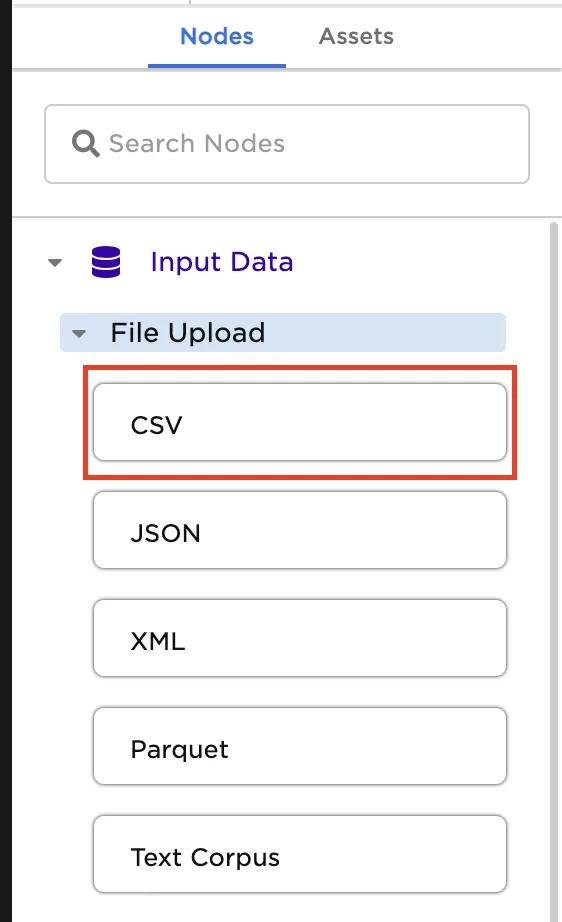
- Drag and drop the CSV node from the node palette onto the canvas
Properties Panel
Note: Selecting a node in the canvas or dragging and dropping a node exposes the properties panel. The properties panel provides a low-code or no-code interface for configuring the selected node. The panel provides tooltips, visual explanations of node functionality, and a link to complete documentation.
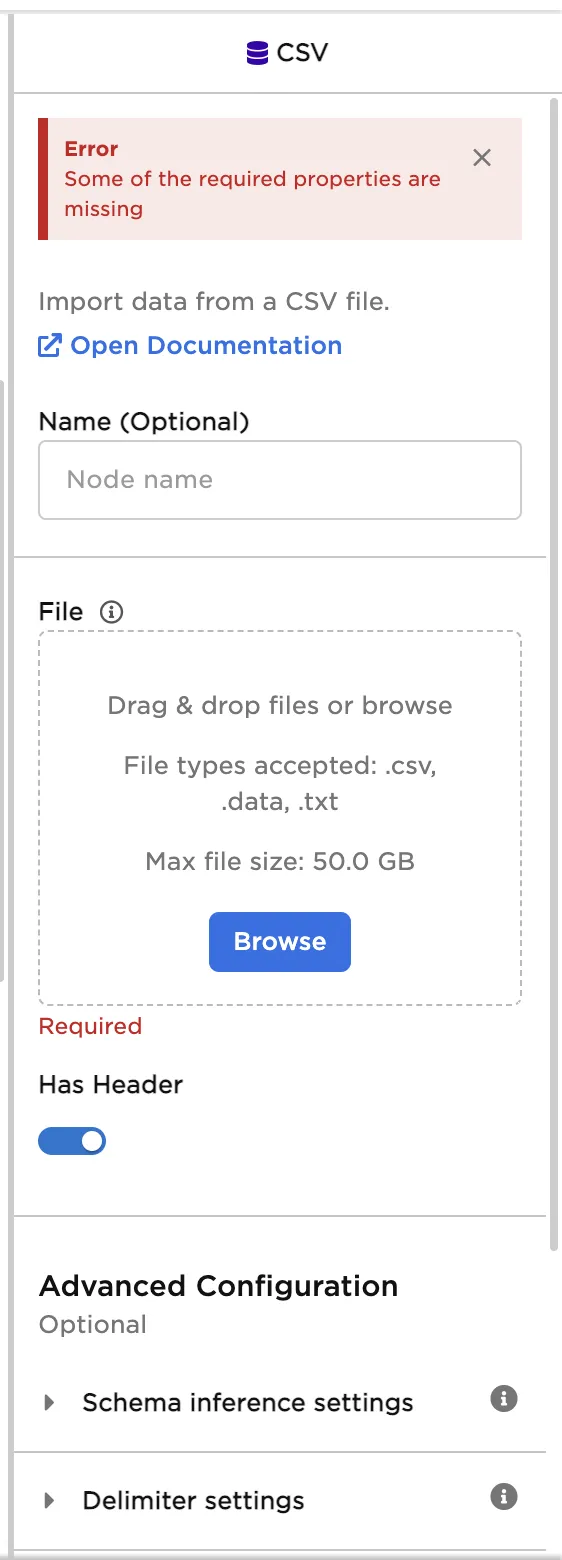
CSV Node Properties Panel
- You can configure the node two ways. You can either use the side properties panel that appears on the canvas, or you can double-click on the node to open a full-screen view. When you're ready to configure the node, select Browse and navigate to the "PredictiveMaitenanceData.csv" file you downloaded at the beginning of this tutorial.
Important: There are many possible configurations of the CSV node. This example uses the default settings. To learn more about possible configurations select View Documentation in the Properties Panel.
Profile and Explore Data
With the data loaded, let's start exploring!
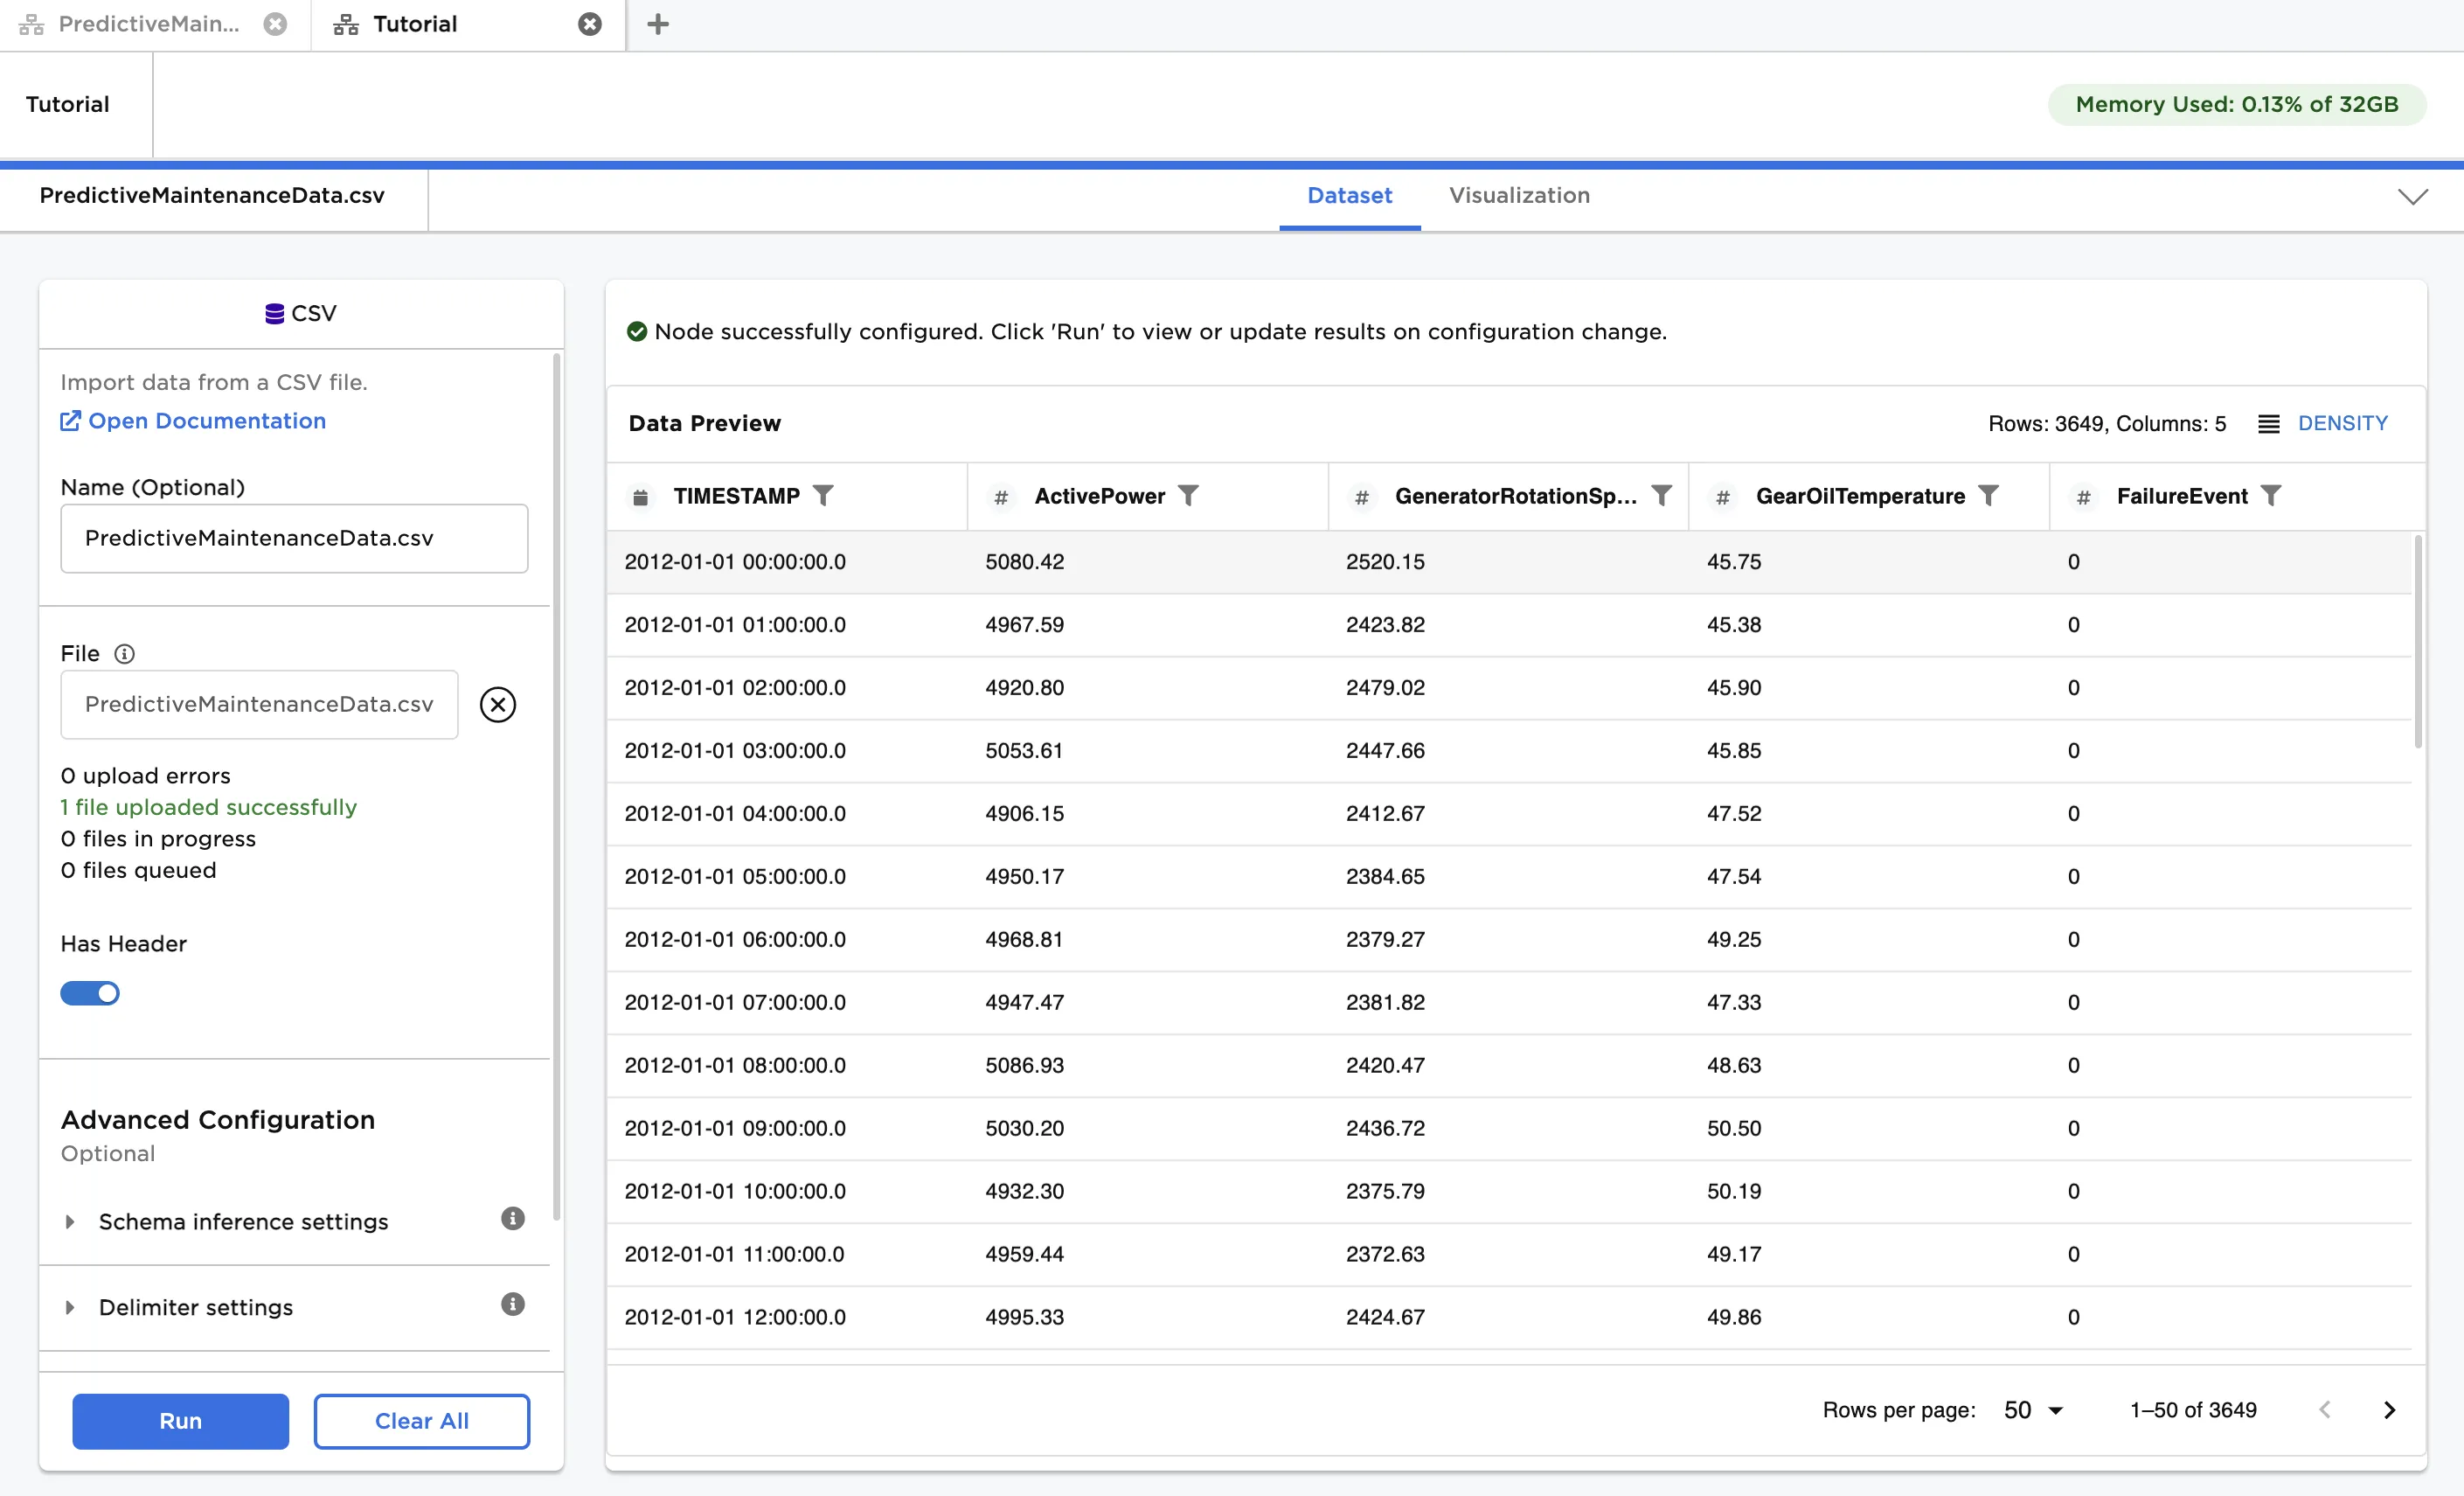
If you haven't already, double-click on the node and select Run to see a dataframe with the data loaded.
Note: The ability to view data is available at any step in the workflow. Immediately confirm logic is being applied appropriately or identify next steps by visually inspecting your data.
The sample data contains 5 columns and over 3,600 rows corresponding to telemetry data and a failure label for a turbine:
- Timestamp - a datetime for when the measurement was taken
- ActivePower - a numerical value measuring the power generated by the turbine.
- GeneratorRotationSpeed - a numerical value corresponding to the turbine rotational speed.
- GearOilTemperature - a numerical value measuring temperature of the oil.
- FailureEvent - a point in time indicator of when a turbine is offline and not working.
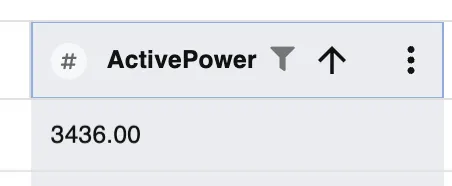
Note: By default Visual Notebooks automatically inferred the column data types. The inferred schema can be viewed by the icon indicator next to each column name.
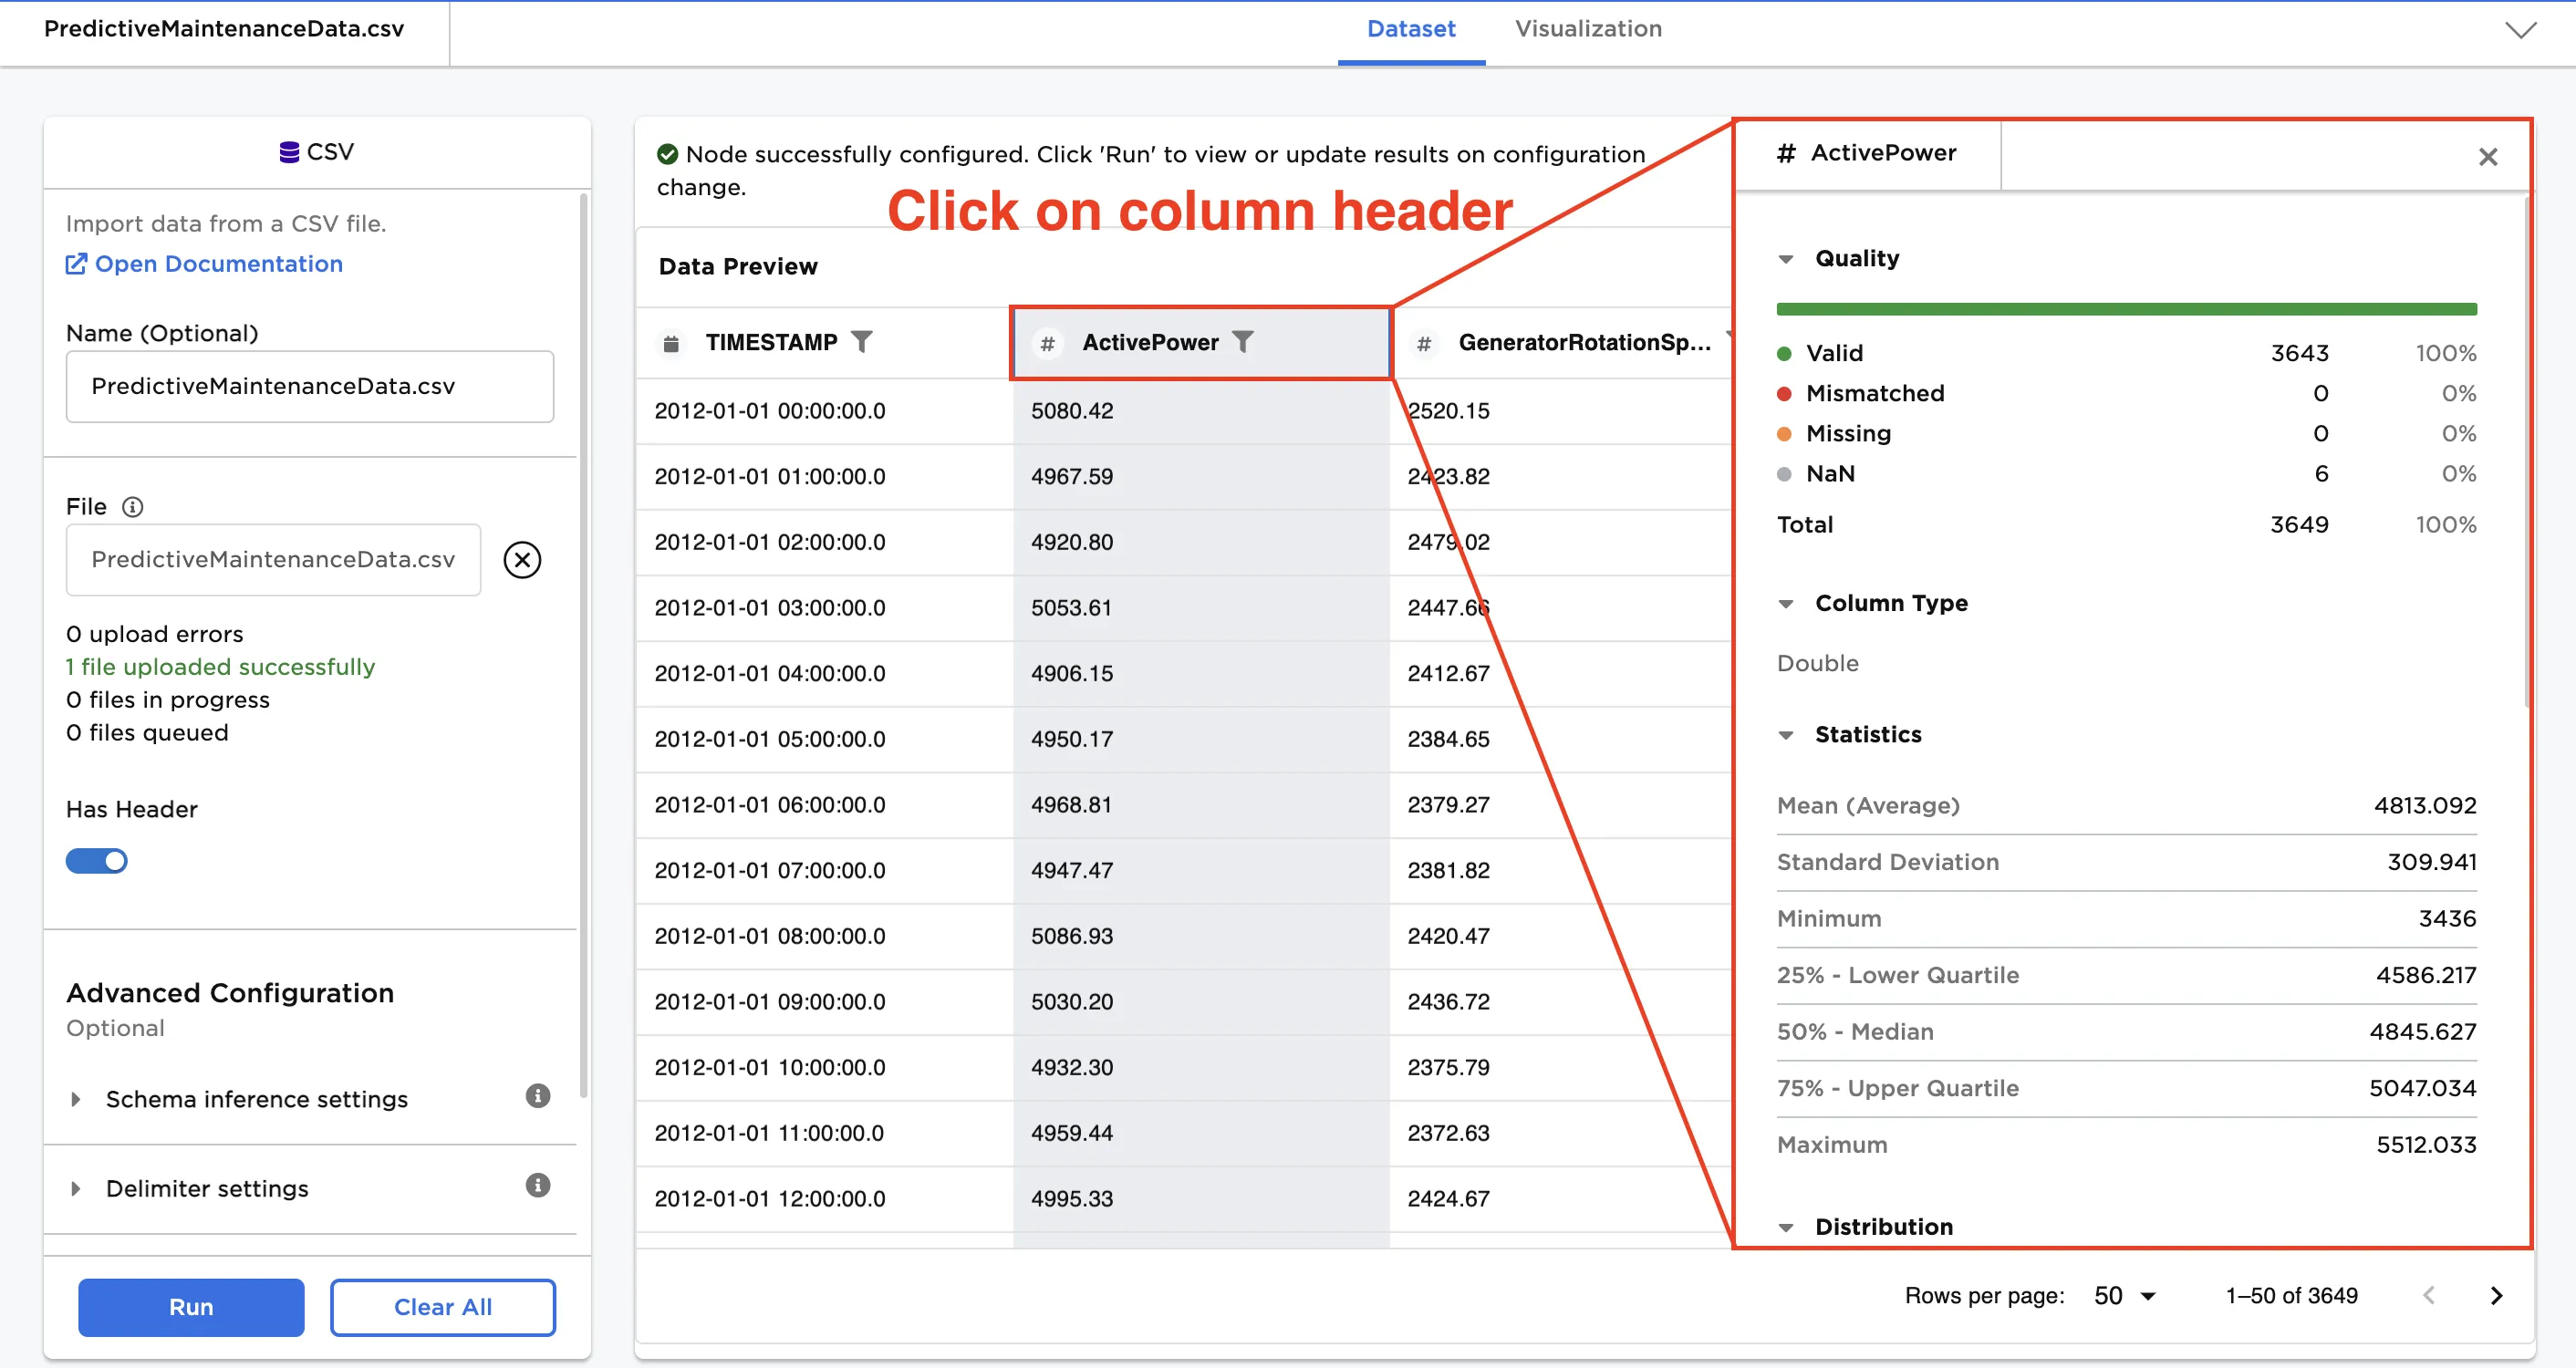
The table view lets you:
- Profile data by selecting a column header
Note: If your data has missing values or outliers, you can use the Prepare section of the node palette to update your data. There are 60+ out-of-the-box functions for data preparation and harmonization.
In this tutorial, the data is in good shape so we can begin further analysis!
- Sort, filter, format, or pin the column
Sort: Click the arrow to sort in ascending or descending order.
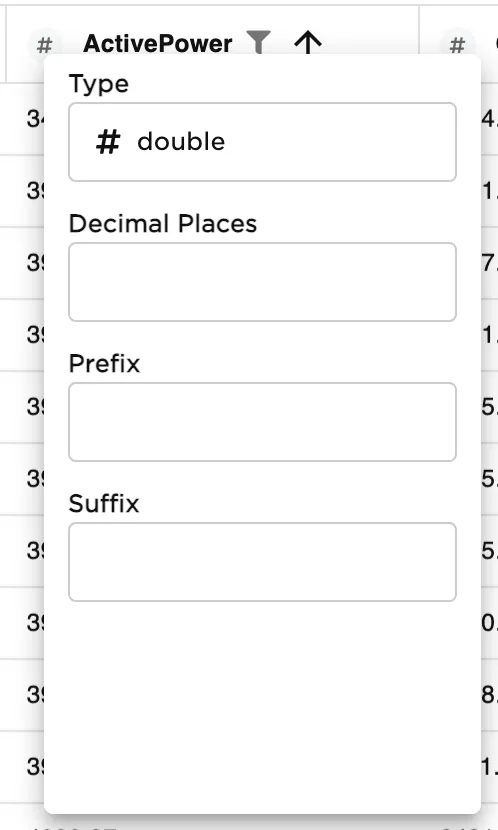
Format: Click on the icon next to a column header to change how the data is presented.
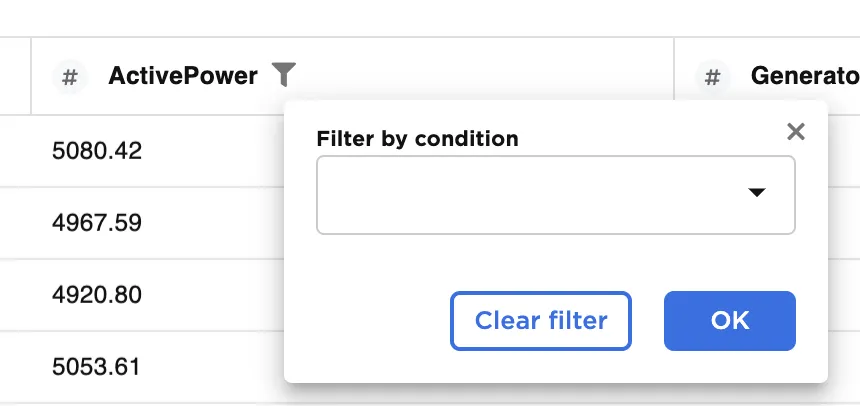
Filter: Apply a filter to a numerical, string, or date column by selecting the funnel icon in the column header.
Pin: Pin columns to the left or right of the dataframe to keep them in view.
Configuration changes made when viewing the dataframe are not "persisted" and are only available once while exploring data. Closing a node removes the applied formatting. Use nodes for sorting and filtering to permanently modify the dataframe.
To exit the full-screen dataframe view and return to the canvas, select the down carat in the top right corner of the screen.